
 ?Mathematical formulae have been encoded as MathML and are displayed in this HTML version using MathJax in order to improve their display. Uncheck the box to turn MathJax off. This feature requires Javascript. Click on a formula to zoom.
ABSTRACT
Land use/land cover (LULC) changes due to natural and anthropogenic interference have altered the hydrological processes of the Omo-Gibe basin, Ethiopia. In this study, hydrological modelling and remote sensing techniques were used to assess LULC changes in water availability in the basin. The LULCs were classified from satellite imagery from 1987 to 2017 using normalized difference indices, and the changes were observed to be significant for the basin. The calibration and validation performance of the Soil and Water Assessment Tool (SWAT) model using the observed streamflow and sediment yield for the basin was satisfactory. Afterwards, the SWAT was used to simulate the runoffs and sediment yields for different management practices such as introducing filter strips, parallel terracing, and reforestation. The sediment yields in critical sub-basins of Omo-Gibe reduced significantly on reforestation as the best practice. The study outputs are helpful for the various stakeholders and policymakers in managing water resources properly.
Editor S. Archfield; Associate editor (not assigned)
1 Introduction
River basins are dynamic and complex systems involving several natural or anthropogenic physical processes at various spatial and temporal scales (Deshmukh et al. Citation2013). Natural and anthropogenic activities can often affect basin hydrology adversely. Agricultural expansion and intensification, urban growth, and changes in economic levels force land use/land cover (LULC) changes in river basins to meet the increasing population’s demands (Lee Citation2005, Smith et al. Citation2016, Aneseyee et al. Citation2020a). The uncertainties regarding land use resulting from population growth, urbanization, and climate change are increasing at an alarming rate (Tan et al. Citation2015).
Due to rapid population growth, the developing countries find it challenging to manage the impacts of LULC and climate change on their river basins (De Sherbinin Citation2002, Aneseyee et al. Citation2020a). LULC changes increasingly affect the biodiversity, nutrient, and hydrological cycles of the environment by impacting the soil and water, fauna and flora, and microclimate (Lambin et al. Citation2003). LULC affects hydrological processes (Dosdogru et al. Citation2020) such as precipitation, surface runoff, infiltration, evaporation, and groundwater flow. It can change biodiversity as well as the quality and quantity of surface water and groundwater. For example, deforestation causes variations in the hydrological cycle, leading to reductions in rainfall and faster post-precipitation floods (Legesse et al. Citation2003). Furthermore, a long-term decrease in the evapotranspiration and recycling of water causes variations in a region’s climate and weather patterns (Wang et al. Citation2014). Understanding watershed hydrology is very important in assessing the potential impact of LULC and climate changes on catchment hydrological process under land-use dynamics (Beyene et al. Citation2010). Some of the existing problems and their impact on catchment hydrology involve water mismanagement with increasing population growth and technology.
As natural and human-made events highly influence LULC changes, LULC dynamics are treated as a product of complex interactions between environmental and ecological conditions that can occur at different temporal and spatial scales (Reid et al. Citation2000). According to Lambin et al. (Citation2003), evaluating the impact of LULC changes needs to be accounted for in formulating future basin-level water resource management policies. Management policies can evolve appropriately through computational modelling of hydrological processes (Deshmukh et al. Citation2013, Niraula et al. Citation2015, Dosdogru et al. Citation2020).
The Omo-Gibe River basin exists in the two administrative states of Ethiopia: (i) Oromia; and (ii) Southern Nations, Nationalities, and People’s Region (SNNPR). The basin consists of several sub-catchments, and it is the primary source of water for the region’s economy. The water resource projects in the basin also aid the development and sustainability of the downstream ecosystems. As elsewhere, the developmental activities are altering the land cover of the region. Effective use and management of LULC under consideration of water resources (Mango et al. Citation2011) are significant when considering the effect of catchment hydrology and water resources on the basin’s development. It is necessary to optimize these potential water resources with the increasing population growth and water demand to benefit downstream ecology.
Analysing the sensitive parameters affecting the basin and understanding how LULC influences the streamflow can allow planners to formulate policies to minimize the unwanted effects of future LULC changes on catchment streamflow patterns (Mango et al. Citation2011, Niraula et al. Citation2015, Setyorini et al. Citation2017). However, to predict the future effects of LULC, it is vital to have an understanding of historical LULCs on its flow. The hydrological impact assessment of LULC dynamics using historical LULCs substantially assists in planning water resource development. The impacts of LULC changes from 1989 to 2013 on the Gojeb watershed, a sub-catchment of the Omo-Gibe basin, revealed the anthropogenic influence on the streamflow (Choto and Fetene Citation2019). Similarly, for the Winike watershed (Aneseyee et al. Citation2020a, 2020b), a sub-catchment of Omo-Gibe, extensive soil losses and changes in the ecosystem services due to wide LULC changes in the sub-basin were revealed.
However, past studies on the effects of LULC changes on streamflow and soil losses have mainly been carried out at sub-catchment scales, and studies on the entire Omo-Gibe River basin are rare. Hydro-projects that are of significance to Ethiopia’s economy are being built on this river basin. Moreover, the Omo-Gibe basin is anticipated to have rapid population growth from 2020 to 2035 (FDRE-PCC Citation2008), increasing future water demands and putting more stress on the water resources projects. Hence, studies on the impact of LULC changes on water resource projects in the basin have importance regarding future demands, especially since the inception of the largest project in the basin – the Gibe III hydro-project.
The Omo-Gibe River basin is unique in its characteristics. Therefore, the main objective of this study is to analyse the effect of LULC change on the surface water availability of Omo-Gibe, using remote sensing techniques and hydrological models (SWAT). Calibration and validation of the SWAT model for streamflow and sediment yield were carried out using different LULC changes. Further, the study also assessed the best management practice (BMP) scenarios to minimize the sediment deposits in the basin upstream of Gibe III hydropower dam in Omo-Gibe. Simulations of BMPs can assess how different scenarios can impact and change the Omo-Gibe basin’s landscapes and productivity. The results from BMP simulations can aid in designing and distinguishing effective policies to mitigate the effects of LULC changes on agriculture and water resources. Hence, the work described here is vital for water resource engineers and planners in the basin. Also, BMP simulations using the SWAT model approach are rarely studied in the African context, particularly in Ethiopia, where food and water security are of prime concern.
2 Materials and methods
2.1 Study area
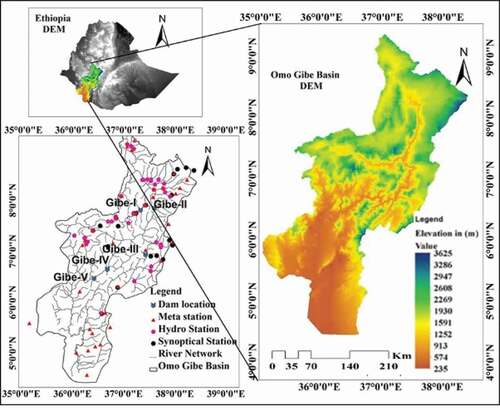
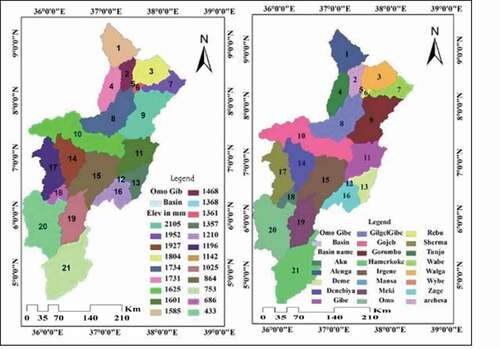
The Omo-Gibe River basin is geographically located between latitudes 4°25ʹ40ʺN and 9°2ʹ48ʺN and between longitudes 34°55ʹ50ʺE and 38°25ʹ42ʺE. The total area of the basin is about 79500 km2. The maximum elevation of the Omo-Gibe basin is 3625 m above mean sea level (AMSL), and the minimum is 235 m AMSL (). This large deviation in the elevation and cross-sectional profile shows the basin has rugged topography, especially in its upstream part. The basin’s northern portion receives higher rainfall than the southern downstream, which is affected mainly by flooding, landslides, and sedimentation. The average annual precipitation and evapotranspiration are about 1640 mm and 1400 mm, respectively. The average temperature varies from 15 to 29°C. The region experiences an intense drought due to the changing rainfall pattern and variability, causing food and water security issues in the basin (Ayalew Citation2009). The basin has a varied LULC that includes forestry, grassland, woodland, bare land, and water bodies. Water from the Omo-Gibe basin drains to Lake Turkana, which is a transboundary water body. Omo-Gibe is Ethiopia’s second-largest river system, in terms of runoff volume generated, after the Blue Nile River. It is also the most densely populated basin in Ethiopia. Due to the rapid growth of population and demographic transitions, the basin experiences rapid changes in LULC. Consequently, the streamflow has become more variable in the last many years (Avery Citation2012), resulting in increased flooding accompanied by accelerated sediment transport towards downstream areas. The basin has some functional hydro-projects like Gibe I, Gibe II, Gibe III, and Gibe IV (Aneseyee et al. Citation2020b), which may be affected by the extensive LULC changes. Gibe I and Gibe II are situated on the Gilgel-Gibe tributary of the Omo-Gibe River, whereas the other projects are on the main Omo-Gibe River (). The water from the Gibe II reservoir in Gilgel Gibe is diverted through a tunnel for more than 25 km downstream in the Omo-Gibe River for power generation.
Figure 1. DEM and location map of the hydro-climatological stations of the Omo-Gibe basin. Gibe I = 184 MW, Gibe II = 420 MW, Gibe III = 1870 MW, Gibe IV = 1472 MW under construction, Gibe V = 560 MW proposed
2.2 Data used
The study collected appropriate data and information from various agencies, associations, institutions, and field observations, including meteorological and hydrological data, land use and soil data, and information from a digital elevation model (DEM). The DEM used in this study was obtained from the NASA Shuttle Radar Topographic Mission (SRTM) with a spatial resolution of 30 m × 30 m. Topographic maps of scale 1:50 000 and a global positioning system (GPS) for ground verification were also used. The remote sensing images were obtained from Landsat satellites for the years 1987, 2002, and 2017 (). The SWAT model requires information on different soil textural and physicochemical properties such as soil texture, water content, hydraulic conductivity, bulk density, and organic carbon content for different layers of each soil type. These data were collated from the following sources: Soil and Terrain Database for northeastern Africa (FAO Citation1998); Major Soils of the world (FAO Citation2002); Digital Soil Map of the World and Derived Soil Properties (FAO Citation1995); Properties and Management of Soils of the Tropics (Van Wambeke Citation2003); and Omo Gibe River Basin Integrated Development Master Plan Project – Semi detailed Soil Survey and the Soils of Adjani Area, Ethiopia (SCRP Citation2000). Rainfall observations from different meteorological stations obtained from the National Metrological Agency, Ethiopia, were used as precipitation inputs in the SWAT model. The LULC data obtained from different agencies were inputted into ArcGIS, and the LULC themes were classified using normalized indices (Section 2.3.2). The spatial and temporal hydroclimatological data were also used to estimate the streamflow and sediment yield in Omo-Gibe. Before applying these data in the SWAT model, the data quality, in terms of factors such as missing data, persistence, and inconsistencies, was assessed and corrected using different statistical techniques present in the software XLSTAT Tools (Ali Citation2017).
Table 1. Description of spatially varied remote sensing satellite imagery used for Omo-Gibe basin
2.3 Methodology
The methodology for processing the data, analysing and interpreting the LULC changes, SWAT model calibration and validation, and generating the BMP scenarios is illustrated in and discussed in the following sections.
Figure 2. Flowchart of the methodology for LULC change detection
2.3.1 LULC classification and accuracy assessment
The research used Landsat imagery of three different years (i.e. 1987, 2002, and 2017) for the LULC change analysis. These LULC images were downloaded from the United States Geological Survey (USGS) website. The images were improved using various correction techniques like noise reduction, histogram equalization, and haze reduction in ERDAS IMAGINE 2014 and ArcGIS 10.2 software. After adjusting the images, we generated LULC maps of the study area for different periods using a supervised image classification technique. The necessary information for image interpretation and band combinations for Landsat images was referred from the leading Global Land Cover Facility (GLCF) website of the University of Maryland. We classified the 1987 LULC imagery from the Landsat 4–5 TM satellite data, 2002 LULC from Landsat 7 Thematic Mappers Plus (ETM+), and 2017 LULC from the Landsat 8 Operational Land Imagers (OLI) and Thermal Infrared Sensor (TIRS). The accuracy assessment of the classified satellite imagery was carried out using statistical indicators (i.e. overall accuracy, producers’ accuracy, users’ accuracy, and kappa coefficient) described by previous researchers (Congalton Citation1991, Verma et al. Citation2020).
2.3.2 Normalized difference indices
The various normalized indices classify the remotely sensed images for different LULC types.
2.3.2.1 Normalized difference vegetation index (NDVI)
The NDVI is a useful index for defining good coverage of vegetation (Gao Citation1996). It distinguishes healthy plants from unhealthy plants using reflections from near infrared (NIR) to the red band of the electromagnetic spectrum ranging from 0.7 to 1.3 µm. Within these two bands for NDVI, high reflectance of the spectral rays is accounted in the NIR region and high absorption in the red spectrum (Dennison et al. Citation2005):
The NDVI ranges from −1 to +1. Values of +1 indicate spectral reflectance from NIR (Dennison et al. Citation2005, Jiang et al. Citation2006), and −1 indicates red reflectance. NDVI values between −1 and 0 can represent water bodies; −0.1 to 0.1 barren rocks, sand, or snow; 0.2 to 0.5 shrublands and grasslands or senescing crops; and 0.6 to 1.0 moderate and dense vegetation (). The NDVI index also helps detect land cover change caused by human activities such as buildings and structures, and spatial and temporal changes of agricultural vegetation.
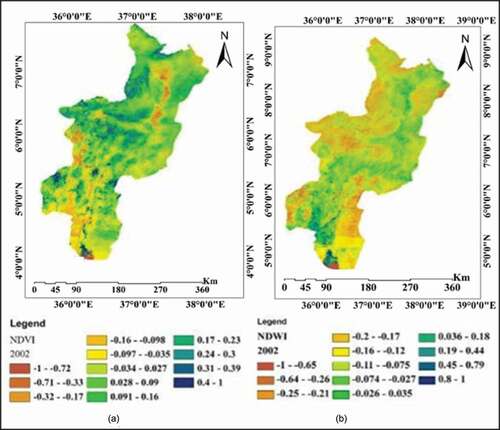
Figure 3. Landsat 7 image-based normalized difference index for 2002: (a) normalized difference vegetation index (NDVI); (b) normalized difference water index (NDWI)
2.3.2.2 Normalized difference built-up index (NDBI)
The NDBI is the most common index used to analyse built-up areas. The man-made built-up areas and bare land reflect higher in short-wave infrared (SWIR) than in NIR. Landsat images can be classified using supervised and unsupervised techniques to develop a built-up index to categorize land-use cover forms (Deng et al. Citation2008). The value of the NDBI also varies between −1 and +1. Negative NDBI values represent water bodies, and positive values indicate higher built-up areas. The vegetation NDBI value is small.
2.3.2.3 Normalized difference water index (NDWI)
The NDWI helps estimate water bodies (Gao Citation1996, Dennison et al. Citation2005). This index uses green and NIR bands in remote sensing images to distinguish water bodies (Li et al. Citation2013). The NDWI index is calculated as follows:
However, the index results from EquationEquation (3)(3)
(3) are sometimes deficient in quality. As the pure water reflects neither NIR nor SWIR, the formula for NDWI is modified as follows (Xu Citation2007):
Like the previous indices, the value of NDWI varies between −1 and 1. In general, the NDWI value of water bodies is greater than 0.5. Negative NDWI values indicate dryness in soil, whereas positive values indicate soil moistness. The NDVI and NDWI for 2002 Landsat-7 images and 2017 Landsat-8 images of Omo-Gibe basin are illustrated in , respectively. The satellite images of Omo-Gibe are reclassified using ERDAS IMAGINE and normalized indices for land-use classes (–c)).
Figure 4. Landsat 8 image-based normalized difference index for 2017: (a) normalized difference vegetation index (NDVI); (b) normalized difference water index (NDWI)

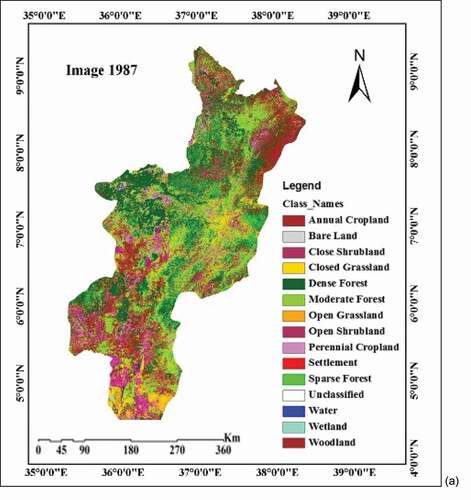
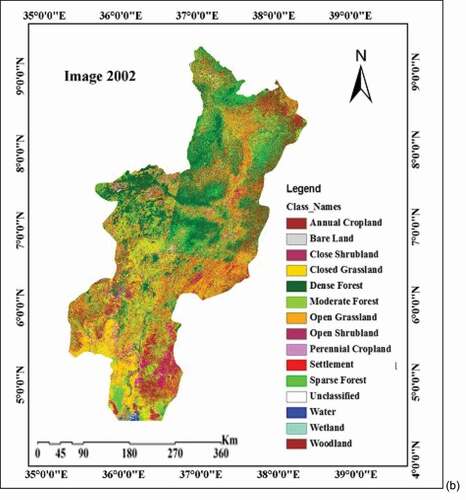
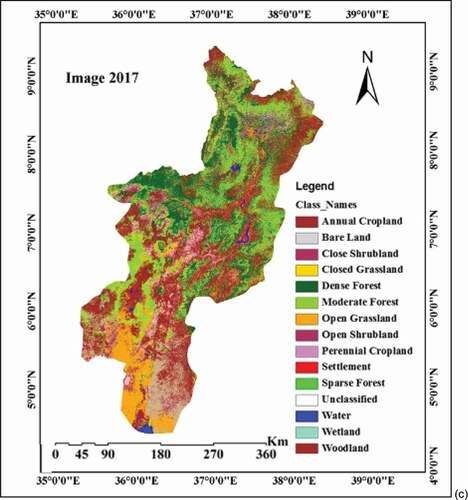
Figure 5. ERDAS IMAGINE reclassified images for the years (a) 1987, (b) 2002, and (c) 2017
2.3.3 Sediment rating curves
As the sediments move along with water in rivers, the study also focuses on sediment yield and sedimentation changes due to different LULC conditions. The sediment yield in a gauged station was estimated from the standard rating curves, which is a power function of the streamflow , where Qs is the daily sediment load in Mg/ha (t/ha), Q is the stream discharge in m3/s, and a and b are rating parameters (Warrick Citation2015). For the given gauging station at Abelti, the daily sediment load (Qs) rating curve was developed using the least-squares method and is
. The expression for Qs was used to estimate sediment yield in the stream for the years 1987–2017.
2.3.4 SWAT model description
SWAT is one of the most widely used hydrological models to assess the streamflow and other quantities in a river basin using the concept of hydrological response units (HRUs) (Arnold et al. Citation1998, Mango et al. Citation2011, Deshmukh et al. Citation2013, Niraula et al. Citation2015, Setyorini et al. Citation2017, Choto and Fetene Citation2019, Dosdogru et al. Citation2020). The SWAT accepts DEM, LULC, and weather inputs; it processes them and provides outputs such as surface runoff, groundwater recharge, percolation, evapotranspiration, and lateral flows. More details about the SWAT model and its application can be found in Arnold et al. (Citation1998).
2.3.4.1 SWAT calibration and validation
The HRUs in the SWAT model development for the Omo-Gibe basin were prepared using input layers on LULC, soil classification, and slope maps. The calibration and validation of the SWAT model are done using the SWAT-CUP module in SWAT, and the sensitivity parameters are listed (). The SWAT model is calibrated and validated with the observed streamflow from Abelti station, located at 8°13ʹ49.50ʺN and 37°34ʹ39.50ʺE. Abelti is an accessible location in Omo-Gibe, where past streamflow data are available for many years, and therefore, observations from this station are used in the study. Like in many places in Africa, the past flow data at distributed locations within the basin is either not recorded or not available. Only from the station Abelti are the flow and sediment data available for a considerable period. Therefore, the SWAT model was calibrated and validated by comparing actual and simulated streamflow at Abelti. The station is downstream of the Gibe I and Gibe II reservoir dams and upstream of the Gibe III dam (). However, there is a huge diversion tunnel from the Gibe II reservoir, which is in Gilgel Gibe River, to the Gibe II power plant situated downstream of Abelti on the banks of Omo River. Therefore, effects of the Gibe II dam construction and diversion on streamflow at Abelti are anticipated. As the diversion is within the Omo-Gibe basin, the water balance for the entire Omo-Gibe is not altered.
Table 2. SWAT-CUP flow parameter sensitivity using the SUFI-2 algorithm for calibration
The SWAT model developed for the basin has 35460 computational cells and 342 HRUs. The HRUs were determined with threshold values of 5% for land use, 10% for soil, and 10% for slope. The number of sub-basins generated using the HRUs was 21 (). The calibration and validation of SWAT were performed for three separate periods. For the first period, from 1983 to 1995, the LULC condition of 1987 was assigned; for the second period, from 1996 to 2005, the LULC imagery of 2002 was assigned; and for the third period, from 2003 to 2018, the LULC imagery of 2017 was assigned. The Abelti station’s observed streamflow data from 1983 to 1992 is used to calibrate the SWAT model for the 1987 LULC imagery, and the data from 1993 to 1995 is used to validate it. Similarly, the SWAT model was calibrated and validated using the corresponding streamflow data for the imagery of 2002 and 2017.
Figure 6. Sub-basin delineation of Omo-Gibe and mean elevation of each sub-basin
The sediment yield module was calibrated as and when the water flow module in SWAT is calibrated. The yield obtained using the standard sediment rating curve () was subsequently compared with the SWAT-simulated sediment yields at the same gauging station. For brevity, the SWAT sediment yield calibration was carried out only from 2006 to 2018 using the LULC of 2017. The SWAT-CUP module performed the sensitivity analysis to identify sensitive parameters for streamflow and sediment transport in the SWAT model (Hosseini and Khaleghi Citation2020). For the Omo-Gibe basin, the sensitive parameters are listed ().
Table 3. Sensitive parameters for sediment yield analysis in SWAT
2.3.4.2 SWAT model performance
The watershed response is rapid in heavily built areas and settlements compared to the forest-covered areas and is more prone to land-use transitions. Correspondingly, the SWAT can provide streamflow estimates at various distributed points in the basin. The Abelti station is situated roughly 100 km upstream of the Gibe III hydropower dam and 50 km upstream of the Gibe II hydro-project tunnel outlet. However, as described earlier, the reservoir of the Gibe II project is upstream of Abelti in the Gilgel-Gibe tributary. The estimates from the Abelti station aid planners and project operators in anticipating the quantities that may enter the structures of the various hydro-projects downstream ().
The efficiency of SWAT model parameters was evaluated using the determination coefficient (R2), Nash-Sutcliffe efficiency (NSE), and percentage of bias (PBIAS). The expressions for these indicators are presented in EquationEquations (5)(5)
(5) to (7).
where Qobs is the measured flow value and Qsim is the simulated streamflow value for the ith observation; is the average measured value;
is the average simulated value; and n is the total number of observations.
PBIAS is an efficiency parameter that estimates the average tendency of the simulated values to be smaller or higher than the observed values (Gupta et al. Citation1999). For example, PBIAS = 0 indicates the best correlation between the simulated and observed streamflow following the general calibration concepts (Janssen and Heuberger Citation1995, Moriasi et al. Citation2007). Positive values of PBIAS indicate the model’s overestimation bias, and negative values suggest underestimation (Gupta et al. Citation1999).
where PBIAS is percentage bias.
The acceptable range of model performance can be evaluated as NSE > 0.50 and R2 < 0.70. The acceptable PBIAS for streamflow is ±25%, and for sediment yield it is ±55% (Moriasi et al. Citation2007).
2.3.5 Scenario development
As Omo-Gibe is a large basin, some portions of it are vulnerable to changes in land use. The critical areas affected in sedimentation and erosions by the anthropogenic and natural land-use changes must be treated with land improvements that can reduce their harmful effects. Various land reform measures are adopted as scenarios to characterize LULC changes and urbanization in the SWAT model simulations. Consequently, the simulations provide information on changes in streamflow and sediment yield due to various land modifications. The hypothetical scenarios also aid in visualizing the impact of different land management practices in the Omo-Gibe basin. The scenario development analysis examines other inputs and their corresponding possible future implications on water availability. For water resource planning and management strategies and assessing the impacts of potential environmental and LULC changes, future scenario development analyses are helpful for decision makers and policymakers (Chekol Citation2006, Choto and Fetene Citation2019). The catchment management scenarios for Omo-Gibe were given as input (), and these scenarios involve the introduction of BMPs (Betrie et al. Citation2011, Choto and Fetene Citation2019) that consist of various combinations of input parameters.
Table 4. SWAT input parameters used to represent BMPs, and description of scenarios
For comparison, the first scenario was taken as the then-existing LULC conditions in the watershed for the years 1987, 2002, and 2017. The SWAT model was run to obtain the stream discharge and sediment yield. In Scenario 2, hypothetical 5 m long filter strips were placed on all agricultural HRUs among the LULC for the above three years (i.e. 1987, 2002, 2017), and the response from the SWAT model was observed. Filter strips, also known as vegetative filter strips or buffer strips, can filter the runoff and trap the sediments within a given plot (Bracmort et al. Citation2006). The model parameter representing the effects of filter strips is the width of the filter strip (FILTERW) in SWAT inputs. This value was modified by editing the HRU (.hru) input file of SWAT () (Herweg and Ludi Citation1999, Choto and Fetene Citation2019). Such scenarios tested the efficacy of land reforms on soil erosion retardation and decreased sediment yields from the critical areas in the Omo-Gibe basin.
In Scenario 3, the agricultural HRUs were mounted on parallel terraces and stone bunds. This method decreases overland flow and soil erosion by reducing the length of the slope (Bracmort et al. Citation2006). Slope length and steepness have a significant impact on the surface runoff volume and velocity. In this scenario, the slope lengths of cropland HRUs are reduced by 75% to assess the reduction in sediment yield. In the SWAT model, the parallel terraces and stone bunds are introduced by editing the “.hru” input file (). The study incorporates Scenario 3 upstream of Gibe III dam to estimate the volume of sediments depositing in the reservoirs. In Scenario 4, reforestation of the land was proposed in sub-basins, where high sedimentation was observed in the actual situation described in Scenario 1. Omo-Gibe basin’s increase in population and the resulting need for more farming increased agricultural activities at the expense of forests. The increase in farming activities and the associated infrastructures escalated land degradation. As the soil erosion is accelerated, depleting soil productivity, destroying land, and filling reservoirs with sediment, suitable interventions must be implemented to protect the Gibe I, Gibe II, and Gibe III catchments, and the downstream diversion dam. Reforestation can reduce overland flow and the erosivity of rainfall (Zorn and Komac Citation2013), and the study tested its suitability in vulnerable zones of Omo-Gibe. In this scenario, we replaced 30% of the area occupied by Afro-alpine and cultivated lands with forest or woodlands ().
From the simulations based on the four scenarios, the volume of surface runoff and the sediment concentrations are available for the entire Omo-Gibe basin; these are not reported elsewhere. The above four scenarios are also justified because Omo-Gibe is a vital basin for Ethiopia. The hydropower generated from the basin is planned to be sold to foreign countries to run the country’s economy.
3 Results and discussion
3.1 Accuracy assessment
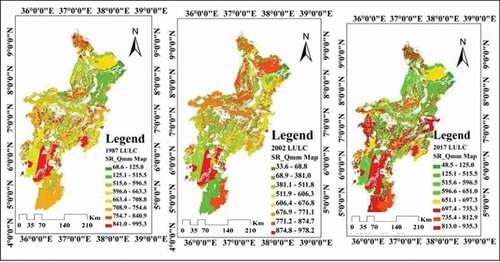
The spatial and temporal distribution of LULC is significant in understanding a wide variety of change phenomena in the Omo-Gibe River basin. The LULC was used to monitor variations in land-use dynamics and estimate future changes in the area. Regions in the remote sensing images of 1987, 2002, and 2017 were reclassified to identify several categories based on the normalized indices (–c)). The LULC classifications included dense forests, moderate forests, sparse forests, woodlands, water, open grasslands, closed shrublands, open shrublands, perennial croplands, annual croplands, settlements, and bare lands. The accuracy assessment of the classified satellite imagery indicates satisfactory results for the Omo-Gibe basin. The overall accuracy of LULC classifications for 2017, 2002, and 1987 imagery was found to be 83.45%, 79.4%, and 76.5%, respectively (inferred from ). The kappa statistic, which is calculated using both the observed (total) accuracy and accuracy due to chance, is satisfactory. The kappa statistics for the above representative years were 78.33%, 82.3%, and 79.6%, respectively, which indicates that effects from chance-based occurrences for the classified LULC categories () are low. These statistics highlight the acceptability between observed ground truth and reclassified imagery in the Omo-Gibe basin ().
Table 5. Accuracy assessment for 2017 imagery
3.2 Indices and LULC changes
Several studies have analysed LULC’s influence on vegetation dynamics and water surfaces (Kinthada et al. Citation2014, Singh et al. Citation2015, Fatemi and Narangifard Citation2019, Dosdogru et al. Citation2020). The computation of indices (NDVI, NDWI, NDBI) is a significant classification method used in detecting LULC changes (Kinthada et al. Citation2014). The normalized indices and LULC are interrelated. The vegetation produces very different index values that easily distinguish it from water bodies over a large area (Hansen and Loveland Citation2012). Negative NDWI shows dryness in soil, whereas positive values for this index indicate soil moistness. The analysis of NDVI and NDWI is important to identify and monitor vegetation drought. It is significant for mapping ecosystem distribution and makes it easy to differentiate LULC types. Henceforth, we developed the NDVI, NDWI, and MNDWI indices for 2002 from the Landsat-7 (ETM+) and for 2017 from the Landsat-8 (OLI) images (). The highest NDVI values are concentrated in the northeast of the basin and the Gojeb sub-basin, and the lowest values are found in the south (). The combination of LULC and NDVI analysis helped classify and measure the effect of human-induced change that may alter the hydrological behaviour of the Omo-Gibe River basin. From the Landsat-7 (ETM) of 2002 (), NDVI values between 0.21 and 1 indicate dense vegetation, whereas values between −0.7 and −0.18 indicate no vegetation cover in the region. Similarly, from the Landsat-8 (OLI) images for 2017 (), NDVI values between 0.34 and 0.58 represent high vegetation, and the decrease in the range indicates a decreasing trend of forest land.
The study results indicate that the forest land dominantly covered most parts of the basin. Dense forests were found to be the dominant LULC in 1987 (nearly 28%; ). The dense forests occupied the upper part of the basin, with thick trees having wide leaves in the 1987 imagery. This forest cover declined significantly, to 19.97% in 2002 and 10.33% in 2017. These decreases were mainly due to the alteration of forest lands into urban areas or agricultural lands, and other water-related development activities (). Moderate forest land, which consists of mildly montane trees, covered nearly 17.5% of the land in 1987, decreasing in 2002 (6%) and 2017 (2%). The percentage of sparse forest increased from 10% in 1987 to 15% in 2002 and 12.5% in 2017. Bare lands, which occupied nearly 12% of the land cover in 1987, were significantly reduced to 3% in 2002 and even less in 2017. The reduction in barren lands suggests the influence of human interventions in the basin. Agricultural lands increased for seasonal and annual croplands (used for vegetables and other mixed varieties) from 1987 to 2017. The percentages of other LULC classes are also illustrated in .
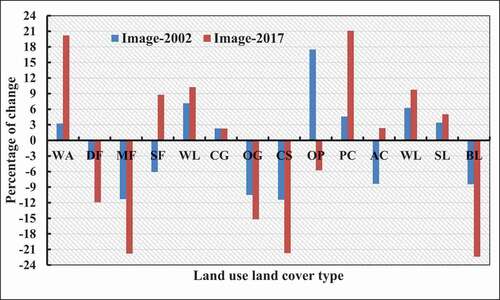
Figure 7. Percentage of land use and coverage for the years 1987, 2002, and 2017. WA: water; DF: dense forest; MF: moderate forest; SF: sparse forest; WL: woodland; OG: open grassland; CG: closed grassland; CS: closed shrubland; OP: open shrubland; PC: perennial cropland; AC: annual cropland; SL: settlement; BL: bare land
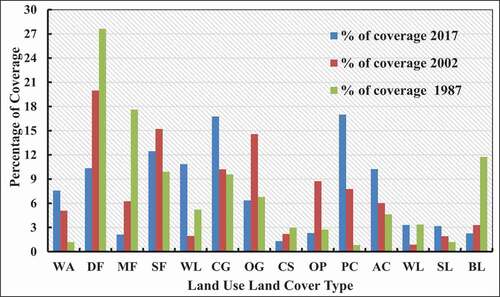
The differences in LULC values from the year 1987 to 2002 indicate percentage changes of 3.23, −3.55, −11.3, −1.07, 0.133, 2.29, −10.5, 21.41, 17.5, 0.605, −8.35, 1.24 and −8.44 for land under water, dense forest, moderate forest, sparse forest, woodland, closed grassland, open grassland, closed shrubland, open shrubland, perennial cropland, annual cropland, wetland, settlement, and bare land, respectively (). The difference in LULC between 2017 and 1987 indicates changes of 20.19%, −11.9%, −21.8%, 0.76%, 3.26%, 2.25%, −0.19%, −21.7%, −1.76%, 21.08%, 2.34%, 5.731%, 5.02% and −22.4% for water, dense forest, moderate forest, sparse forest, woodland, closed grassland, open grassland, closed shrubland, open shrubland, perennial cropland, annual cropland, wetland, settlement, and bare land, respectively ().
Figure 8. Percentage change in LULC for the years 2002 and 2017 relative to the year 1987
The manual river interventions like hydro-projects, tanks, and reservoirs converted some areas under evergreen forests in the upstream parts of the basin to water bodies between 1987 and 2017. A few forest areas downstream were converted to cropland and built-up areas due to a surge in agro-industries. This study showed that built-up regions, water bodies, croplands, and bush lands showed increasing trends, while the evergreen forests, closed shrublands, and bare lands showed decreasing trends, in the LULC change analyses for both 2002 and 2017. Some research has shown that the percentage of agricultural land has changed significantly in African countries over the years (Aneseyee et al. Citation2020b, Mango et al. Citation2011). This increase in agricultural land has been detrimental to natural vegetation in most cases (Nigussie Citation2007, Wolka and Zeleke Citation2016).
The northwestern and southwestern catchment of the sub-basin around Gojeb River, a tributary of Gibe, is mainly covered by forests. In 1987, the dominant land use in the Gojeb sub-basin was forest, and it mainly changed to settlement and cultivated land in the LULC analyses of 2002 and 2017. These findings are in good agreement with the previous study conducted for the Gojeb sub-basin (Choto and Fetene Citation2019). Anthropogenic influences like farmland conversion, urbanization, and other development activities affect the region’s smaller water bodies. The results revealed that the water spread region, characteristic of both human-made and natural water, changed (increased) in both 2002 and 2017 compared to 1987. This increase is due to the development of new hydro-projects in the region. ) shows the increase in exposed water body area near Gibe III reservoir that clearly shows the influence of dam construction across Omo-Gibe. The increase in croplands (or agricultural fields) in the south and southwest of Omo-Gibe is clearly due to anthropogenic influences that affect hydrology. Similarly, the drastic reduction in dense forests for the whole basin is again due to human interferences (–c)). The loss of natural forests may also affect the climate, but this is beyond the scope of this study. The change in hydrology also leads to a change in socioeconomic activities and LULC management and planning. Therefore, the LULC change analysis performed for Omo-Gibe can inform planning agencies regarding the negative impact of unplanned changes on the catchment hydrology and proper management of LULC in the area.
3.3 SWAT modelling to assess the impact of LULC changes on streamflow
3.3.1 Calibration and validation
Since SWAT is the hydrological model used in the analyses to assess the impact of LULC change on the streamflow in the Omo-Gibe basin, the SUFI-2 algorithm in the SWAT-CUP software was used for calibration. The sensitive parameters for the flow module that control surface water responses, subsurface water responses, water balance, channel flow, and soil properties are listed in . Similarly, the sensitive parameters for sediment yield, such as the universal soil loss equation support practice factor (USLE_P), USLE cover factor (USLE_C), exponential factor for sediment routing (SPEXP), and others, are compiled in .
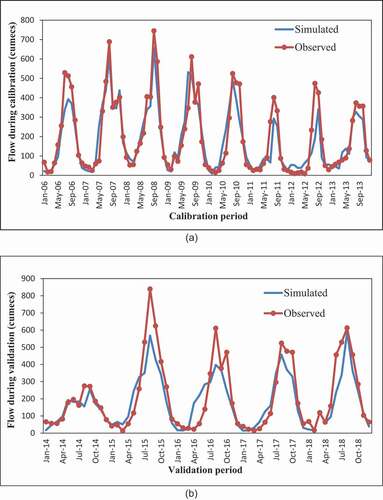
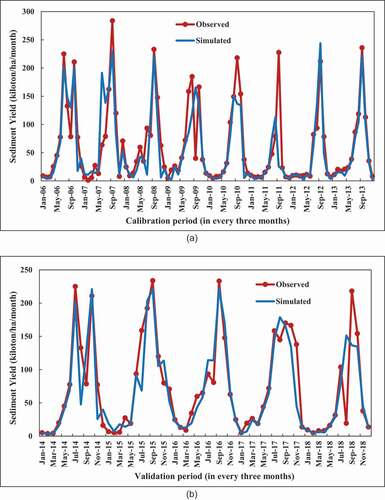
Calibration and validation were performed to ensure high performance of the parameters’ statistical significance (discussed in section 2.2.3). The critical parameter in the basin depends on the independent dataset used to build any predictive basin model to assess the effectiveness of future water management practices. As the SWAT model provides surface runoff and other outputs from a basin for given inputs (), the output scenarios for Omo-Gibe were assessed under different LULC based on 1987, 2002, and 2017 imagery. The comparative plots of actual and SWAT-simulated streamflow at Abelti for calibration and validation indicated satisfactory development of the model for the LULC imagery of 1987 (). Similarly, the SWAT satisfactorily simulated streamflow while using the LULC imagery of 2002 and 2017, respectively (). The NSE values for LULC for 1987, 2002, and 2017 were found to be 0.79, 0.91, and 0.81 for calibration and 0.73, 0.77, and 0.76 for validation, respectively. Similarly, the R2 values were found to be 0.73, 0.82, and 0.86 for calibration, and 0.79, 0.85, and 0.84 for validation, respectively. The PBIAS () for both streamflow and sediment simulation during calibration and validation shows good agreement between the observed and simulated values. The satisfactory values for NSE and R2 indicate the SWAT model’s applicability to the Omo-Gibe basin for different LULC conditions.
Table 6. SWAT streamflow statistical performance during calibration and validation at Abelti station in Omo-Gibe
Table 7. SWAT model statistical performance during sediment yield calibration and validation
Figure 9. Comparison of observed and SWAT-simulated streamflow using 1987 LULC data (a) for calibration (1985 to 1992) and (b) for validation (1993 to 1995); (c) linear regression comparison for calibration (1985 to 1992); and (d) linear regression comparison for validation (1993 to 1995)
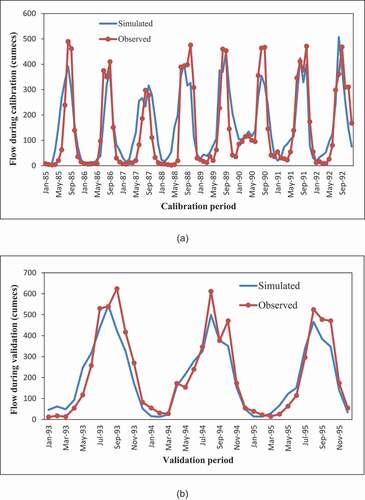
Figure 10. Comparison of observed and SWAT-simulated streamflow using 2002 LULC data (a) for calibration (1996 to 2002) and (b) for validation (2003 to 2005); (c) linear regression comparison for calibration (1996 to 2002); and (d) linear regression comparison for validation (2003 to 2005)
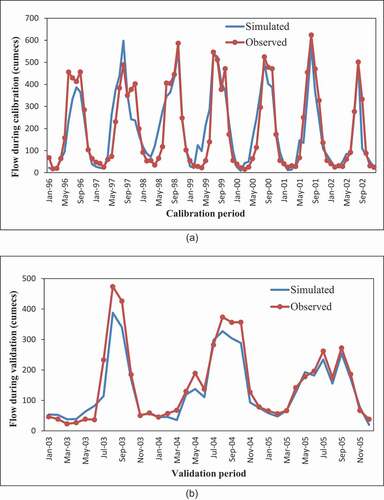
Figure 11. Comparison of observed and SWAT-simulated streamflow using 2017 LULC data (a) for calibration (2006 to 2013) and (b) for validation (2014 to 2018); (c) linear regression comparison for calibration (2006 to 2013); and (d) linear regression comparison for validation (2014 to 2018)

3.3.2 Changes in hydrological processes
The utility of the calibrated SWAT model is to simulate the outputs of various hydrological processes for different inputs for the Omo-Gibe basin (). The hydrological processes rely on the types of LULC that significantly impact the availability of water in the atmosphere, surface, and subsurface. As the basin-wise modelling from SWAT provides streamflow as output, the contribution of surface runoff to streamflow was used as the hydrological predictor to evaluate and address the sub-basin-scale and basin-scale hydrological response to land-use changes. On comparing the mean annual hydrological outputs for the LULC conditions of 1987, 2002, and 2017, in the SWAT, the surface runoff generated is higher using the 2017 LULC. This increase in surface runoff generation is due to the increase in built-up urban areas. The LULC changes from 1987 to 2017 produced an increase in surface runoff from 28% to 39%. Average annual catchment stream flows are directly related to LULC type, soil characteristics, and annual precipitation. Urban land has the highest potential for runoff due to impervious cover and reduced infiltration in those portions of the basin. Since the forest land has been converted to other planting types, the land’s water holding capacity has decreased, causing more surface water runoff and lateral flows. Furthermore, the subsurface groundwater yield in the basin decreased by 9% and 8.8% in 2002 and 2017, respectively, from that of 1987. The changes in evapotranspiration, soil water content, and water yield are also depicted in . The main reasons contributing to these changes are deforestation and agricultural land expansion. Interception and infiltration rates are generally higher in forest areas compared to other types of land cover. Hence, deforestation in the basin caused surface runoff to rise and water movement within the soil layers to fall. The increase in deforestation resulted in a slight increase in the annual flow and a decrease in evaporation.
Figure 12. Comparison of mean annual surface water balance (in mm) for the Omo-Gibe basin for the years 1987, 2002, and 2017 with respect to precipitation (PRECIP) using SWAT model outputs – surface runoff (SURQ), groundwater yield (GWQ), percolation (PERC), water yield (WYLD), evapotranspiration (ET), lateral flow (LATQ), and soil water (SW)
The percentage changes in SWAT monthly outputs demonstrate the seasonal fluctuations in the basin’s hydrological processes from 1987 to 2017 (). Comparing the monthly percentage changes in surface runoff, the runoffs increased in January, February, March, June, July, September, and December for the years 2002 and 2017, relative to 1987. This monthly percentage increase indicates that the surface runoff has increased in the basin due to LULC changes. Similarly, the groundwater component experienced an overall decrease in the years 2002 and 2017 compared to 1987. This indicates a decrease in the groundwater yield in the basin due to the LULC changes. Likewise, monthly percentage changes in potential evapotranspiration, percolation, lateral flow, and soil water flow due to the LULC changes are also inferred (). The results indicate that the mean wet monthly flow for 2002 land cover was increased by 6% over the 1987 land cover. Similarly, the 2002 land cover’s mean monthly flow increased by 7% over the 1987 land cover flow for wet months.
Figure 13. Comparison of percentage changes from 1987 LULC in SWAT-simulated average monthly flows for 2002 and 2017 imagery – for surface runoff and groundwater yield
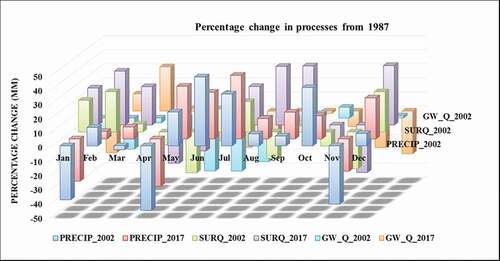
On the other hand, the dry average monthly flow decreased by 2.6% and 4% for the land cover of 2002 and 2017, respectively. The average monthly streamflow for the 1987 and 2002 land cover was 4.3731 m3/s and 12.88 m3/s, while for the LULC of 2017, it was 36.80 m3/s. The monthly average streamflow for 1987, 2002, and 2017 LULC was 11.08, 47.94, and 82.63 m3/s, respectively. Most of the peak flows occur from August to December, the rainy season in the study area. In addition, the spatial variation of surface runoffs from the SWAT model for LULC data of 2002 and 2017 was compared. The comparison revealed a decrease in surface runoff in 2017 compared to 2002 in the upper portions of the basin (). This decrease is due to the large reduction in forest cover in the upper portion of the Omo-Gibe basin.
Figure 14. Mapping high surface runoff at the basin level and spatial distribution of SWAT-simulated annual mean surface runoff (mm) using 2017, 2002, and 1987 LULCs
This study evaluated the applicability of the SWAT simulation and the impacts of LULC changes on surface water potential that could influence water availability over time. The study also assessed the sensitive parameters that change the surface and subsurface hydrological processes. The changes in streamflow and other hydrological processes under different LULC conditions in the Omo-Gibe basin indicated that sub-basins with decreased forest land cover responded with increased surface runoff generation. Therefore, deforestation affects runoff generation and slope stability, resulting in soil erosion and flooding. The LULC changes also impact the generation of surface runoff (the main indicator) in the sub-basin of Gibe III reservoir (), with the mean SUR_Q for 1987 LULC being 722.65 mm, for 2002 LULC being 665.15 mm, and for 2017 LULC being 610.39 mm. The study also highlights the importance of carrying out impact assessment of LULC changes to control natural resources for human and ecological safety and to assess water resource potential. Such potential evaluations are vital to develop and manage water resources at the basin level. Also, LULC impact assessments serve to frame appropriate mid-term and long-term surface water and groundwater management policies.
3.3.3 Changes in sediment yield
The SWAT can predict sediment load in streams due to varied LULC conditions in the river basin. SWAT measures the soil erosion and sediment yield within each sub-basin HRU (Choto and Fetene Citation2019). The SWAT model was calibrated and validated to predict sediment yield from the basin. For calibration, we identified the power equation (Section 2.2.3) as the best approximation for input observation values for sediment load at the Abelti station. The observed and simulated values for sediment yield are in good agreement with the observed estimation ( and ). The calibration and validation of the SWAT model for sediment yield enhanced its ability to assess hydrological processes for different soil and land management scenarios. The slope, land cover, and soil maps were overlaid on the spatial distributions of surface runoff and sediment yields to identify the significant LULC types contributing to soil erosion. The sediment yield in the basin varies from one HRU to another based on their spatial location, type of soil, slope, and land use. The analyses revealed sub-catchments that produce high surface runoff and sediment yields. In this analysis, Omo-Gibe sub-basins 1, 2, 4, 8, 10, 11, 13, 14, 17, and 20 generated high sediment yields and large exposure to erosion (). However, moderate soil erosion prevailed in sub-basins 3, 5, 6, and 21, and low erosion occurred in sub-basins 9, 12, 15, 16, 18, and 19. Therefore, sub-basins 1, 2, 4, 8, 10, 11, 13, 14, 17, and 20 were chosen to implement hypothetical BMP scenarios.
Figure 15. Validity of SWAT in sediment yield analysis by comparing observed and simulated monthly sediment yield (in tons/ha/month) at Abelti gauging station using 2017 LULC imagery (a) for calibration (2006 to 2013) and (b) for validation (2014 to 2018); (c) regression comparison for calibration; and (d) regression comparison for validation
3.4 Best management practices
The anthropogenic influences changed the LULC drastically in the basin, causing variations in surface runoff and sediment yields. The surface runoff generation maps () identified the erosion-prone sub-basins in Omo-Gibe. Therefore, adopting reasonable management practices provides remedial measures to reduce the effects of LULC changes on the hydrological processes. The BMP simulations are essential to identify areas of high sedimentation in the basin and to take proper soil and water conservation measures. The effect of the application of BMPs is very significant for downstream sediment yields and flood control. Therefore, this study provides information on the sensitive and vulnerable areas affected by natural and anthropogenic activities in the basin. The BMPs help in designing a proper plan to manage water resources in the basin. This section describes four management practices hypothetically incorporated in the Omo-Gibe basin as a possible remedy to excessive runoff and sediment yield. We simulated different LULC scenarios in the 10 sub-basins described earlier in the SWAT for the Omo-Gibe basin. It is also helpful for catchment management planning to determine the spatial variation of surface runoff. Most of the extreme erosion occurred in the cultivated lands, whereas low erosion mostly occurred in the grasslands.
3.4.1 Scenario 1: Baseline condition
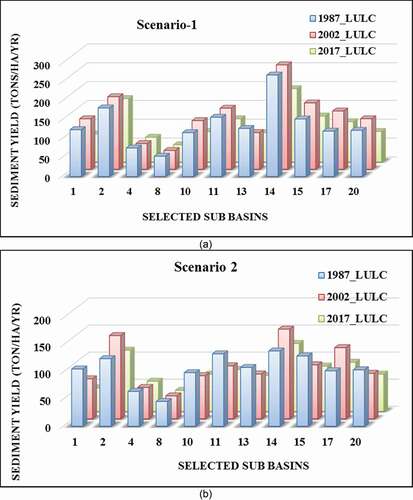
The baseline scenarios are the LULC conditions for the respective years 1987, 2002, and 2017 without any artificial or hypothetical influence on the land cover. The calibrated and validated SWAT model provides outputs on baseline scenarios referred to in subsequent scenario management studies. For example, the spatial distribution of SWAT-simulated annual runoff () is a baseline scenario, and it corresponds to the current land management practices without any conservation measures (). The baseline scenarios indicate that for the sub-basins 1, 4, 8, 10, 11, 13, 15, and 20, the 1987 LULC conditions generate or transport more sediment (or erosion). The larger sediment yield for older periods indicates the natural conditions of the basin. Due to greater human intervention (such as hydro-projects and built-up urban areas) in 2002 and 2017, the sediment yield has probably shifted to other sub-basins.
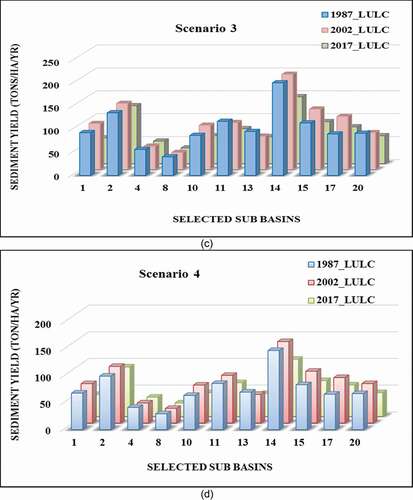
Figure 16. The sediment yield in selected sub-basins (a) in the baseline condition; (b) with filter strips; (c) in parallel terraces with different slope lengths, and stone bunds; and (d) under the reforestation scenario (SYLD ton/ha/year)
3.4.2 Scenario 2: Introducing different widths of filter strips
Filter strips filter the surface runoff and trap sediment within a given land area (Bracmort et al. Citation2006). The FILTERW parameter in SWAT accounted for modifications of filter strips in the simulations (Herweg and Ludi Citation1999, Choto and Fetene Citation2019). The introduction of filter strip scenarios was tested as a possible solution for soil erosion retardation measures and decreased sediment yields from the Omo-Gibe basin’s critical areas. The filter strip scenario implementation decreased the sediment yield from the baseline scenarios by 24.15%, 14.97%, and 15.13% for the 1987, 2002, and 2017 LULC distributions, respectively ().
3.4.3 Scenario 3: Parallel terraces with different slope lengths, and stone bunds
Scenario 3 describes the mounting of parallel terraces and stone bunds in agricultural fields in the sub-basins. The agricultural HRUs were modified to account for the support of the above scenario. Long slopes generated more runoff to their bases, and steep slopes increased the runoff speed. The study analysed the impact of a slope length reduction of 75% on sediment yield reduction. The hypothetical parallel terrace and stone bunds in the basin’s agricultural fields were incorporated in the simulation model by editing the corresponding HRU input table. Simultaneously, the USLE_P and CN2 values were modified by editing the management input table (.mgt). The reduction in sediment yield by 33.10%, 16.84%, and 22.90% for LULC conditions of 1987, 2002, and 2017, respectively, from the baseline scenario, near the Gibe III catchment proved the effectiveness of Scenario 3 ().
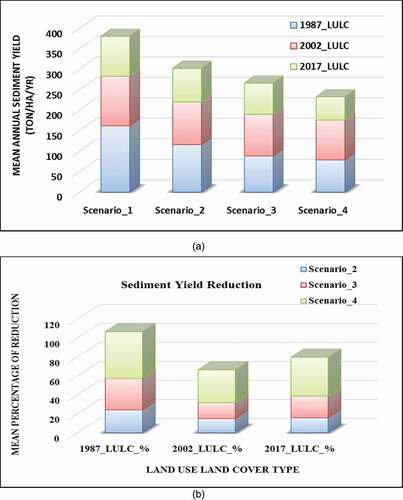
Figure 17. (a) Mean annual sediment yield comparison of different scenarios under 1987, 2002, and 2017 LULC conditions (in ton/ha/year); and (b) percentage reduction in sediment yield
3.4.4 Scenario 4: Reforestations
Omo-Gibe basin’s increase in population and the resulting need for more farming increased the area of agricultural and cultivable lands. However, this land modification has caused degradation such as depletion of forests and other natural green covers. The conversion of forests into agricultural fields has accelerated soil erosion (). To protect the water resource projects of Gibe I, Gibe II, Gibe III and Gibe IV (under construction), and the downstream diversion dam, suitable land modifications need to be envisaged. As reforestation reduces overland flow and the erosivity of rainfall, the effect was simulated by introducing the corresponding land-use change. In the simulations, cultivated forests or woodlands artificially replaced nearly 30% of the area occupied by Afro-alpine crops. The implementation of the reforestation scenario reduced the sediment yield by 49.25%, 34.55%, and 40.84% for LULC conditions of 1987, 2002, and 2017, respectively, proving its effectiveness in reducing sediment yield (). However, the planning and development of forests and shrublands at various catchment levels should be coordinated with the respective agricultural services.
3.4.5 Comparison of the BMP scenarios
The observed average sediment yield is approximately 15.67 t ha−1 year−1 at the Gibe III catchment dam site. The SWAT-predicted sediment yield is 13.3 t ha−1 year−1 for LULC 1987, 16.29 t ha−1 year−1 for LULC 2002, and 15.94 t ha−1 year−1 for LULC 2017 for the selected critical sub-basins, which are reasonable values. The effect of BMPs on the selected critical sub-basin level showed a broader spatial variation from baseline conditions on sediment reduction. On comparing the annual sediment yield generated from the basin using the LULC of 1987, Scenario 1 generated 160 t ha−1 year−1, Scenario 2 generated 120 t ha−1 year−1, Scenario 3 generated 90 t ha−1 year−1, and Scenario 4 generated 80 t ha−1 year−1. Similarly, for the LULC data of 2017, Scenario 1 generated 95 t ha−1 year−1, Scenario 2 generated 80 t ha−1 year−1, Scenario 3 generated 75 t ha−1 year−1, and Scenario 4 generated 60 t ha−1 year−1 (). The results indicate the effectiveness of BMPs in the basin lands to reduce the sediment yield. Among all the BMPs, Scenario 4 provided the maximum reduction in sediment yield for the LULC imagery of 1987, 2002, and 2017 (). This maximum reduction from Scenario 4 can be used to provide recommendations to the relevant agencies as the BMP for the Omo-Gibe basin.
3.5 Inferences
Both natural and anthropogenic activities can affect basin hydrology adversely. They can change the biodiversity as well as the quality and quantity of surface water and groundwater. The Omo-Gibe River basin is unique in its characteristics, and therefore, we believe that the work described here is vital for water resource engineers and planners of the basin. This approach to BMPs can help determine how different scenarios will impact and change the Omo-Gibe basin’s landscapes and productivity. The effects of BMPs are important for designing and distinguishing effective policies to mitigate climate change effects on agriculture and water resources. We recommend Scenario 4 as the BMP to control surface runoff, sedimentation, and flooding in the basin. Also, BMP simulations using the SWAT model approach are rarely explored in the African context, particularly in Ethiopia, where food and water security are prime concerns.
In addition, an integrated LULC management of the Omo-Gibe basin is crucial to take measures for the sustainable use of water resources of the basin and for the ecology of Lake Turkana. The normalized indices – NDVI and NDWI – helped separate safe vegetation cover from unhealthy vegetation cover and to classify water bodies and saturated soil layers. Negative NDWI values indicate dryness in soil, whereas positive values indicate soil moistness. Such NDVI and NDWI analyses are also important to identify and monitor vegetation droughts, which are prominent on the African continent. The index analyses allow for qualitative and quantitative comparison and are very important for mapping ecosystem distribution. Although the use of normalized indices is a well-tested form of LULC change analysis, it has not previously been applied to the entire Omo-Gibe since the inception of the Gibe III dam. As surface runoff is the primary component of streamflow in the basin, integrating it to estimate the sediment yields in various sub-basins is also a new finding from this research concerning the Omo-Gibe basin. Compared to other developed and developing countries, Ethiopia has shown an increase in agricultural lands at the cost of natural forests. The findings that there has been a significant reduction in dense forest cover, an increase in agricultural areas, an increase in urban areas, and an increase in sediment yields in certain locations within the basin are important outcomes of this research that can aid planners and authorities. Finally, we recommend the integration of SWAT with machine learning algorithms for future BMP simulations.
4 Conclusions
The Omo-Gibe River flows through a semi-arid region in southern Ethiopia. The basin includes varied LULC types, which have changed due to anthropogenic interventions over the years. The changes in LULC in the basin have caused stress in water-use in the region, and remedial measures are essential to minimize the strain. Gibe III, one of the important megadams in the country, recently started operation, and the vulnerability of this megadam is of important concern for the economy of the country.
Spatiotemporal LULC data for the Omo-Gibe basin from 1987, 2002, and 2017 were analysed to track land and water changes and use them to predict possible environmental concerns. In 1987, most of the basin area consisted of forest cover. However, by 2017, these forests had decreased significantly. Furthermore, there had been an increase in agricultural lands and built-up urban areas in the basin. The purpose of the study was to determine the effect of these LULC changes on the hydrological processes in the Omo-Gibe catchment using the SWAT model. The SWAT was calibrated and validated with the observed streamflow using the LULCs of 1987, 2002, and 2017. The model performance was satisfactory based on statistical parameters such as NSE, R2, and PBIAS, suggesting the SWAT’s excellent applicability for hydrological modelling in the basin. The SWAT further revealed the excess surface runoff in some critical portions of the river basin. Furthermore, the excess surface flow exacerbated soil erosion, raising concerns about the hydrological projects established in the basin.
Hypothetical BMP scenarios were introduced in the basin to mitigate the hurdles caused by soil erosion. The BMPs included were the establishment of filter traps, incorporation of parallel terraces and stone bunds in agricultural fields with a reduction in slopes, and reforestation. The SWAT model simulations based on the BMPs suggested in the basin areas produced a reduction in sediment yield from the basin. Reforestation is potentially found to be the BMP to reduce the sediment yield and safeguard the various hydro-projects in the basin. As a future scope for study, LULC changes along with climate changes and population explosion could be combined with hydrological models to predict the potential impacts on hydrological processes and the availability of surface and subsurface water in the Omo-Gibe basin. This could help stakeholders and decision makers make better adaptations for land use and climate change to develop water resource strategies. More advanced techniques, like the use of artificial intelligence in framing BMPs, are also recommended as a future area of study.
Acknowledgements
The authors gratefully acknowledge the Ethiopian Government’s Ministry of Higher Education; Ministry of Water, Irrigation, and Electricity; National Meteorological Agency; and the Ministry of Agriculture for providing the data required to do this study. We also acknowledge the USGS Earth Resources Observation portal for providing the necessary data. The first author acknowledges the Arba Minch University Institute of Water Technology, Ethiopia, and the Government of Ethiopia for providing leave, financial support, and necessary assistance in the study. The authors acknowledge the Department of Civil Engineering, IIT Guwahati, for providing the facilities required to carry out this research. We also gratefully acknowledge the anonymous reviewers, whose comments significantly improved the paper.
Disclosure statement
No potential conflict of interest was reported by the authors.
References
- Ali, T.Y.M., 2017. Runoff prediction for Great Dar Fur using statistical methods and GIS. Thesis (PhD). Sudan University of Science and Technology.
- Aneseyee, A.B., et al., 2020b. Land use/Land cover change effect on soil erosion and sediment delivery in the Winike watershed, Omo Gibe Basin, Ethiopia. Science of The Total Environment, 728, 138776. doi:https://doi.org/10.1016/j.scitotenv.2020.138776
- Aneseyee, A.B., Soromessa, T., and Elias, E., 2020a. The effect of Land use/Land cover changes on ecosystem services valuation of Winike watershed, Omo Gibe basin, Ethiopia. Human and Ecological Risk Assessment: An International Journal, 26 (10), 2608–2627. doi:https://doi.org/10.1080/10807039.2019.1675139
- Arnold, J.G., et al., 1998. Large area hydrologic modeling and assessment Part I: model development. Journal of the American Water Resources Association, 34 (1), 73–89. doi:https://doi.org/10.1111/j.1752-1688.1998.tb05961.x
- Avery, S., 2012. Lake Turkana and The Lower Omo: hydrological Impacts Of Major Dam & Irrigation Developments. England: African Studies Centre, University of Oxford. Vol. I. https://www.africanstudies.ox.ac.uk/sites/default/files/africanstudies/documents/media/volume_i_report.pdf
- Ayalew, L., 2009. Analyzing the effects of historical and recent floods on channel pattern and the environment in the Lower Omo basin of Ethiopia using satellite images and GIS. Environmental Geology, 58 (8), 1713–1726. doi:https://doi.org/10.1007/s00254-008-1671-8
- Betrie, G.D., et al., 2011. Sediment management modelling in the Blue Nile Basin using SWAT model. Hydrology and Earth System Sciences, 15 (3), 807–818. doi:https://doi.org/10.5194/hess-15-807-2011
- Beyene, T., Lettenmaier, D.P., and Kabat, P., 2010. Hydrologic impacts of climate change on the Nile River Basin: implications of the 2007 IPCC scenarios. Climatic Change, 100 (3–4), 433–461. doi:https://doi.org/10.1007/s10584-009-9693-0
- Bracmort, K.S., et al., 2006. Modeling long-term water quality impact of structural BMPs. Transactions of the ASABE, 49 (2), 367–374. doi:https://doi.org/10.13031/2013.20411
- Chekol, D.A., 2006. Modeling of hydrology and soil erosion of Upper Awash River Basin. Göttingen: Cuvillier Verlag.
- Choto, M. and Fetene, A., 2019. Impacts of Land use/Land cover change on stream flow and sediment yield of Gojeb watershed, Omo-Gibe basin, Ethiopia. Remote Sensing Applications: Society and Environment, 14 (January), 84–99. doi:https://doi.org/10.1016/j.rsase.2019.01.003
- Congalton, R.G., 1991. A review of assessing the accuracy of classifications of remotely sensed data. Remote Sensing of Environment, 37 (1), 35–46. doi:https://doi.org/10.1016/0034-4257(91)90048-B
- De Sherbinin, A., 2002. A CIESIN thematic guide to land-use and land-cover change (LUCC). New York: Center for International Earth Science Information Network, Columbia University, 1–67.
- Deng, J.S., et al., 2008. PCA‐based land‐use change detection and analysis using multitemporal and multisensor satellite data. International Journal of Remote Sensing, 29 (16), 4823–4838. doi:https://doi.org/10.1080/01431160801950162
- Dennison, P.E., et al., 2005. Use of Normalized Difference Water Index for monitoring live fuel moisture. International Journal of Remote Sensing, 26 (5), 1035–1042. doi:https://doi.org/10.1080/0143116042000273998
- Deshmukh, D.S., et al., 2013. Estimation and comparision of curve numbers based on dynamic Land use Land cover change, observed rainfall-runoff data and land slope. Journal of Hydrology, 492, 89–101. doi:https://doi.org/10.1016/j.jhydrol.2013.04.001
- Dosdogru, F., et al., 2020. Potential impacts of Land use/cover and climate changes on ecologically relevant flows. Journal of Hydrology, 584, 124654. doi:https://doi.org/10.1016/j.jhydrol.2020.124654
- FAO, 1995. Digital Soil Map of the World and Derived Soil Properties (version 3.5). [CDROM]. Rome: Food and Agriculture Organization of the United Nations.
- FAO, 1998. The Soil and Terrain Database for northeastern Africa. Rome: [CDROM]. Food and Agriculture Organization of the United Nations.
- FAO, 2002. Major Soils of the World. Land & Water Digital Media Series. [CDROM]. FAO Soil Buletin. No (19). Rome: Food and Agriculture Organization of the United Nations.
- Fatemi, M. and Narangifard, M., 2019. Monitoring LULC changes and its impact on the LST and NDVI in District 1 of Shiraz City. Arabian Journal of Geosciences, 12 (4), 127. doi:https://doi.org/10.1007/s12517-019-4259-6
- FDRE-PCC, 2008. Summary and Statistical Report of the 2007 Population and Housing Census. Federal Democratic Republic of Ethiopia, Population Census Commission. Ethiopia: Addis Ababa.
- Gao, B., 1996. NDWI—A normalized difference water index for remote sensing of vegetation liquid water from space. Remote Sensing of Environment, 58 (3), 257–266. doi:https://doi.org/10.1016/S0034-4257(96)00067-3
- Gupta, H.V., Sorooshian, S., and Yapo, P.O., 1999. Status of Automatic Calibration for Hydrologic Models: comparison with Multilevel Expert Calibration. Journal of Hydrologic Engineering, 4 (2), 135–143. doi:https://doi.org/10.1061/(ASCE)1084-0699(1999)4:2(135)
- Hansen, M.C. and Loveland, T.R., 2012. A review of large area monitoring of land cover change using Landsat data. Remote Sensing of Environment, 122, 66–74. doi:https://doi.org/10.1016/j.rse.2011.08.024
- Herweg, K. and Ludi, E., 1999. The performance of selected soil and water conservation measures—case studies from Ethiopia and Eritrea. Catena, 36 (1–2), 99–114. doi:https://doi.org/10.1016/S0341-8162(99)00004-1
- Hosseini, S.H. and Khaleghi, M.R., 2020. Application of SWAT model and SWAT-CUP software in simulation and analysis of sediment uncertainty in arid and semi-arid watersheds (case study: the Zoshk–Abardeh watershed). Modeling Earth Systems and Environment, 6 (4), 2003–2013. doi:https://doi.org/10.1007/s40808-020-00846-2
- Janssen, P.H.M. and Heuberger, P.S.C., 1995. Calibration of process-oriented models. Ecological Modelling, 83 (1–2), 55–66. doi:https://doi.org/10.1016/0304-3800(95)00084-9
- Jiang, Z., et al., 2006. Analysis of NDVI and scaled difference vegetation index retrievals of vegetation fraction. Remote Sensing of Environment, 101 (3), 366–378. doi:https://doi.org/10.1016/j.rse.2006.01.003
- Kinthada, N.R., et al., 2014. Land Use/Land Cover and NDVI Analysis for Monitoring the Health of Micro-watersheds of Sarada River Basin, Visakhapatnam District, India. Journal of Geology & Geosciences, 3 (2), 1000146. doi:https://doi.org/10.4172/2329-6755.1000146
- Lambin, E.F., Geist, H.J., and Lepers, E., 2003. Dynamics of landuse and landcover change in tropical regions. Annual Review of Environment and Resources, 28 (1), 205–241. doi:https://doi.org/10.1146/annurev.energy.28.050302.105459
- Lee, D.R., 2005. Agricultural sustainability and technology adoption: issues and policies for developing countries. American Journal of Agricultural Economics, 87 (5), 1325–1334. doi:https://doi.org/10.1111/j.1467-8276.2005.00826.x
- Legesse, D., Vallet-Coulomb, C., and Gasse, F., 2003. Hydrological response of a catchment to climate and land use changes in Tropical Africa: case study South Central Ethiopia. Journal of Hydrology, 275 (1–2), 67–85. doi:https://doi.org/10.1016/S0022-1694(03)00019-2
- Li, W., et al., 2013. A comparison of land surface water mapping using the Normalized Difference Water Index from TM, ETM+ and ALI. Remote Sensing, 5 (11), 5530–5549. doi:https://doi.org/10.3390/rs5115530
- Mango, L.M., et al., 2011. Land use and climate change impacts on the hydrology of the upper Mara River Basin, Kenya: results of a modeling study to support better resource management. Hydrology and Earth System Sciences, 15 (7), 2245–2258. doi:https://doi.org/10.5194/hess-15-2245-2011
- Moriasi, D.N., et al., 2007. Model Evaluation Guidelines for Systematic Quantification of Accuracy in Watershed Simulations. Transactions of the ASABE, 50 (3), 885–900. doi:https://doi.org/10.13031/2013.23153
- Nigussie, A., 2007. Impact of Land Use Land Cover change on stream flow (Case study Gilgel Gibe III). Thesis (PhD). Addis Abeba University.
- Niraula, R., Meixner, T., and Norman, L.M., 2015. Determining the importance of model calibration for forecasting absolute/relative changes in streamflow from LULC and climate changes. Journal of Hydrology, 522, 439–451. doi:https://doi.org/10.1016/j.jhydrol.2015.01.007
- Reid, R.S., et al., 2000. Land-use and land-cover dynamics in response to changes in climatic, biological and socio-political forces: the case of southwestern Ethiopia. Landscape Ecology, 15 (4), 339–355. doi:https://doi.org/10.1023/A:1008177712995
- SCRP, 2000. Area of Anjeni, Gojam, Ethiopia: long-term Monitoring of the Agricultural Environment, 1984–1994. Switzerland: Soil Conservation Research Programme, Centre for Development and Environment. University of Berne.
- Setyorini, A., Khare, D., and Pingale, S.M., 2017. Simulating the impact of land use/land cover change and climate variability on watershed hydrology in the Upper Brantas basin, Indonesia. Applied Geomatics, 9 (3), 191–204. doi:https://doi.org/10.1007/s12518-017-0193-z
- Singh, K.V., et al., 2015. Evaluation of NDWI and MNDWI for assessment of waterlogging by integrating digital elevation model and groundwater level. Geocarto International, 30 (6), 650–661. doi:https://doi.org/10.1080/10106049.2014.965757
- Smith, P., et al., 2016. Global change pressures on soils from land use and management. Global Change Biology, 22 (3), 1008–1028. doi:https://doi.org/10.1111/gcb.13068
- Tan, M.L., et al., 2015. Impacts of land-use and climate variability on hydrological components in the Johor River basin, Malaysia. Hydrological Sciences Journal, 60 (5), 1–17. doi:https://doi.org/10.1080/02626667.2014.967246
- Van Wambeke, A., 2003. Properties and management of soils of the tropics. FAO Land and Water Digital Media Series No. 24. Rome: FAO.
- Verma, P., et al., 2020. Appraisal of kappa-based metrics and disagreement indices of accuracy assessment for parametric and nonparametric techniques used in LULC classification and change detection. Modeling Earth Systems and Environment, 6 (2), 1045–1059. doi:https://doi.org/10.1007/s40808-020-00740-x
- Wang, R., et al., 2014. Individual and combined effects of land use/cover and climate change on Wolf Bay watershed streamflow in southern Alabama. Hydrological Processes, 28 (22), 5530–5546. doi:https://doi.org/10.1002/hyp.10057
- Warrick, J.A., 2015. Trend analyses with river sediment rating curves. Hydrological Processes, 29 (6), 936–949. doi:https://doi.org/10.1002/hyp.10198
- Wolka, K. and Zeleke, G., 2016. Understanding farmers’ perception on climate change and adaptation strategies in Karetha watershed, Omo-gibe basin, Ethiopia. Asian Journal of Earth Sciences, 10 (1), 22–32. doi:https://doi.org/10.3923/ajes.2017.22.32
- Xu, H., 2007. Extraction of Urban Built-up Land Features from Landsat Imagery Using a Thematicoriented Index Combination Technique. Photogrammetric engineering and remote sensing, 73 (12), 1381–1391. doi:https://doi.org/10.14358/PERS.73.12.1381
- Zorn, M. and Komac, B., 2013. Erosivity. In: P.T. Bobrowsky, ed. Encyclopedia of Natural Hazards. Dordrecht: Springer Netherlands. 289–290.