
 ?Mathematical formulae have been encoded as MathML and are displayed in this HTML version using MathJax in order to improve their display. Uncheck the box to turn MathJax off. This feature requires Javascript. Click on a formula to zoom.
ABSTRACT
As climate changes, perennial headwater streams could become intermittent and intermittent rivers could dry more often due to more severe droughts. A modelling framework supported by field observations was applied to assess the probability of drying in headwaters at the regional scale (PD) under climate change. Empirical relationships between severity of low flows and observed proportions of no-flow states have been calibrated for 22 hydro-ecoregions under present conditions. These relationships were applied using daily discharge data on a large set of gauging stations simulated by the Modèle du Génie Rural à 6 paramètres Journalier (GR6J) hydrological model under Representative Concentration Pathway (RCP) RCP2.6 and RCP8.5 emission scenarios. The results suggest a more contrasting spatial pattern in the future than under current conditions. Noteworthy changes include increases in drying extent and duration, particularly in regions with historically high probabilities of drying and changes in seasonality in Alpine regions. Aquatic ecosystems will experience unprecedented hydrological conditions, which might lead to losses of ecosystem functions.
Editor A. Castellarin Associate Editor M. Ionita
Introduction
Climate change is expected to cause a global increase in air temperature. One of the major consequences of this increase is the potential for an increase in aridity, exacerbating desertification and land degradation (e.g. Asadi Zarch et al. Citation2017, Cherlet et al. Citation2018, Park et al. Citation2018). Facing an expansion of drier conditions, water availability is projected to decrease and flow intermittence in summer to increase (Delso et al. Citation2017), in particular where climate is projected to be drier, as aridity is the main driver of river flow intermittence (Sauquet et al. Citation2021). Conversely, due to global warming, flow intermittence in winter could decrease where no-flow conditions are due to freezing. No-flow events are de facto periods of water scarcity, and their characteristics in both time and space under climate change are key elements in addressing integrated water management issues. Occurrences of drying not only exacerbate competition between human uses but also alter freshwater ecosystems. In fact, flow intermittence often leads to loss of biological diversity (Soria et al. Citation2017) and changes in ecological processing such as organic matter decomposition (Datry et al. Citation2018b). Recent studies have also highlighted how the spatial extent of flow intermittence can affect biological communities through changes in organism dispersal (Crabot et al. Citation2020, Sarremejane et al. Citation2020). Climate change-induced alterations of the seasonality, duration and spatial extent of flow intermittence could have profound impacts on river ecosystems and the services they provide (Datry et al. Citation2018a).
Only a few comprehensive regional assessments have been carried out of projected changes in river flow intermittence under climate change, for several reasons. Firstly, the number of gauged streams in headwaters, where intermittence is most common under temperate climate, is limited. Gauging stations are more often installed on perennial rivers. Intermittence is underrepresented in the conventional hydrological monitoring network (e.g. 10% of the gauged basins both in the conterminous United States (Zimmer et al. Citation2020) and in France (van Meerveld et al. Citation2020)). Flow observations in intermittent river systems – the primary traditional source of data for hydrologists – are lacking to support knowledge acquisition and model development. Secondly, runoff generation in low-yielding basins is a complex nonlinear process that is challenging to simulate. Besides climate influences, intermittence characteristics are strongly influenced by processes operating at small scales, such as local groundwater–surface water interactions and transmission losses (e.g. Costigan et al. Citation2017, Beaufort et al. Citation2019). Hydrological models, even physically based approaches, are not usually designed to simulate zero flows (they usually concentrate on catchment responses to rainfall events; e.g. Bennett et al. Citation2020). Since global hydrological models are usually not able to represent local processes, using them is certainly hazardous to project changes in flow intermittence characteristics (e.g. Döll and Schmied Citation2012).
Conversely, hydrodynamic models (e.g. Theodoropoulos et al. Citation2019) can provide detailed descriptions of hydraulic conditions in the channel bed (water depth, depth-averaged flow velocity) and simulate the formation of isolated pools and dry riverbeds that may affect freshwater ecosystems. However, they require a large amount of data at high resolution as input datasets, limiting their use to small portions of the river network. Finally, the impact of human actions on intermittent streams along with the impact of climate change is not clearly known and was identified as one of the 23 unsolved problems related to time variability and change issues in hydrology (UPH 3, Blöschl et al. Citation2019).
In the majority of recent studies assessing changes in flow intermittence, climate change together with human activities has been shown to induce a progressive decline in flow permanence. Most such studies are related to catchments in the Mediterranean context, located in Europe (Cipriani et al. (Citation2014) in southeastern France; Tzoraki et al. (Citation2015) and Querner et al. (Citation2016) in Greece; De Girolamo et al. (Citation2017) and Pumo et al. (Citation2016) in Italy) and in the western US (Jaeger et al. Citation2014, Reynolds et al. Citation2015). These studies used different modelling approaches, including rainfall–runoff models (e.g. Soil & Water Assessment Tool [SWAT] in Jaeger et al. Citation2014, Tzoraki et al. Citation2015, De Girolamo et al. Citation2017; Modèle du Génie Rural à 4 paramètres Journalier [GR4J] and J2000 in Cipriani et al. Citation2014) and statistical approaches (e.g. mixed-effects multiple regression in Reynolds et al. Citation2015). They predict a global shift from perennial to intermittent river flow regime and an exacerbation of drying due to human actions and to climate change in future decades, with a probably high impact on freshwater ecosystem integrity (e.g. Cipriani et al. Citation2014, Jaeger et al. Citation2014). Flow permanence will likely decrease as droughts will become more severe, and the intensity of changes is amplified when scenario RCP8.5 is considered (e.g. Tzoraki et al. Citation2015, Querner et al. Citation2016).
The literature review demonstrates that future predictions of flow intermittence are relatively rare and often limited to a single catchment, and points out the lack of flow intermittence assessment at a large scale, especially outside the Mediterranean context. The present study extends the work done by Beaufort et al. (Citation2018) to predict the expansion of no-flow conditions under climate change in France. We have adapted the modelling framework previously used to assess the probability of drying in headwater streams at the regional scale (PD) under current conditions. Here, developments and results are supported by field observations with national coverage in combination with projected changes of daily discharge at gauged locations.
The paper is organized in six parts. Data used are outlined in the second section. The third section describes the modelling framework. The fourth section presents the results of a sensitivity analysis leading to the selection of gauging stations. Results obtained under climate change are finally discussed in the fifth section before concluding.
Data
Observed hydrological data
Daily flow data were extracted from the French hydrometric network HYDRO (Leleu et al. Citation2014; http://hydro.eaufrance.fr/). The HYDRO database contains more than 5000 time series of daily discharge with different lengths of records and metadata including coordinates and drainage area, along with comments on both hydrometric data quality and human disturbances.
We used discrete field observations from the Observatoire National Des Etiages network (ONDE; https://onde.eaufrance.fr/; Nowak and Durozoi Citation2012). ONDE is a long-term monitoring network set up by the French Office for Biodiversity, recording summer low-flow levels, and it is used to anticipate and manage water crises during severe drought events. There are 3300 ONDE sites evenly distributed throughout France, located mostly on headwater streams with a Strahler order lower than five. All these sites are inspected by trained staff at least once a month between May and September, and have been every year since 2012. One flow state is assigned at each observation, from among the following possibilities: “visible flow” (“Ecoulement visible,” in French), “ponded” (“Ecoulement non visible,” in French) and “dry” (“Assec,” in French). The ONDE network provides complementary information to the HYDRO network (Beaufort et al. Citation2018). For this work, the two flow states “dry” – when the channel is entirely devoid of surface water – and “ponded” – when there is still water in the riverbed but without visible flow – were merged to define “no-flow” states. Half of the ONDE sites have experienced at least one “no-flow” state between 2012 and 2019. Here, we used the 33 field campaigns available in the ONDE database from 1 January 2012 to 31 July 2018.
Forcing meteorological data
Baseline climate data were obtained from the French near-surface Safran meteorological reanalysis (Vidal et al. Citation2010), mapped onto a grid with 8-km resolution, from 1 August 1958 to 31 July 2018. These data were used to calibrate the rainfall–runoff model.
To assess the impact of climate change, an ensemble of projections derived from General Circulation Model (GCM) simulations under both Coupled Model Intercomparison Project 5 (CMIP5) RCPs 2.6 and 8.5 emission scenarios were elaborated. In order to obtain high-resolution projections, the advanced delta change (ADC) approach was applied (Van Pelt et al. Citation2012). The ADC approach is a statistical unbiasing method consisting in defining regressions between future period GCM outputs and reference period GCM outputs (namely, precipitation and temperature). The coefficients of these regressions were provided by Royal Netherlands Meteorological Institute (KNMI, Koninklijk Nederlands Meteorologisch Instituut in Dutch) (see Van Pelt et al. Citation2012, for an application on the Rhine River) and represent the evolution of climate between a control period (1961–1995) and two future periods (2021–2050 and 2071–2100, respectively). Thirteen GCMs were selected to provide data for both RCPs, in order to create a consistent and well-balanced ensemble of projections in terms of GCM sampling, using one run (realization) for each GCM (the same climate models running under two contrasting greenhouse gas concentration trajectories). Using this number of selected GCMs aims at representing in an adequate way the uncertainty linked to GCMs. To obtain high-resolution projections, the ADC approach was applied to 54 years of 8-km Safran data.
Methods
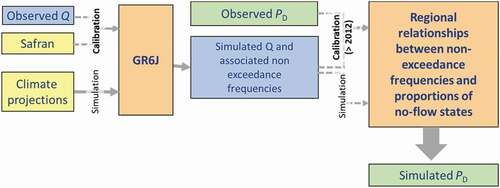
The parametric modelling strategy is summarized in , and its different steps will be detailed in the following subsections.
Figure 1. Schematic framework of the approach developed to estimate the regional probability of drying
Predicting continuous daily probability of drying
The observed regional PD of headwater streams are given by the daily proportions of no-flow states observed at ONDE sites within a region. However, discrete observations of intermittence cannot provide information on the persistence of dry conditions at a finer temporal resolution. The approach suggested by Beaufort et al. (Citation2018) aims to extrapolate the PD values over time by applying regional empirical relationships to a hydrological variable, available at a daily time step over the whole period of interest. Thus, PD(d, i) at day d for region i is computed as follows:
The empirical relationship is calibrated with values of PD derived from ONDE sites available on the different survey dates. The variable F(d, i) is defined as the weighted average non-exceedance frequency of discharge and of groundwater level calculated between days d − 5 and d using all the gauging stations and piezometers located in region i, with respect to their relative numbers. The non-exceedance frequency values of discharge at day d are computed individually from the empirical flow duration curve available at each gauging station. The non-exceedance frequency values of groundwater level at day d are estimated in the same way (i.e. using the cumulative distribution function of daily groundwater level at each piezometer). This variable describes the catchment dynamics and the current water resource conditions within the region.
Beaufort et al. (Citation2018) calibrated the empirical relationships over the period 2012–2016, and the best performances were obtained considering the following two analytical forms for fi with two parameters and to be fitted:
a truncated logarithmic linear regression (TLLR):
a logistic regression (LR), leading to:
Adapting the framework for climate change assessment
The modelling framework for predicting continuous daily probability of drying described above was formerly developed and validated with observations. However, it needs to be adapted and improved for application to address climate change issues. The application of such relationships with a classical top-down approach requires past and future daily flows and groundwater levels. Since no simulations of groundwater levels for the selected regional climate projections are available, only discharge data were used here to compute the weighted average non-exceedance frequency F.
Applying empirical formulas, fitted using observed discharges, to simulated discharges will lead to poor estimates of PD due to bias in hydrological modelling. Thus Equation (1) was recalibrated with simulated past discharges before being applied to future climate conditions. The choice of the advanced delta change approach for generating high-resolution climate projections with current climate conditions given by the Safran reanalysis makes the calibration procedure over the period 2012–2018 with available ONDE observations possible and the interpretation of the results easier.
The Modèle du Génie Rural à 6 paramètres Journalier (GR6J) model is a daily lumped rainfall–runoff model (Pushpalatha et al. Citation2011). GR6J includes six parameters to calibrate and it is based on three conceptual buckets: two unit hydrographs and an intercatchment groundwater exchange component. This model represents an evolution of the well-known GR4J model (Perrin et al. Citation2003). It was shown using large sets of catchments facing diverse conditions that simulations of both high and low flows were improved in GR6J compared to earlier versions of GR (Pushpalatha et al. Citation2011). The GR family of models has already been widely tested across a large spectrum of climate conditions and of river flow regimes (e.g. Hublart et al. Citation2016 in the Andean Mountains; Mathevet et al. Citation2020 in over 2000 catchments in the world) and was found suitable for studies on the impact of climate change on water resources (e.g. Andrew and Sauquet Citation2017 in the French Alps; Givati et al. Citation2019 in the Jordan River; Thirel et al. Citation2019 in the French part of the Rhine River basin) based on its temporal transferability (see De Lavenne et al. Citation2019 who applied it to over 1300 catchments in France). The use of GR6J is therefore judged relevant for this study.
The degree-day snow accumulation and melt module CemaNeige (Valéry et al. Citation2014) was used to consider the snowpack influence on discharge. The two CemaNeige free parameters were fixed to median values to prevent outlier values in catchments poorly influenced by snow. The GR6J model was calibrated against discharge using an objective function averaging the Kling-Gupta efficiency (KGE) (Gupta et al. Citation2009) calculated on discharge and the KGE calculated on the inverse of discharge, as this criterion is known to provide more weight on low flows than on high flows. The robustness of this model (i.e. its temporal transferability) was checked through a calibration–evaluation procedure (results not shown here).
Defining homogeneous regions
As PD estimates are obtained over regions, the selected partitioning of France may have an impact on their calculation. Results of regionalization applications demonstrate that empirical formulas may perform poorly when applied at a large scale due to the high variability of river flow regimes, yielding estimates with large errors. Here we adopted the pre-existing division of France into 22 “level-1” hydro-ecoregions (HERs) suggested by Wasson et al. (Citation2002) (see Supplementary material, Fig. S1). Different aspects of the geology, topography and climate of France considered to be the main determinants of the functioning of water ecosystems were incorporated for delineating the HERs. Previous works have shown the relevance of HERs as hydrologically homogeneous regions to predict flow statistics at ungauged locations (e.g. Sauquet and Catalogne Citation2011). The first application to France by Beaufort et al. (Citation2018) considered a partition of 280 regions referred to as “HER2-HR,” resulting from combinations of “level 2” hydro-ecoregion typology and classes of river flow regimes. Using results of a river flow classification was motivated in this previous work by the need to increase homogeneity within the target regions. However, this is not relevant in a non-stationary context as the river flow regime will evolve in the future. We therefore decided to deal with the partitioning into 22 broad “level-1” HERs (referred to hereafter as “HER”), which incorporate the main geophysical and climatic factors in the delineation process.
In Beaufort et al. (Citation2018), despite the high number of gauging stations (1600) and piezometers (750), PD values are lacking for some of the 280 regions without any time series of discharge and water level (see of Beaufort et al. Citation2018). Only gauging stations located in HER2-HR i contribute to estimating PD in HER2-HR i. Here, we decided to weight each gauging station with respect to the proportion of its drainage area within the boundaries of HER i in the mean non-exceedance frequencies of daily discharges F:
where Ak is the drainage area of the gauging station k, q(d, k) is the daily discharge on day d at gauging station k and N is the total number of gauging stations. The regional relationship for HER i is calibrated and applied using all gauged basins with drainage area partly located in HER i.
Datasets and sensitivity analysis
A sensitivity analysis was performed to test different options starting from the method developed by Beaufort et al. (Citation2018), to evaluate their relative performance, and to select a relevant set of gauging stations for the target application to climate change assessment.
We considered eight sets of gauging stations, which correspond to different balances between the number of available gauging stations and the quality of the discharges simulated by the rainfall–runoff model GR6J:
SN_p: the set of N gauging stations with KGE(√Q) > p/10, p = 1, …, 7 over the period 1960–2018 and with more than five years of records over the period 2012–2018; and
S1270: the set of all 1270 available gauging stations operating during at least three years over the period 2012–2018, experiencing only minor human influence and showing high-quality data in medium and low water stages. The ensemble of gauging stations S1270 provides the best spatial coverage in terms of observations and is considered the benchmark dataset close to the set of 1600 French gauging stations used by Beaufort et al. (Citation2018). Only observed discharges available in the HYDRO database are used for the 1270 gauging stations. Results obtained are thus representative of the models’ performance with observations provided by a dense network.
Note that all selected stations have a drainage area of less than 2000 km2. The large gauged basins with high Strahler order have been discarded since they do not behave similarly to headwater streams. The threshold fixed to 2000 km2 is consistent with the size of the largest gauged intermittent stream in France – 920 km2 – identified in the extended set of 632 French gauging stations used by Snelder et al. (Citation2013). The main characteristics of the catchment datasets are reported in , including on average how many times (Neff) one gauging station is used for calculating the mean non-exceedance frequencies of daily discharges F (EquationEquation (4)(4)
(4) ) and for calibrating the empirical relationship (Equation (1)). These catchment datasets were formed to investigate the sensitivity of the modelling framework to the analytical form for the empirical relationships fi, the calibration options, the number of stations and the performance of the GR6J model demonstrated on the gauging stations, and, finally, to highlight the optimal choices for projecting flow intermittence under climate change conditions. The mean non-exceedance frequency F is calculated with a period of interest limited from 2012 to 2018. Values outside of this period are not considered in estimating the flow duration curves at the gauging sites.
Table 1. Main characteristics of the catchment datasets
In the following, we consider:
two ways of computing F: the gauging stations only contribute to F if they are located in HER i with a weight fixed to 1 (experiment “l,” as suggested by Beaufort et al. (Citation2018)), or to the proportion of their respective drainage area in HER i (experiment “w,” EquationEquation (4)
(4)
two analytical forms “TLLR” (Equation (2)) and “LR” (Equation (3)) for the empirical relationships.
The performance of the modelling framework is evaluated in calibration using the Nash-Sutcliffe efficiency criterion (NSE) (Nash and Sutcliffe Citation1970) computed on PD for each HER over the whole period 2012–2018 (33 values available for each region, derived from the 33 field campaigns made simultaneously at the 3300 ONDE sites). The NSE is a skill score comparing the performance of the tested model to the benchmark model given by the mean of observations. The relevance of this benchmark model is debatable depending on the seasonal pattern displayed in the observations (e.g. Schaefli and Gupta Citation2007, Seibert et al. Citation2018). Here, the benchmark model is given by the mean of ONDE observations from May to September, which is quite representative of the flow regime intermittence in summer. Values of NSE should not be considered in an absolute way but in a relative way, and were used to compare results obtained with different combinations of models, modalities and datasets. We assume that the highest NSE values correspond to the optimal choice. A total of 60 combinations were tested, and results for the SN_p datasets are displayed in with both observed (OBS) and simulated (SIM) discharge.
Figure 2. Performance of the modelling framework applied to observed (Obs) and simulated (Sim) discharges for each dataset, with the different options for computing the non-exceedance frequencies (“l” and “w”) and PD (“TLLR” and “LR”). Box plots are based on the 22 values of NSE obtained in calibration for the 22 HERs
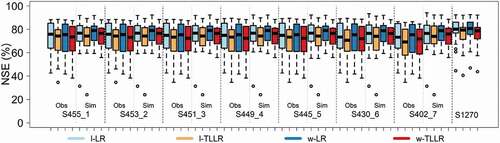
Comparison between experiments “l” and “w” with the best spatial coverage (S1270) shows a weak sensitivity to the way F is computed. The medians and the maxima of NSE differ from less than 1%. However, the minimal value is obtained with the modalities “l” and “TLLR.” Overall, the best modalities are achieved by applying EquationEquation (4)(4)
(4) and the LR model for computing F and PD, respectively.
Comparison between results with OBS demonstrates that the best performances are obtained with S1270, with NSE ~ 0.77. There is a weak correlation between NSE on a HER and the number of gauging stations available (r2 ~ 0.09) using OBS. Results with OBS confirm the need for a dense network, supported by Beaufort et al. (Citation2018).
Comparison between results with SIM demonstrates that there is no obvious link between the performance requirement in hydrological modelling and the accuracy of PD predictions (on average, for the four modalities with SIM, NSE = 0.75 for both S455_1 and S402_7), and no significant correlation was found between NSE and the number of gauging stations using SIM. This may indicate that including gauging stations (dataset S455_1 contains 53 additional stations compared to S402_7 but with 0.1 < KGE(√Q) ≤ 0.7) where the performance of the model GR6J is low may offset the benefit of increasing the number of gauging stations.
Tests applied to the seven SN_p sets with the two types of discharge (SIM and OBS) show a moderate sensitivity of the modelling skill to the source of discharge data (with, on average, NSE ~ 0.75 using GR6J outputs while NSE ~ 0.71 with OBS). The dispersion in performance is reduced by using SIM instead of OBS. A “smoothing” introduced by the hydrological modelling is a possible reason for this. Considering simulated discharges may reduce dispersion in non-exceedance probability at gauging stations, and the estimated F derived from GR6J could be more relevant for describing mean hydrological conditions at the regional scale.
The different modalities tested lead to a similar performance range. Results confirm the conclusions of Beaufort et al. (Citation2018): the LR model outperforms the TLLR model. There is no clear gain in performance using EquationEquation (4)(4)
(4) . However, the main advantage is a better coverage of France and a multiple use of the gauging stations (Neff > 1) that may balance a too-sparse observation network. The lowest performances are likely to be linked to the level of intermittence and the size of the regions (models usually fail to predict rare events and, here, are expected to be less reliable in areas with very few observed dry states). Finally, the sensitivity analysis fails to give clear guidance for designing the dataset. Note that the sensitivity analysis was also carried out using the KGE criterion computed on PD, and results (not shown here) and conclusions are very similar.
In the following, a final set of 635 gauging stations, including all stations with KGE(0.6 and drainage area of less than 2000 km2, will be considered for calibration. This catchment set includes gauging stations of S430_6 since no constraint on availability of observed discharge during the period 2012–2018 was required in the following application. Values of PD are computed with the two options “w” and “LR.” The choice of discarding gauging stations with KGE(
) ≤ 0.6 stems from a compromise between the performance of the hydrological model assessed under current climate conditions and the uneven coverage of the gauging stations across France. The modality “w” is a way to indirectly increase the number of stations involved in the calibration process.
Comparisons between observations and PD computed with the set of 635 gauging stations show that:
● the less satisfactory performance is identified in the northern part of France (HER 22), with high deviation to observations during summer 2016 and in mountainous areas (HERs 2, 4 and 5). Results for six regions with medium (HERs 2, 3 and 4) to high (HERs 6, 9 and 14) NSE scores have been chosen for illustration;
● the rising phase of drying is well captured by the modelling approach. However, simulated values for the rewetting phase cannot be validated against observations, as it is unfortunately not monitored by the ONDE network;
● the modelling approach reproduced well the inter-annual variability, differentiating accurately between dry years (2012, 2016 and 2017) and wet years with fewer drying occurrences (2013, 2014 and 2015);
● the performance obtained with the 635 gauging stations is slightly lower than that obtained with S1270, whose network is denser. The least satisfactory performances for both sets of gauging stations are found in the same areas in northern France HER 22 and northeastern France HER 4 (see , top right);
Figure 3. Map of NSE with locations of the selected gauging stations and examples of results for six HERs. Time series of PD obtained with Equations (3) and Equation(4)(4)
(4) and discrete PD derived from ONDE observations are displayed
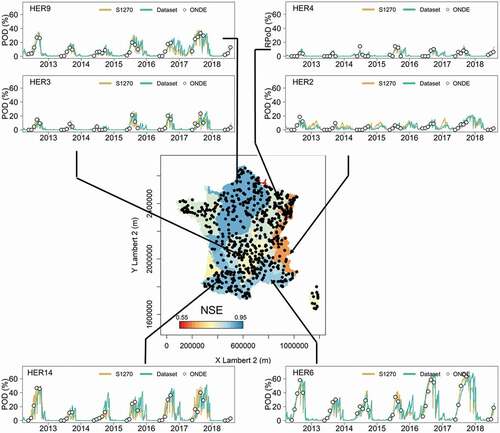
● the distribution of dry events is bimodal for HER 2 (, top right). The modelling approach suggests dry events in summer as well as in winter when river flows and their corresponding non-exceedance probability are low due to solid precipitation occurrence and snowpack formation. This second peak is expected (relevant in terms of hydrological processes). However, the proportion of dry streams in headwater out of the period of ONDE observations (which is from May to September) cannot be verified. Elsewhere, elevation is not high enough and air temperature is not low enough to induce a second local peak in time series of simulated PD; and
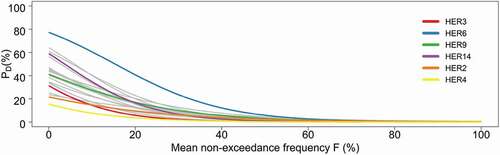
● the occurrence of dry events is highly heterogeneous across France, and this heterogeneity is reflected in the fitted empirical relationships for predicting PD (). For example, these relationships suggest higher values of PD over the full range of F for HER 6, which experiences a Mediterranean climate.
Figure 4. Calibrated logistic regressions (LRs) between PD and F for the 22 HERs
The modelling approach demonstrates its ability to simulate dry states over the period 2012–2018 and its usefulness as a tool to objectively simulate change in flow intermittence under modified climate conditions.
Changes in flow intermittence
The modelling framework was applied to the 22 HERs under regional climate projections to assess the potential impact of climate change on flow intermittence dynamics. The resulting analysis focuses on different components of the river flow regime that are informative regarding ecological processes. Many hydrological metrics have been suggested to characterize flow intermittence at the local scale (e.g. Costigan et al. Citation2017, Leigh and Datry Citation2017, Acuña et al. Citation2020) and along the river pathway (e.g. Sefton et al. Citation2019). Here, metrics have been adapted from pre-existing hydrological indices computed from time series of daily flows and increasingly reported in ecological studies of intermittent rivers. These metrics aim to describe major drivers of ecological responses (spatial extent, duration and timing of drying) at the regional scale:
● the mean of and the standard deviation of the yearly average value of PD from June to November, adapted from the mean number and the coefficient of variation of annual no-flow days. The standard deviation of annual PD is a measure of year-to-year variability;
● the extension of drying in terms of duration and frequency of occurrence: the metric is based on the time series of d-day minimum:
For example, a value of 42% for x(t = 25 July 2010, d = 20 d) means that at least 42% of the streams in the region were dry between 6 and 25 July 2010. We consider here d = 20 d to characterize the persistence in both space and time of dry events. Changes in flow intermittence for short durations were not analysed, as the frequency of field surveys does not allow assessing the performance at a fine temporal resolution. Annual maximum values have been extracted from the time series of x. The hydrological year starts 1 April and runs through 31 March of the next year. This definition was supported by an analysis of the seasonality of the mean onset timing of no-flow events in Europe (Sauquet et al. Citation2020). The Generalized Extreme Value (GEV) distribution was fitted to the datasets since, following the theory of extreme values, GEV distribution is well adapted to the case of block maxima and upper bounded (x ≤ 100%) data. We examined the quantiles with a five-year return period, which are the values exceeded over a continuous duration of 20 d on average every five years;
● the seasonal predictability given by:
where PD_dry and PD_wet represent the average frequency of PD for the contiguous six driest months of the year and for the remaining six wetter months, respectively derived from the 6-month seasonal predictability of dry periods Sd6 introduced by Gallart et al. (Citation2012); and
● the mean Julian date of the first and the last annual days with PD > 10%, adapted from the mean Julian date of the first annual no-flow day.
The empirical relationships are calibrated with the 33 field campaigns available in the ONDE database from 1 January 2012 to 31 July 2018. Results of changes in PD (ΔPD) are displayed for the periods 1960–2018 (PST), 2021–2050 and 2071–2100.
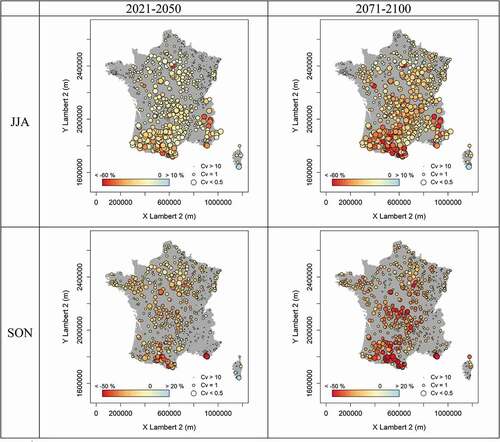
The ensemble of regional projections suggests an increase in mean annual temperature of 1.3–1.8°C (quantiles 5 and 95% of the ensemble) for RCP 2.6 and 1.6–2.1°C for RCP 8.5 for the period 2021–2050 and of 2.1–3.2°C for RCP 2.6 and 3.0–4.0°C for RCP 8.5 for the period 2071–2100. Seasonal changes in both air temperature and total precipitation are displayed in Figs S2 and S3 of the Supplementary material. The temperature increase seems more important for summer (JJA) and autumn (SON) than for the rest of the year. While the evolution of annual precipitation is highly uncertain in the future (between −5% and +6% for both RCPs for the period 2021–2050 and between −11% and +8% for the period 2071–2100), the evolution for summer precipitation is clearer with a projected decrease for France along a north–south gradient and more pronounced changes for the period 2071–2100. The evolution for autumn is uncertain, with precipitation changing between positive and negative percentages for all periods. Although regional projections suggested different temporal patterns and magnitudes of change, a consistent large decrease in annual flows is identified with an accompanying decrease in mean summer and autumns flow (). The projected changes are more pronounced for the 2071–2100 period than for the 2021–2050 period and for the southern part than for the northern part of France. Dispersion within regional projections is perceptible in summer and autumn flow (large dots relate to a high confidence in the sign of the projected change). Confidence in the sign of the change in summer is low in northeastern France due to large uncertainties in precipitation projections. Dispersion in results for autumn in the Alps is partly due to projected changes in air temperature and their consequences in terms of the snow/rain ratio. Similarly, Dayon et al. (Citation2018) found a significant increase in hydrological drought severity with a meridional gradient (−50% in southwestern France and in the Alps for summer flow between the periods 1960–1990 and 2070–2100) based on CMIP5 climate projections.
Figure 5. Changes in mean summer (JJA) and autumn (SON) flow for the periods (a) 2021–2050 and (b) 2071–2100
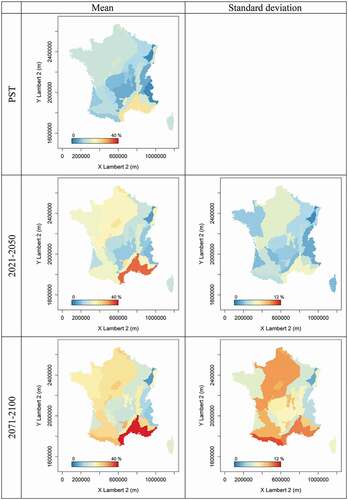
All diagnoses consistently point towards an increase in PD. Yearly values were first derived from daily PD considering months from June to November before averaging them over the three periods PST, 2021–2050 and 2071–2100, and statistics (mean and standard deviation) are displayed in . The standard deviation gives a measure of dispersion due to GCMs. The mean PD over the whole period June–November (, left column) is 12% at the national scale under the current climate, compared to 17% and 21% on average among all RCPs together for the periods 2021–2050 and 2071–2100, respectively. The spatial pattern of PD is globally similar for the different periods. All regions see increases in PD. However, the changes are not uniform (e.g. ΔPD ranges from +2% in the Vosges Massif of northeastern France to +19% in the Pyrenees Massif of southwestern France) between the current conditions and the end of the 21st century), resulting in a more contrasting spatial pattern (the range of PD values increases with lead time). The differences in the magnitude of ΔPD are partly due to changes projected in flow and in summer and autumn precipitation. The north part of France is less affected than the south part. All the mountainous areas with historically low probability of drying will be moderately affected by climate change. An exception is the Pyrenees Massif. Changes in the Pyrenees Massif contrast with changes projected in the neighbouring HER 13 “Landes” on the Atlantic coast, where the large unconfined aquifer could sustain low flows and thus reduce the risk of drying. The standard deviation of the long-term mean PD (, right column) is projected to increase, and the spatial pattern looks similar to the pattern of the mean (the mean and the standard deviation of long-term average PD are highly correlated, r2 > 0.60). As expected, the standard deviation, and thus dispersion in models outputs, increases in parallel to the uncertainty in climate projections; that is, values of the standard deviation are higher for the end of the 21st century than for the near future.
Figure 6. Statistics of the long-term average of PD from June to November for the periods PST, 2021–2050 and 2071–2100 computed for each HER
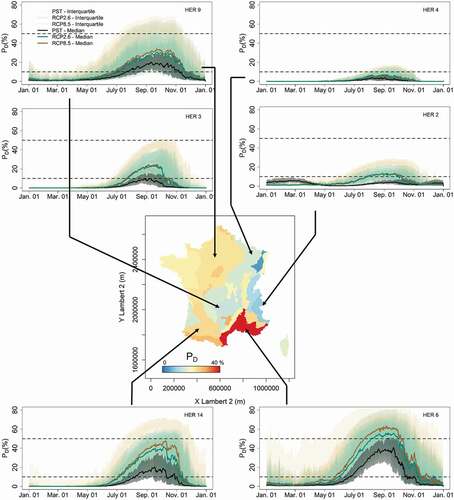
shows the median annual curves of PD simulated with the 13 RCP2.6 and RCP8.5 climate projections for six HERs. Shaded areas indicate interquartile ranges computed individually for each regional projection, and dashed lines indicate the 10% and 50% levels. Summer is the time of year when most of the no-flow events occur under current conditions for all HERs but one. In HER 2 (Alps), the modelling framework suggests the predominance of flow intermittence due to freezing during the period 1960–2018, in compliance with results obtained for the period 2012–2018 (). At the annual scale, there is very little change in flow intermittence in HER 2 due to a “balance effect” – that is, an increase in zero-flow events in summer could compensate a decrease in zero-flow events in winter. Extreme situations have been projected for the end of the 21st century: for example, under RCP 8.5 scenarios, PD can be higher than 80% during summer and the probability of drying is not negligible in winter.
Figure 7. Seasonal pattern of PD for the period 2071–2100 for six HERs (dotted lines indicate 10% and 50%)
The two graphs in illustrate the changes in other aspects of river flow regime, and for each of them the segments enable displaying the trajectory from PST to the end of the 21st century for each HER.
Figure 8. Flow regime based on six metrics: (a) mean and standard deviation (σ) of PD, quantile of 20-d events with a five-year return period; (b) onset and ending timings, predictability. Each segment is related to one of the 22 HERs and describes the average trajectory with time from PST, to 2021–2050 and 2071–2100
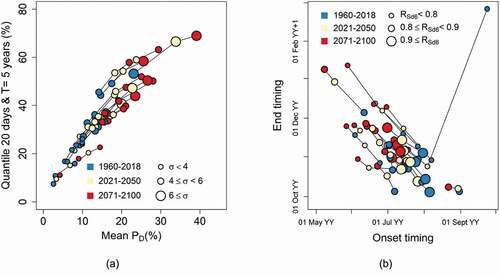
In ), dots under current conditions are located on the bottom left side of the graph. These dots are moving progressively to the top right, showing an increase in both mean and extreme values of PD. The size of the dots increases with the lead time, indicating more year-to-year variability. Under future conditions, four and seven HERs will experience drying conditions for half headwater streams over a period of 20 d every five years in 2021–2050 and in 2071–2100, respectively, while this is only the case for one region (HER 6 around the Mediterranean coast).
) displays change in no-flow event timing and complements . On average, the first value (10%) is observed between the beginning of June and mid-August, and PD falls below 10% between the beginning of October and the end of November for most of the HERs under current conditions. Note that the isolated point in , top right) is associated with the Alps (HER 2) under current conditions. The 10% threshold is not frequently exceeded in summer, and the mean Julian date of the first and the last annual days with PD > 10% are 23 September and 24 February of the next year, respectively. At the end of the 21st century, zero-flow conditions prevailed in summer, and the onset and end timings are expected in mid-July and the beginning of November, respectively. The periods with PD above 10% will start 20 d earlier and will end 20 d later. Results suggest a general shift towards longer and more severe dry events. The seasonal predictability RSd6 does not show any significant change since no-flow occurrence has had and will still have pronounced seasonality, and due to the offsetting impact of increases in PD_dry and PD_wet during both dry and wet periods, respectively (see Equation (6)).
At the national scale, a more contrasting spatial pattern is projected in the future than under current conditions, moving towards more frequent dry conditions. Red dots in representative of the end of the 21st century deviate from the scatter of the blue dots representative of the current conditions. Which present-day rivers will French headwater streams resemble? What current location in Europe most resembles the future flow intermittence in France? Answering these questions is not straightforward since there is no equivalent to the ONDE network in other countries. However, an analysis was performed on time series of daily discharges from a regional set of near-natural basins characterized by dry climates located in a neighbouring European country. Data collected from 24 gauged rivers in northern Spain with drainage area < 100 km2 – both perennial and intermittent – experiencing Cold semi-arid (Bsk) and Hot-summer Mediterranean (Csa) climates (Cunha et al. Citation2011) was thus selected (see Supplementary material, Fig. S4) and pooled to compute values of PD. No-flow days at the gauging station are days for which the observed daily flow was strictly below 1 L/s. Over the period 1977–1991, median values PD are below 44% in southern Spain, which is less than the median values projected in France for summer at the end of the 21st century (). However, the comparison between PD in Spain under current conditions and future PD for France is probably biased by the selection of gauging stations in Spain (50% of the ONDE sites have a drainage area between 12 and 50 km2, while 75% of the selected Spanish gauging stations have an area larger than 47 km2). Current probabilities of drying for headwater streams along the French Mediterranean coast (HER 6) are comparable to those projected for the end of the 21st century in a large part of southwestern and northwestern France.
Consequences for biodiversity
Intermittence will become more widespread in regions currently relatively unexposed to such conditions. While the North of France will have intermittence extents comparable to those of the Mediterranean area today, the percentage of dry reaches will double in the Mediterranean area. The changes observed here might be too rapid to allow species to adapt, which might lead to high extinction risks for aquatic biota and particularly headwater specialists unable to disperse over land (e.g. fishes, Jaeger et al. Citation2014). In a non-fragmented landscape, species can move down- or upstream to find refuge during the dry period. The increase in the extent of intermittence may increase the fragmentation of the river network and prevent access to perennial refuges (Davey and Kelly Citation2007), increasing species extinction risks (Jaeger et al. Citation2014, Vander Vorste et al. Citation2020).
The earlier onset of intermittence almost everywhere could affect species with specific phenology, perhaps leading to earlier insect emergences (Leberfinger et al. Citation2010) or not allowing species to complete their life cycles between dry phases. For example, intermittence can affect fish migration patterns in years when the river network is highly fragmented (Kelson et al. Citation2020). Similarly, drying events occurring later in the growing season might interact with organisms’ phenology, and the absence of water during leaf abscission could reduce organic matter decomposition and affect the entire carbon cycle (Datry et al. Citation2018b, Truchy et al. Citation2020). Such temporal changes may also affect food webs if, for example, insect emergences are decoupled from the life cycle of their terrestrial and aquatic consumers (Renner and Zohner Citation2018).
Changes in the seasonality of peak and low flows may strongly affect community composition, particularly in snow-dominated hydrological systems (see Mustonen et al. Citation2018) such as Alpine streams. Summer intermittence may particularly affect the communities (Piano et al. Citation2019, Siebers et al. Citation2020) and the functioning of Alpine stream ecosystems (Siebers et al. Citation2019) that have historically been little exposed to such events. Strategies that confer resistance to freezing could also serve to resist drying (Tolonen et al. Citation2019); however, such change in seasonality is likely to override species’ adaptation capacity, leading to important changes in freshwater community composition (Mustonen et al. Citation2018).
Conclusions
In this study, we quantify the changes in regional characteristics of river flow intermittence over the 21st century and across France. A modelling framework supported by field observations performed on a large number of French intermittent streams was calibrated under current climate conditions and applied using projected discharges obtained from GR6J with the GCM-driven forcings on an extended set of gauging stations under future climate conditions.
The magnitude of changes is not uniform and depends on the changes in climate and on the geological characteristics of the areas. Unsurprisingly, climate change will increase the duration and the severity of no-flow events.
This study illustrates how discrete (in space and time) field observations in combination with more conventional data can help provide a better understanding of variability in hydrological processes (here, drying dynamics). It also supports the development of national networks such as the French network ONDE, to overcome the lack of hydrological data in headwaters.
The results described here only show the effect of climate change on river flow intermittence. Additional human pressures such as water abstraction in rivers and aquifers may accentuate the frequency of no-flow events. Regional relationships between non-exceedance frequency and fraction of headwaters with dry beds have been calibrated against past conditions over a short period (seven years of availability of ONDE observations). The main hypothesis is that these relationships will remain valid under future conditions in France. They have been used in extrapolation as well as hydrological models, which were forced by climate projections. Flow intermittence due to freezing was not examined in detail, due to the lack of data; however, consistent results were obtained. Another limitation of this study is the use of a delta change approach to derive high-resolution climate projections. In particular, climate dynamics and variability will not change, implying that dry-spell durations under future conditions will be similar to those observed under current conditions, among other drawbacks. However, no bias-corrected high-resolution Regional Climate Model (RCM) outputs were available at the start of this study. A new ensemble of projections, named DRIAS2020, has been recently published for France (available at www.drias-climat.fr, “Donner accés aux scénarios climatiques Régionalisés français pour l’Impact et l’Adaptation de nos Sociétés et environnement”). This dataset is a subset of RCM projections provided by the EURO-CORDEX initiative (https://www.euro-cordex.net) bias-corrected by the ADAMONT method (Verfaillie et al. Citation2017). The DRIAS2020 dataset will be used to force hydrological models to update a former study of climate change impact on water resources (Chauveau et al. Citation2013). The ADAMONT method uses a refined quantile mapping approach better adapted to address extreme situations such as droughts (Teutschbein and Seibert Citation2012).
This study can be considered a “proof of concept” to demonstrate the ability of the framework developed by Beaufort et al. (Citation2018) to project flow intermittence at the regional scale under future climate conditions. This work also represents the first attempt to predict intermittence risk for headwaters in France under climate change. The conclusions of this study – like other studies on the impact of climate change – are driven by numerous choices (including models, dataset, hypotheses, etc.) and might be tempered by the way climate change projections have been produced. However, the predictions should draw the attention of policymakers and managers, and encourage them to plan for the impacts of climate change on headwater streams. The obtained predictions can be adjusted and extended to other regions as scientific knowledge increases, updated regional climate projections and improved hydrological models are continuously developed, and networks such as ONDE are designed.
Supplemental Material
Download MS Word (2.2 MB)Acknowledgements
The authors thank Météo-France for providing access to the Safran database. We thank Quentin Bottet for developing the modelling framework, Jules Beersma for providing the Advanced Delta change R package and Madeleine Nicolas for producing the climate projections. Analyses were performed in R (R Core Team 2016), with the package airGR (Coron et al. Citation2017, Citation2020). We thank the editor and two anonymous reviewers for their helpful critique, which improved this manuscript.
Disclosure statement
No potential conflict of interest was reported by the authors.
Supplementary material
Supplemental data for this article can be accessed here.
Additional information
Funding
References
- Acuña, V., et al., 2020. Accounting for flow intermittency in environmental flows design. Journal of Applied Ecology, 57 (4), 742–753. doi:https://doi.org/10.1111/1365-2664.13590.
- Andrew, J.T. and Sauquet, E., 2017. Climate change impacts and water management adaptation in two mediterranean-climate watersheds: learning from the durance and sacramento rivers. Water, 9 (2), 126. doi:https://doi.org/10.3390/w9020126.
- Asadi Zarch, M.A., et al., 2017. Future aridity under conditions of global climate change. Journal of Hydrology, 554, 451–469. doi:https://doi.org/10.1016/j.jhydrol.2017.08.043
- Beaufort, A., et al., 2018. Extrapolating regional probability of drying of headwater streams using discrete observations and gauging networks. Hydrology and Earth System Sciences, 22 (5), 3033–3051. doi:https://doi.org/10.5194/hess-22-3033-2018
- Beaufort, A., Carreau, J., and Sauquet, E., 2019. A classification approach to reconstruct local daily drying dynamics at headwater streams. Hydrological Processes, 33 (13), 1896–1912. doi:https://doi.org/10.1002/hyp.13445
- Bennett, K.E., et al., 2020. Future water resource shifts in the high desert Southwest of Northern New Mexico, USA. Journal of Hydrology: Regional Studies, 28, 100678. doi:https://doi.org/10.1016/j.ejrh.2020.100678.
- Blöschl, G., et al., 2019. Twenty-three unsolved problems in hydrology (UPH) – a community perspective. Hydrological Sciences Journal, 64 (10), 1141–1158. doi:https://doi.org/10.1080/02626667.2019.1620507
- Chauveau, M., et al., 2013. What will be the impacts of climate change on surface hydrology in France by 2070? La Houille Blanche, 4, 1–15.
- Cherlet, M., et al., Eds., 2018. World atlas of desertification. Luxembourg: Publication Office of the European Union.
- Cipriani, T., et al., 2014. Impact of climate change on aquatic ecosystems along the Asse River Network. In: FRIEND-Water 2014, Hydrology in a Changing World: Environmental and Human Dimensions, February 2014. Hanoi, Vietnam: (IAHS Publ. 36X, 2014), 463–468.
- Coron, L., et al., 2017. The suite of lumped GR hydrological models in an R package. Environmental Modelling and Software, 94, 166–171. doi:https://doi.org/10.1016/j.envsoft.2017.05.002.
- Coron, L., et al., 2020. airGR: suite of GR hydrological models for precipitation-runoff modelling, R package version 1.4.3.65. doi:https://doi.org/10.15454/EX11NA
- Costigan, K., et al., 2017. Flow regimes in intermittent rivers and ephemeral streams. In: T. Datry, N. Bonada, and A.J. Boulton, eds. Intermittent rivers and ephemeral streams. Ecology and management. San Diego: Academic Press, 51–78.
- Crabot, J., et al., 2020. Drying determines the temporal dynamics of stream invertebrate structural and functional beta diversity. Ecography, 43 (4), 620–635. doi:https://doi.org/10.1111/ecog.04835
- Cunha, S., et al., 2011. Atlas Climático Ibérico – Iberian climate atlas. ISBN: 978–84–7837–079–5.
- Datry, T., et al., 2018a. Flow intermittence and ecosystem services in rivers of the Anthropocene. Journal of Applied Ecology, 55 (1), 353–364. doi:https://doi.org/10.1111/1365-2664.12941
- Datry, T., et al., 2018b. A global analysis of terrestrial plant litter dynamics in non-perennial waterways. Nature Geoscience, 11 (7), 497–503. doi:https://doi.org/10.1038/s41561-018-0134-4
- Davey, A.J.H. and Kelly, D.J., 2007. Fish community responses to drying disturbances in an intermittent stream: a landscape perspective. Freshwater Biology, 52 (9), 1719–1733. doi:https://doi.org/10.1111/j.1365-2427.2007.01800.x
- Dayon, G., et al., 2018. Impacts of climate change on the hydrological cycle over France and associated uncertainties. Comptes Rendus Geoscience, 350 (4), 141–153. doi:https://doi.org/10.1016/j.crte.2018.03.001
- De Girolamo, A.M., et al., 2017. Hydrology under climate change in a temporary river system: potential impact on water balance and flow regime. River Research and Applications, 33 (7), 1219–1232. doi:https://doi.org/10.1002/rra.3165
- De Lavenne, A., et al., 2019. A regularization approach to improve the sequential calibration of a semi‐distributed hydrological model. Water Resources Research, 55 (11), 8821–8839. doi:https://doi.org/10.1029/2018WR024266.
- Delso, J., Magdaleno, F., and Fernández-Yuste, J.A., 2017. Flow patterns in temporary rivers: a methodological approach applied to southern Iberia. Hydrological Sciences Journal, 62 (10), 1551–1563. doi:https://doi.org/10.1080/02626667.2017.1346375
- Döll, P. and Schmied, H.M., 2012. How is the impact of climate change on river flow regimes related to the impact on mean annual runoff? A global-scale analysis. Environmental Research Letters, 7 (1), 014037. doi:https://doi.org/10.1088/1748-9326/7/1/014037
- Gallart, F., et al., 2012. A novel approach to analysing the regimes of temporary streams in relation to their controls on the composition and structure of aquatic biota. Hydrology and Earth System Sciences, 16, 3165–3182. doi:https://doi.org/10.5194/hess-16-3165-2012, 2012
- Givati, A., et al., 2019. Climate change impacts on streamflow at the upper Jordan River based on an ensemble of regional climate models. Journal of Hydrology: Regional Studies, 21, 92–109. doi:https://doi.org/10.1016/j.ejrh.2018.12.004.
- Gupta, H.V., et al., 2009. Decomposition of the mean squared error and NSE performance criteria: implications for improving hydrological modelling. Journal of Hydrology, 377 (1–2), 80–91. doi:https://doi.org/10.1016/j.jhydrol.2009.08.003.
- Hublart, P., et al., 2016. Reliability of lumped hydrological modeling in a semi-arid mountainous catchment facing water-use changes. Hydrology and Earth System Sciences, 20 (9), 3691–3717. doi:https://doi.org/10.5194/hess-20-3691-2016.
- Jaeger, K.L., Olden, J.D., and Pelland, N.A., 2014. Climate change poised to threaten hydrologic connectivity and endemic fishes in dryland streams. Proceedings of the National Academy of Sciences of the United States of America, 111 (38), 13894–13899. doi:https://doi.org/10.1073/pnas.1320890111
- Kelson, S.J., et al., 2020. Temporal dynamics of migration-linked genetic variation are driven by streamflows and riverscape permeability. Molecular Ecology, 29 (5), 870–885. doi:https://doi.org/10.1111/mec.15367
- Leberfinger, K., Bohman, I., and Herrmann, J., 2010. Drought impact on stream detritivores: experimental effects on leaf litter breakdown and life cycles. Hydrobiologia, 652 (1), 247–254. doi:https://doi.org/10.1007/s10750-010-0337-1
- Leigh, C. and Datry, T., 2017. Drying as a primary hydrological determinant of biodiversity in river systems: a broad‐scale analysis. Ecography, 40 (4), 487–499. doi:https://doi.org/10.1111/ecog.02230
- Leleu, I., et al., 2014. La refonte du système d'information national pour la gestion et la mise à disposition des données hydrométriques. La Houille Blanche, 1 (2014), 25–32. doi:https://doi.org/10.1051/lhb/2014004
- Mathevet, T., et al., 2020. Assessing the performance and robustness of two conceptual rainfall-runoff models on a worldwide sample of watersheds. Journal of Hydrology, 585, 124698. doi:https://doi.org/10.1016/j.jhydrol.2020.124698
- Mustonen, K.-R., et al., 2018. Thermal and hydrologic responses to climate change predict marked alterations in boreal stream invertebrate assemblages. Global Change Biology, 24 (6), 2434–2446. doi:https://doi.org/10.1111/gcb.14053
- Nash, J.E. and Sutcliffe, J.V., 1970. River flow forecasting through conceptual models part I – a discussion of principles. Journal of Hydrology, 10 (3), 282–290. doi:https://doi.org/10.1016/0022-1694(70)90255-6
- Nowak, C., and Durozoi, B. (2012). Observatoire national des Etiages. Technical report. Vincennes: ONEMA.
- Park, C. E., et al., 2018. Keeping global warming within 1.5°C constrains emergence of aridification. Nature Climate Change, 8, 70–74. doi:https://doi.org/10.1038/s41558-017-0034-4
- Perrin, C., Michel, C., and Andréassian, V., 2003. Improvement of a parsimonious model for streamflow simulation. Journal of Hydrology, 279 (1–4), 275–289. doi:https://doi.org/10.1016/S0022-1694(03)00225-7.
- Piano, E., et al., 2019. If Alpine streams run dry: the drought memory of benthic communities. Aquatic Sciences, 81 (2), 1–14. doi:https://doi.org/10.1007/s00027-019-0629-0
- Pumo, D., et al., 2016. Climate change effects on the hydrological regime of small non-perennial river basins. Science of the Total Environment, 542, 76–92. doi:https://doi.org/10.1016/j.scitotenv.2015.10.109.
- Pushpalatha, R., et al., 2011. A downward structural sensitivity analysis of hydrological models to improve low-flow simulation. Journal of Hydrology, 411 (1–2), 66–76. doi:https://doi.org/10.1016/j.jhydrol.2011.09.034.
- Querner, E.P., et al., 2016. Simulating streamflow variability and aquatic states in temporary streams using a coupled groundwater-surface water model. Hydrological Sciences Journal, 61 (1), 146–161. doi:https://doi.org/10.1080/02626667.2014.983514.
- Renner, S.S. and Zohner, C.M., 2018. Climate change and phenological mismatch in trophic interactions among plants, insects, and vertebrates. Annual Review of Ecology, Evolution, and Systematics, 49 (1), 165–182. doi:https://doi.org/10.1146/annurev-ecolsys-110617-062535
- Reynolds, L.V., Shafroth, P.B., and Poff, N.L., 2015. Modeled intermittency risk for small streams in the Upper Colorado River Basin under climate change. Journal of Hydrology, 523, 768–780. doi:https://doi.org/10.1016/j.jhydrol.2015.02.025
- Sarremejane, R., et al., 2020. Local and regional drivers influence how aquatic community diversity, resistance and resilience vary in response to drying. Oikos, 129 (12), 1877–1890. doi:https://doi.org/10.1111/oik.07645.
- Sauquet, E., et al., 2020. A catalogue of European intermittent rivers and ephemeral streams, Technical report SMIRES COST Action CA15113, 100. doi: https://doi.org/10.5281/zenodo.3763419.
- Sauquet, E., et al., 2021. Classification and trends in intermittent river flow regimes in Australia, Northwestern Europe and USA: a global perspective. Journal of Hydrology, 597, 126170. doi:https://doi.org/10.1016/j.jhydrol.2021.126170.
- Sauquet, E. and Catalogne, C., 2011. Comparison of catchment grouping methods for flow duration curve estimation at ungauged sites in France. Hydrology and Earth System Sciences, 15 (8), 2421–2435. doi:https://doi.org/10.5194/hess-15-2421-2011
- Schaefli, B. and Gupta, H.V., 2007. Do Nash values have value? Hydrological Processes, 21 (15), 2075–2080. doi:https://doi.org/10.1002/hyp.6825
- Sefton, C., et al., 2019. Visualising and quantifying the variability of hydrological state in intermittent rivers. Fundamental and Applied Limnology, 193 (1), 21–38. doi:https://doi.org/10.1127/fal/2019/1149
- Seibert, J., et al., 2018. Upper and lower benchmarks in hydrological modelling. Hydrological Processes, 32 (8), 1120–1125. doi:https://doi.org/10.1002/hyp.11476.
- Siebers, A.R., et al., 2020. Effects of an experimental increase in flow intermittency on an alpine stream. Hydrobiologia, 847 (16), 3453–3470. doi:https://doi.org/10.1007/s10750-020-04350-7
- Siebers, A.R., Paillex, A., and Robinson, C.T., 2019. Flow intermittency influences the trophic base, but not the overall diversity of alpine stream food webs. Ecography, 42 (9), 1523–1535. doi:https://doi.org/10.1111/ecog.04597
- Snelder, T.H., et al., 2013. Regionalization of patterns of flow intermittence from gauging station records. Hydrology and Earth System Sciences, 17 (7), 2685–2699. doi:https://doi.org/10.5194/hess-17-2685-2013.
- Soria, M., et al., 2017. Biodiversity in perennial and intermittent rivers: a meta-analysis. Oikos, 126 (8), 1078–1089. doi:https://doi.org/10.1111/oik.04118
- Teutschbein, C. and Seibert, J., 2012. Bias correction of regional climate model simulations for hydrological climate-change impact studies: review and evaluation of different methods. Journal of Hydrology, 456–457, 12–29. doi:https://doi.org/10.1016/j.jhydrol.2012.05.052.
- Theodoropoulos, C., et al., 2019. Conceptualization and pilot application of a model-based environmental flow assessment adapted for intermittent rivers. Aquatic Sciences, 81 (1), 10. doi:https://doi.org/10.1007/s00027-018-0605-0.
- Thirel, G., et al., 2019. Future streamflows for the French tributaries of the River Rhine (Mosel, Sarre and Ill)? La Houille Blanche, 105 (5–6), 140–149. doi:https://doi.org/10.1051/lhb/2019039.
- Tolonen, K.E., et al., 2019. Parallels and contrasts between intermittently freezing and drying streams: from individual adaptations to biodiversity variation. Freshwater Biology, 64 (10), 1679–1691. doi:https://doi.org/10.1111/fwb.13373
- Truchy, A. et al., 2020. Habitat patchiness, ecological connectivity and the uneven recovery of boreal stream ecosystems from an experimental drought. Global Change Biology, 26 (6), 3455–3472. doi:https://doi.org/10.1111/gcb.15063
- Tzoraki, O., et al., 2015. Assessing the flow alteration of temporary streams under current conditions and changing climate by soil and water assessment tool model. International Journal of River Basin Management. doi:https://doi.org/10.1080/15715124.2015.1049182.
- Valéry, A., Andréassian, V., and Perrin, C., 2014. ‘As simple as possible but not simpler’: what is useful in a temperature-based snow-accounting routine? Part 2 – sensitivity analysis of the Cemaneige snow accounting routine on 380 catchments. Journal of Hydrology, 517, 1176–1187. doi:https://doi.org/10.1016/j.jhydrol.2014.04.058.
- van Meerveld, H.J.I., et al., 2020. Aqua temporaria incognita. Hydrological Processes, 1–8. doi:https://doi.org/10.1002/hyp.13979
- Van Pelt, S.C., et al., 2012. Future changes in extreme precipitation in the Rhine basin based on global and regional climate model simulations. Hydrology and Earth System Sciences, 16 (12), 4517–4530. doi:https://doi.org/10.5194/hess-16-4517-2012
- Vander Vorste, R., et al., 2020. Refuges and ecological traps: extreme drought threatens persistence of an endangered fish in intermittent streams. Global Change Biology, 26 (7), 3834–3845. doi:https://doi.org/10.1111/gcb.15116
- Verfaillie, D., et al., 2017. The method ADAMONT v1.0 for statistical adjustment of climate projections applicable to energy balance land surface models. Geoscientific Model Development, 10 (11), 4257–4283. doi:https://doi.org/10.1111/1365-2664.13590
- Vidal, J.-P., et al., 2010. A 50-year high-resolution atmospheric reanalysis over France with the Safran system. International Journal of Climatology, 30 (11), 1627–1644. doi:https://doi.org/10.1002/joc.2003
- Wasson, J.-G., et al., 2002. Typology and reference conditions for surface water bodies in France: the hydro-ecoregion approach. In: M. Ruoppa, and K. Karttunen, eds. Typology and ecological classification of lakes and rivers, TemaNord 2002:566. Copenhagen: Nordic Council of Ministers, 37–41.
- Zimmer, M. A., et al., 2020. Zero or not? Causes and consequences of zero-flow stream gage readings. WIREs Water, 7 (3), e1436. doi:https://doi.org/10.1002/wat2.1436