
 ?Mathematical formulae have been encoded as MathML and are displayed in this HTML version using MathJax in order to improve their display. Uncheck the box to turn MathJax off. This feature requires Javascript. Click on a formula to zoom.
ABSTRACT
The intensity and frequency of extreme precipitation events are of great concern for water resources over the Indian Himalayas, where climate change is rapidly progressive. The long-term trends of extreme precipitation events have been examined during the winter season (November to April; 1996–2016) using the data of 10 observatories maintained by the Snow and Avalanche Study Establishment (SASE) over the Northwest Himalaya (NWH) region. The extreme events are categorized into seven indices, which are 90th and 95th percentiles, rainy days, and maximum 1-d, 3-d, 5-d and total accumulated precipitation. The analysis shows increasing trends for all seven indices for the peak month of February for all Himalayan ranges and altitudes. The rainy days are significantly increased at a 95% confidence level in the Pir-Panjal Range. The teleconnection study reveals that the negative correlation between the North Atlantic Oscillation and winter precipitation extremes is critical for the inter-monthly precipitation behaviours over the NWH.
Editor S. Archfield Associate Editor K. Ryberg
1 Introduction
The Intergovernmental Panel on Climate Change (IPCC) report Changes in Climate Extremes and their Impact on the Natural Physical Environment predicts that in the 21st century, extreme precipitation events will increase over many areas of the globe, mainly at high latitudes, in tropical regions, and in the northern mid-latitudes (Seneviratne et al. Citation2012). The Himalayan region is associated with sparse representation of meteorological data (Sharma et al. Citation2016), and better spatial and temporal coverage are needed to understand the effects of climate change in the region. Additionally, the presence of glaciers in this region is a matter of deep concern because glaciers have a significant impact on regional water and food security (Kohler and Maselli Citation2009, Romshoo et al. Citation2015, Citation2017). Due to the complex nature of the mountainous regions of the Indian Himalayas, very limited studies have been carried out to analyse its weather systems, like western disturbances (WDs) and monsoon circulations, in the past (Pisharoty and Desai Citation1956, Rao and Srinivasan Citation1969, Dhar et al. Citation1984, Dimri Citation2006, Puranik and Karekar Citation2009). WDs, while passing over the Western Himalayas (WH), form a short-lived mesoscale cloud structure underneath the cirrus canopy, which causes significant precipitation over the same region (Mohanty et al. Citation1999, Dimri Citation2004, Puranik and Karekar Citation2009).
The WH primarily comprises three prominent climatic zones; i.e. a lower Himalayan zone is composed of the Pir Panjal range, which receives most of its precipitation in the form of wet snow (Dimri Citation2004). The middle climatic zone consists of the Great Himalayan range; it records the lowest minimum temperature and receives a lesser amount of snow (Negi et al. Citation2016). The third and final upper climatic zone comprises the Zanskar, Ladhak and Karakoram ranges, which receive the least precipitation, with very low density; the temperature during winter remains well below freezing and hence the snow takes much longer to settle in this region (Negi et al. Citation2016).
Precipitation over the WH region occurs mainly during winter (December–March: DJFM) (Kumar et al. Citation2015) and WDs are the main source of the enormous amount of precipitation over northern India (Lang and Barros Citation2004, Dimri and Mohanty Citation2009, Shekhar et al. Citation2017a), which is important for the overall ecology and socio-economic balance. Recent studies reported a frequent increase of extreme temperature and precipitation events over the higher altitudes of the WH (Bhutiyani et al. Citation2007, Citation2010, Shekhar et al. Citation2010, Citation2017b, Malik et al. Citation2016). Shekhar et al. (Citation2017a, Citation2017b) analysed different categories of extreme precipitation events over the WH during winter; they found that heavy precipitation events (>70 mm) significantly increased over the Pir-Panjal range and that the duration of dry spells has also increased over the WH region. Zhan et al. (Citation2017) observed that the maximum rainy days (Rx1d, Rx3d, and Rx5d) significantly increased over the Hindu-Kush Himalayan region during 1961–2012. Subba et al. (Citation2019) reported that the maximum precipitation (Rx1d and Rx5d) events decreased during 1997–2016 over the Eastern Himalayas (Central Himalaya). Kamil et al. (Citation2019) showed an increase, significant at the 95% level, in the correlation between the storm frequency and precipitation over Western Himalaya–Karakoram–Hindukush (WHKH). A study by Zaz et al. (Citation2019) revealed that winter temperature has increased significantly at all stations, and, conversely, that winter precipitation has decreased over Jammu and Kashmir region, India. Almazroui et al. (Citation2020) reported that the winter precipitation over Northwestern Himalaya (NWH) is projected to increase in the future.
Devi et al. (Citation2020) attempted to find the relationship between the North Atlantic Oscillation (NAO) and winter precipitation, and noted an inverse correlation over the WH. Various global parameters, such as sea surface temperature (SST), El Niño, outgoing longwave radiation (OLR) and NAO, have been used by researchers to study teleconnections with the winter precipitation mechanisms over WH (Shreshtha et al. Citation2000, Asnani Citation2005, Yadav et al. Citation2007, Citation2012, Wang et al. Citation2011). Hurrell et al. (Citation2003) conducted a study outside of the WH and reported that stronger westerlies are mainly associated with the positive phase of the NAO over Western Europe.
Such significant changes in the spatial and temporal distributions of extreme precipitation events over the WH make the region a focus area to understand atmospheric processes from the perspective of planning, policy construction, and global warming. This study is the first of its kind to analyse index trends of precipitation with respect to range and altitude in the NWH region. The main objective of this study is to determine the teleconnection or link between global features, i.e. the NAO index, and the precipitation indices in the area selected for the study. The article is organized as follows: the data and methodology are presented in Section 2. Results and discussion are given in Section 3, and the conclusion is presented in Section 4.
2 Data and methodology
2.1 Data
The present study focuses on the 10 well-maintained observatories of the Snow and Avalanche Study Establishment (SASE), India, representing the NWH, as shown in . Daily raingauge precipitation data from 1995–96 to 2015–16 (21 years) recorded by SASE are used to represent the whole NWH. The study of seven extreme precipitation indices was carried out for the winter period (November to April) and for the seasonal precipitation (NDJFMA) for 21 years of data. The definition of the winter season (November–April) follows Shekhar et al. (Citation2010). Seasonal precipitation depicts the cumulative amount of the monthly precipitation values. As the Himalayas are essentially affected by winter precipitation, the present study was carried out for a similar period.
Figure 1. Geographical location of 10 stations (numbered S1 to S10) over different ranges and altitudes in meters used in this study (note: the background does not depict the political boundary)
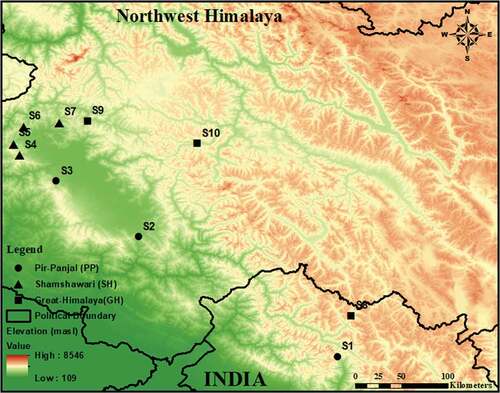
Before proceeding with the analysis of the precipitation indices, a quality check of the dataset was carried out utilizing the RClimDex toolkit. Many researchers use RCimDex to analyse indices (e.g. Almazroui Citation2020a, Citation2020b). The quality check assists in identifying the outliers and negative values in the precipitation data. The missing values in the daily precipitation data are filled using a quantile mapping approach (QM) (Devi et al. Citation2019). Empirical QM is useful for bias correction because it maps quantile with quantile and it is distribution-free. The study area has been categorized into three ranges (i.e. Pir-Panjal: PP, Shamshawari: SW, and Great Himalaya: GH) and three altitudes (lower altitude: 2400–2800 m, middle altitude: 2800–3200 m, and higher altitude: 3200–3800 m) (Shekhar et al. Citation2017b). Along with the trend for the whole NWH, the analysis of indices was also carried out over the three ranges and three altitudes.
The required North Atlantic Oscillation Index (NAOI) data used for the present study were downloaded from the site http://www.cpc.ncep.noaa.gov and further details are given by Hurrell and Deser (Citation2009). NAOI is the difference in normalized sea level pressure between Lisbon (Portugal) and Stykkisholmur/Reykjavik (Iceland). NAOI controls the strength and direction of westerly winds across the North Atlantic. Winter precipitation over NWH is strictly linked with WDs that originate from the Mediterranean and the Caspian Sea or the Atlantic (Krishnan et al. Citation2019). Two previous studies, David and Fowler (Citation2004) and Bhutiyani et al. (Citation2010), found a connection between winter precipitation of NWH and seasonal (September–November: SON) NAOI. Hence, the current study used only one parameter – NAOI (SON) – and 21 years of data to find the relationship with the studied indices.
2.2 Methodology
The value of a parameter in a specific range/altitude over NWH is calculated by taking a simple average of the parameters of the stations falling under the same range/altitude. Several precipitation indices have been defined by experts, such as the Standard Precipitation Index (SPI) and Actual Precipitation Index (API) (Şen and Almazroui Citation2021). The extreme precipitation indices considered in the present study were defined and recommended by the Expert Team on Climate Change Detection, Monitoring and Indices (ETCCDMI), in association with the World Meteorological Organization (WMO) Commission for Climatology and the Research Programme on Climate Variability and Predictability (CLIVAR) (Karl et al. Citation1999, Peterson Citation2005). Seasonal indices are calculated using the average of each index. The extreme precipitation indices (R95p, R90p, RD, RX1d, RX3d, RX5d, and PRCPTOT) considered here are mainly the indicators of disasters that caused avalanches and landslides. Definitions of the indices are given in .
Table 1. Extreme precipitation indices (EPIs) and their definitions. Each index was computed for November–April and Seasonal. The base period used is 1995–1996 to 2015–2016. “Wet days” are days with daily rainfall ≥1 mm
2.2.1 Mann-Kendall test
Mann-Kendall is the most widely used and robust non-parametric method for trend analysis. A Microsoft Excel template called MAKESENS, developed by the Finnish Meteorological Institute (Salmi et al. Citation2002), is used in the present study to estimate the significance of trends for time series indices. This test is useful because it does not require any particular distributional assumptions. The relationship between NAOI and the indices was found by calculating Pearson’s correlation coefficient and the year-to-year correspondence. For the year-to-year correspondence, the indices are normalized using Equation (1).
where and s represent the mean and standard deviation of the respective indices.
3 Results and discussion
To understand the changes in precipitation over complex mountain regions, studying extreme events is required. The amount and intensity of precipitation can be used to reconstruct the overall behaviour of the climate system. For the trend analysis of precipitation indices, both parametric (i.e. linear) and non-parametric (i.e. Mann-Kendall) methods were used, at 0.1, 0.05, 0.01, and 0.001 levels of significance (Kothyari and Singh Citation1996).
3.1 Inter-monthly and seasonal winter precipitation indices
presents a comparative study of the precipitation indices (R90p, R95p, RD, RX1d, RX3d, and RX5d and PRCPTOT) for NWH during November–April and seasonally. The pattern of all seven indices for the winter months is the same, i.e. increasing from November to February and slowly decreasing thereafter, in March and April. We also noted that February is the peak month in the winter precipitation for NWH. The monthly average R90p recorded during the study period from November to April and seasonally was found to be 4.3, 9.0, 19.8, 28.7, 22.9, 17.2, and 28.8 mm, respectively, as shown in ). The maximum amount of precipitation was observed in February and the minimum in November. Apart from this, a large variance was observed in January. The 95th percentile pattern followed that of the 90th percentile, but January’s data distribution is very small (). The average R95p recorded for November to April and seasonally was found to be 10.7, 17.6, 31.8, 43.6, 34.5, 25.8, and 46.4 mm, respectively.
Figure 2. Inter-monthly and seasonal variation of seven precipitation indices for Northwest Himalaya
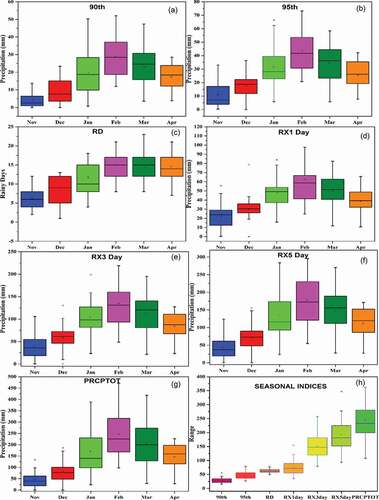
The number of rainy days is high in February, March, and April and low in November (). Interestingly, after peak winter the rainy days increase, which indicates March and April precipitation is critical for snow cover and glacier dynamics over high mountains. The consecutive 1-d, 3-d, and 5-d maximum variance of precipitation was observed in February, whereas the minimum was observed in December (). The total precipitation (PRCPTOT) of winter is high in February and low in November (). In brief, the February and March precipitation is high in all events in terms of amount and intensity. We also noted that April precipitation was slightly increased in all indices and included the same number of rainy days as in February and March, which are the peak winter months.
) shows the seasonal distribution of the seven indices for the whole NWH during the winter. The minimum variation was observed on rainy days, as compared to the other indices. Negi et al. (Citation2018) found the variance of precipitation at three altitudes – Lower Himalayan (LH), Greater Himalayan (GH), and Karakoram Himalayan (KH) – over NWH to have a range of 431–804 mm.
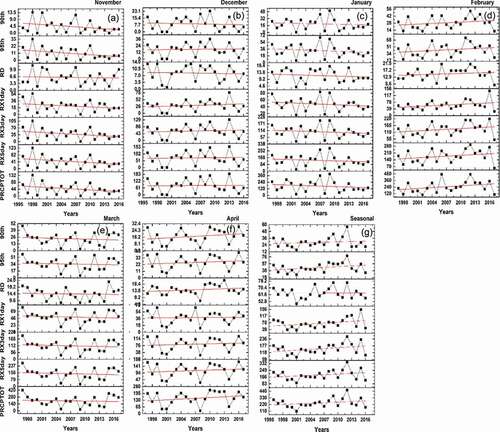
The monthly and seasonal linear time series analysis and Mann-Kendall statistics are shown in –g) and , respectively, for the seven precipitation indices over NWH. A statistically decreasing trend was observed in November for all indices (), but it is not significant. Similar trends were observed for December and January, except for RX1d in December which shows positive trends. The peak winter month (i.e. February) shows statistically increasing trends for all indices, and it is also significant for PRCPTOT at the 90% confidence level by the Mann-Kendall trend analysis, as shown in ) and . Slightly decreasing and increasing trends were observed in March and April, respectively, but these were not significant (as shown in ) and (f)). All the indices show increasing seasonal trends (except for RD which shows a decreasing but not significant trend) over the whole NWH. The increasing trends might be due to an influence of the peak winter month (February) on the seasonal trend (). More details of the trend analysis of all months and seasons can be found in .
Table 2. Mann-Kendall trends statistics for winter months (November to April) and seasonally over the Northwest Himalaya
Figure 3. Time series of inter-monthly and seasonal variations of seven precipitation indices over Northwest Himalaya
3.2 Study of indices via ranges and altitude wise over NWH
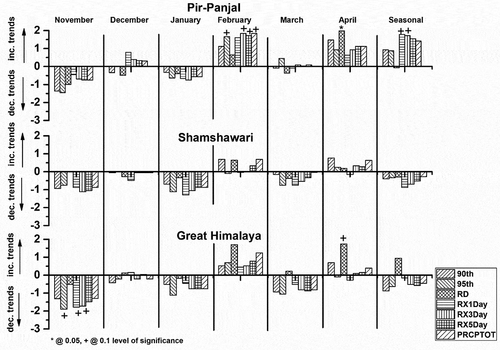
The trend analysis of the seven precipitation indices for the three ranges of NWH (i.e. PP, SH, and GH) during the winter months and seasonally is shown in . November and January show decreasing trends for all seven precipitation indices in the PP range, but these are not significant. Mixed trends of indices are found for December. February, the peak winter month, shows increasing trends for all seven indices in the PP range, and it is significant for the 95th, RX3d, RX5d, and PRCPTOT indices at a 90% confidence level. No significant trends were observed in March. In April, significantly increasing trends were observed for RD at a 95% confidence level. Increasing trends are shown for all indices seasonally in PP, which is significant for RX1d and RX3d at a 95% confidence level. Similar results were observed for extreme precipitation events over the PP range by Shekhar et al. (Citation2017b). There are, however, mixed and non-significant trends in the SW range. GH shows decreasing trends for November, which are significant for the 95th, RX1d, and RX3d indices at a 90% confidence level. Mixed and decreasing trends were observed for December and January, respectively. Increasing trends were observed in February for all indices. As in the PP range, RD also significantly increases during April in the GH range. However, no significant trends were observed for seasonal precipitation in the GH range, a result supported by Shekhar et al. (Citation2017b).
Figure 4. Range-wise trend analysis of seven precipitation indices
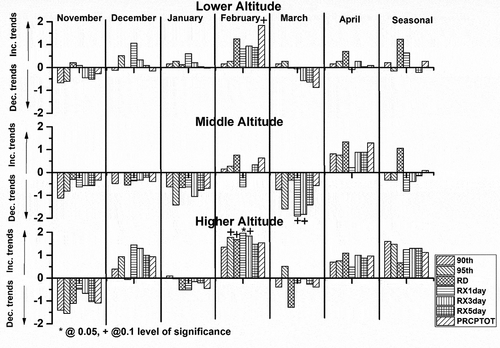
Study of the seven indices using three altitudes [lower (2400–2800 m), middle (2800–3200 m), and higher (3200–3800 m)] of NWH was carried out for the winter months and seasonally and is shown in . Decreasing trends were observed at all three altitudes for all indices during November, and were significant for the higher altitude at a 90% confidence level. For December, lower and higher altitudes showed no significantly increased trends, but the middle altitude displayed increasing trends. The lower altitude showed increasing trends for January, whereas decreasing trends were observed for middle and higher altitudes. Similar to the range results, all three altitudes showed increasing trends for all indices, and these were significant at the 0.05 and 0.1 levels for February. Lower and higher altitudes showed mixed trends for all indices, whereas the middle altitude has significant decreasing trends for RX1d and RX3d, in March. A positive trend was observed for all three altitudes in April, and in the middle altitudes, decreasing trends were found from November to March. The increasing trend in April for the middle altitude might be the reason for increasing summer duration and temperature (Kohler and Maselli Citation2009, Immerzeel et al. Citation2010, Romshoo et al. Citation2015, Citation2017). Mixed seasonal trends were observed for lower and middle altitudes; however, increasing seasonal trends were observed for higher altitudes.
Figure 5. Altitude-wise trend analysis of seven precipitation indices
3.3 Teleconnection between NAOI and precipitation indices
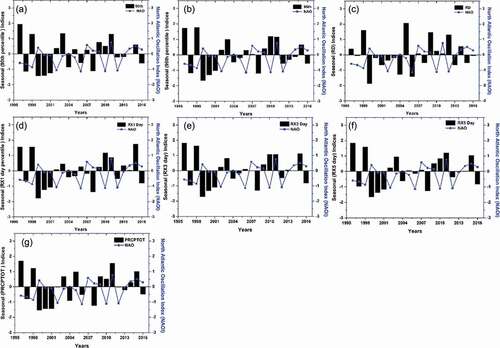
The present study examined the teleconnections between winter and seasonal precipitation indices (R95p, R90p, RD, RX1d, RX3d, RX5d and PRCPTOT) with an average of NAOI (SON) using the correlation coefficient (CC), as shown in . During November, the precipitation indices show an inverse relationship with NAOI at the 95% and 99% confidence levels. We also detected a significantly decreasing effect of NAOI during pre-winter. Mixed CC was observed between precipitation indices and NAOI in December, although this was not significant. An inverse relationship was observed for January, February, April, and seasonal precipitation between the precipitation indices and NAOI.
Table 3. Correlation Coefficient (CC) between the North Atlantic Oscillation Index anomalies and the precipitation indices anomalies over Northwest Himalaya
A reduction in Arctic sea ice increases the negative phase of NAO (Nakamura et al. Citation2015). As the Mediterranean region is highly influenced by the negative phase of NAO, this weakens the WDs which are the major source of winter storms over the Himalayas (Syed et al. Citation2006). This supports the results of the present study, i.e. that NAO during SON has a negative relationship with precipitation. The influence of the mid-latitude circumglobal wave train (CGT) on winter precipitation over the Arabian Peninsula is distinct from that of the NAO (Saeed and Almazroui Citation2019). However, indices over NWH for March show a positive relationship with NAOI, which might be the reason for the shifting of the winter over the NWH. Apart from the CC, the year-to-year correspondence of the NAOI with seasonal precipitation index anomalies (R95p, R90p, RD, RX1d, RX3d, RX5d and PRCPTOT) over NWH is shown in –g). As the figure shows, NAOI and the indices for seasonal precipitation have an inverse relationship.
Figure 6. Year-to-year correspondence of the North Atlantic Oscillation Index with seasonal precipitation index anomalies over Northwest Himalaya
4 Conclusion
In this study, extreme precipitation events were analysed using seven precipitation indices (R90p, R95p, RD, RX1d, RX3d, RX5d, and PRCPTOT) over the NWH. The relationship between these precipitation indices and NAOI was examined. The results are as follows:
The pattern of all seven indices during the winter months shows a similar trend, i.e. increasing from November to February and decreasing in March and April.
In the Himalayan ranges, the lower range (i.e. Pir-Panjal) shows significant increasing trends in all indices for February, April, and seasonal precipitation.
The lower and higher altitudes show increasing trends for all indices in February.
A significant inverse relationship was observed between the seven precipitation indices and NAO for November, and a positive relationship was observed for March.
Acknowledgements
The authors are thankful to the Director of SASE (DRDO) for providing the necessary support and guidance to complete this work. Thanks to the technical staff of SASE for the collection of data in extreme conditions over the rugged high mountainous region.
Disclosure statement
No potential conflict of interest was reported by the authors.
References
- Almazroui, M., 2020a. Rainfall trends and extremes in saudi Arabia in recent decades. Atmosphere, 11 (9), 964. doi:https://doi.org/10.3390/atmos11090964
- Almazroui, M., 2020b. Changes in temperature trends and extremes over Saudi Arabia for the period 1978–2019. Advances in Meteorology, 2020, 1–21. doi:https://doi.org/10.1155/2020/8828421
- Almazroui, M., et al., 2020. Projections of precipitation and temperature over the South Asian countries in CMIP6. Earth Systems and Environment, 4, 297–320. doi:https://doi.org/10.1007/s41748-020-00157-7
- Asnani, G.C., 2005. Tropical meteorology. Pune, India: G.C.Asnani.
- Bhutiyani, M.R., Kale, V.S., and Pawar, N.J., 2007. Long-term trends in maximum, minimum and mean annual air temperatures across the North-Western Himalaya during the 20th Century. Climatic Change, 85, 159–177. doi:https://doi.org/10.1007/s10584-006-9196-1
- Bhutiyani, M.R., Kale, V.S., and Pawar, N.J., 2010. Climate change and the precipitation variations in the northwestern Himalaya: 1866–2006. International Journal of Climatology, 30, 535–548. doi:https://doi.org/10.1002/joc.1920
- David, R.A. and Fowler, H.J., 2004. Spatial and temporal variations in precipitation in upper Indus basin, global tele-connections and hydrological implications. Hydrology and Earth System Sciences, 8, 47–61. doi:https://doi.org/10.5194/hess-8-47-2004
- Devi, U., et al., 2020. Statistical method of forecasting of seasonal precipitation over the Northwest Himalayas: North Atlantic oscillation as precursor. Pure and Applied Geophysics, 177 (7), 3501–3511. doi:https://doi.org/10.1007/s00024-019-02409-8
- Devi, U., et al., 2019. Methodological application of quantile mapping to generate precipitation data over Northwest Himalaya. International Journal of Climatology, 39 (7), 3160–3170. doi:https://doi.org/10.1002/joc.6008
- Dhar, O.N., Soman, M.K., and Mulye, S.S., 1984. Rainfall over the southern slopes of the Himalayas and the adjoining plains during “break in the monsoon”. Journal of Climatology, 4 (6), 671–676. doi:https://doi.org/10.1002/joc.3370040610
- Dimri, A.P., 2004. Impact of horizontal model resolution and orography on the simulation of a Western Disturbance and its associated precipitation. Meteorological Applications, 11, 115–127. doi:https://doi.org/10.1017/S1350482704001227
- Dimri, A.P., 2006. Surface and upper air fields during extreme winter precipitation over Western Himalayas. Pure and Applied Geophysics, 163 (8), 1679–1698. doi:https://doi.org/10.1007/s00024-006-0092-4
- Dimri, A.P. and Mohanty, U.C., 2009. Simulation of mesoscale features associated with intense Western Disturbances over western Himalayas. Meteorological Applications, 16, 289–308. doi:https://doi.org/10.1002/met.117
- Hurrell, J.W. and Deser, C., 2009. North Atlantic climate variability: the role of the North Atlantic Oscillation. Journal of Marine System, 78, 28–41. doi:https://doi.org/10.1016/j.jmarsys.2008.11.026
- Hurrell, J.W., et al., 2003. An overview of the North Atlantic Oscillation. The North Atlantic Oscillation—Climatic significance and environmental impact. Geophysical Monograph, 134, 1–35.
- Immerzeel, W., Van Beek, L.P.H., and Bierkens, M.F.P., 2010. Climate change will affect the Asian water towers. Science, 328, 1382–1385. doi:https://doi.org/10.1126/science.1183188
- Kamil, S., et al., 2019. Long-term ENSO relationship to precipitation and storm frequency over western Himalaya–Karakoram–Hindukush region during the winter season. Climate Dynamics, 53 (9–10), 5265–5278. doi:https://doi.org/10.1007/s00382-019-04859-1
- Karl, T.R., Nicholls, N., and Ghazi, A., 1999. CLIVAR/GCOS/WMO workshop on indices and indicators for climate extremes: workshop summary. Climatic Change, 42, 3–7. doi:https://doi.org/10.1023/A:1005491526870
- Kohler, T. and Maselli, D., 2009. Mountains and climate change from understanding to action. Berne: Swiss Agency for Development and Cooperation.
- Kothyari, U.C. and Singh, V.P., 1996. Rainfall and temperature trends in India. Hydrological Processes, 10, 357–372. doi:https://doi.org/10.1002/(SICI)1099-1085(199603)10:3<357::AID-HYP305>3.0.CO;2-Y
- Krishnan, R., et al., 2019. Non-monsoonal precipitation response over the Western Himalayas to climate change. Climate Dynamics, 52 (7–8), 207–222.
- Kumar, N., et al., 2015. Winter frequency of western disturbances and precipitation indices over Himachal Pradesh, India: 1977–2007. Atmósfera, 28, 63–70. doi:https://doi.org/10.20937/ATM.2015.28.01.06
- Lang, T.J. and Barros, A.P., 2004. Winter storms in central Himalayas. Journal of the Meteorological Society of Japan, 82 (3), 829–844. doi:https://doi.org/10.2151/jmsj.2004.829
- Malik, N., Bookhagen, B., and Mucha, P.J., 2016. Spatiotemporal patterns and trends of Indian monsoonal rainfall extremes. Geophysical Research Letters, 43 (4), 1710–1717. doi:https://doi.org/10.1002/2016GL067841
- Mohanty, U.C., et al., 1999. A study on certain dynamic and thermodynamic aspects associated with western disturbances over north-west Himalaya. In: S.K. DashJ. Bahadur, eds. The himalayan environment. New Delhi, India: New Age International Pvt. Ltd, 113–122.
- Nakamura, T., et al., 2015. A negative phase shift of the winter AO/NAO due to the recent Arctic sea-ice reduction in late autumn. Journal of Geophysical Research: Atmospheres, 120 (8), 3209–3227.
- Negi, H.S., et al., 2016. Observed spatio-temporal changes of winter snow albedo over the north-west Himalaya. International Journal of Climatology, 37 (5), 2304–2317. doi:https://doi.org/10.1002/joc.4846
- Negi, H.S., et al., 2018. Recent wintertime climate variability over the North West Himalayan cryosphere. Current Science, 114 (4), 760–770. doi:https://doi.org/10.18520/cs/v114/i04/760-770
- Peterson, T.C., 2005. Climate change indices. WMO Bulletin, 54 (2), 83–86.
- Pisharoty, P. and Desai, B.N., 1956. Western disturbances and Indian weather. Indian Journal of Meteorology and Geophysics, 7, 333–338.
- Puranik, D.M. and Karekar, R.N., 2009. Western disturbances seen with AMSU-B and infrared sensors. Journal of Earth System Science, 118 (1), 27–39. doi:https://doi.org/10.1007/s12040-009-0003-z
- Rao, Y.P. and Srinivasan, V., 1969. Discussion of typical synoptic weather situation: winter Western Disturbances and their associated features. In: The Deputy Director General of Observatories of IMD, ed. Forecasting manual part III. New Delhi, India: Indian Meteorological Department, 3–5.
- Romshoo, S.A., et al., 2017. Climatic, geomorphicand anthropogenic drivers of the 2014 extreme flooding in the Jhelum basin of Kashmir, India. Geomatics, Natural Hazards and Risk, 9, 224–248. doi:https://doi.org/10.1080/19475705.2017.1417332
- Romshoo, S.A., et al., 2015. Implications of shrinking cryosphere under changing climate on the stream flows of the Upper Indus Basin. Arctic Antarctic and Alpine Research, 47, 627–644. doi:https://doi.org/10.1657/AAAR0014-088
- Saeed, S. and Almazroui, M., 2019. Impacts of mid-latitude circulation on winter precipitation over the Arabian Peninsula. Climate Dynamics, 53, 5253–5264. doi:https://doi.org/10.1007/s00382-019-04862-6
- Salmi, T., et al., 2002. Detecting trends of annual values of atmospheric pollutants by the Mann–Kendall test and Sen’s slope estimates: the Excel template application, Helsinki: Finnish Meteorological Institute, Report.
- Şen, Z. and Almazroui, M., 2021. Actual Precipitation Index (API) for drought classification. Earth Systems and Environment, 5, 59–70. doi:https://doi.org/10.1007/s41748-021-00201-0
- Seneviratne, S.I., Nicholls, N.D., and Easterling, C.M., 2012. Changes in climate extremes and their impacts on the natural physical environment. In: C.B. Field, et al, eds. Managing the risks of extreme events and disasters to advance climate change adaptation. A Special Report of Working Groups I and II of the Intergovernmental Panel on Climate Change (IPCC). Cambridge, UK, and New York, NY, USA: Cambridge University Press, 109–230.
- Sharma, E., et al., 2016. The Hindu Kush Himalayan monitoring and assessment programme: action to sustain a global asset. Mountain Research and Development, 36 (2), 236–239. doi:https://doi.org/10.1659/MRD-JOURNAL-D-16-00061.1
- Shekhar, et al., 2017a. Winter precipitation climatology over Western Himalaya: altitude and range wise study. Journal of Indian Geophysical Union, 21, 148–152.
- Shekhar, M.S., et al., 2010. Climate-change studies in the western Himalaya. Annals of Glaciology, 51, 105–112. doi:https://doi.org/10.3189/172756410791386508
- Shekhar, M.S., et al., 2017b. Analysis of trends in extreme precipitation events over Western Himalaya Region: intensity and duration wise study. Journal of Ind Geophys Union, 21 (3), 225–231.
- Shreshtha, A.B., et al., 2000. Precipitation fluctuations in the Nepal Himalaya and its vicinity and relationship with some large-scale climatological parameters. International Journal of Climatology, 20, 317–327. doi:https://doi.org/10.1002/(SICI)1097-0088(20000315)20:3<317::AID-JOC476>3.0.CO;2-G
- Subba, S., Ma, Y., and Ma, W., 2019. Spatial and temporal analysis of precipitation extremities of Eastern Nepal in the last two decades (1997–2016). Journal of Geophysical Research, Atmospheres, 124, 7523–7539. doi:https://doi.org/10.1029/2019JD030639
- Syed, F.S., et al., 2006. Effect of remote forcing’s on the winter precipitation of central southwest Asia part 1: observations. Theoretical and Applied Climatology, 86, 147–160. doi:https://doi.org/10.1007/s00704-005-0217-1
- Wang, X., et al., 2011. Teleconnected influence of North Atlantic sea surface temperature on the El Nin˜o onset. Climate Dynamics, 37, 663–676. doi:https://doi.org/10.1007/s00382-010-0833-z
- Yadav, R.K., Rupa Kumar, K., and Rajeevan, M., 2007. Role of Indian Ocean sea surface temperatures in modulating northwest Indian winter precipitation variability. Theoretical and Applied Climatology, 87 (1–4), 73–83. doi:https://doi.org/10.1007/s00704-005-0221-5
- Yadav, R.K., Rupa Kumar, K., and Rajeevan, M., 2012. Characteristic features of winter precipitation and its variability over northwest India. Journal of Earth System Science, 121 (3), 611–623. doi:https://doi.org/10.1007/s12040-012-0184-8
- Zaz, S.N., et al., 2019. Analyses of temperature and precipitation in the Indian Jammu and Kashmir region for the 1980–2016 period: implications for remote influence and extreme events. Atmospheric Chemistry and Physics, 19, 15–37. doi:https://doi.org/10.5194/acp-19-15-2019
- Zhan, Y.J., et al., 2017. Change in extreme precipitation events over the Hindu Kush Himalayan region during 1961–2012. Advances in Climate Change Research, 8 (3), 166–175. doi:https://doi.org/10.1016/j.accre.2017.08.002