
 ?Mathematical formulae have been encoded as MathML and are displayed in this HTML version using MathJax in order to improve their display. Uncheck the box to turn MathJax off. This feature requires Javascript. Click on a formula to zoom.
ABSTRACT
Heavy precipitation with unplanned land use can alter the catchment response time; thus, natural processes of floods can be affected. As a result, floods from multiple sources can be observed concurrently or consecutively at the same location. However, the location-dependent interactions between floods and the consequences of flood combinations have not been studied sufficiently. This research examined the interactions and the consequences of combined floods occurring on the settlements on floodplains along urban streams in an ungauged and urbanized catchment. The flood extents, merging from the river overflow and the rainfall-induced runoff, were simulated directly for Lower Wortley, Leeds, UK. The study demonstrates that an assessment of the floods occurring from multiple sources at the same location is necessary to improve flood risk management approaches, because the merger floods could significantly increase the impact of any single flood, and so the flood defences become deficient.
Editor A. Castellarin Associate Editor A. Petroselli
1 Introduction
Fluvial flooding can occur because of tidal backwater and upstream discharges, while pluvial flooding can occur because of heavy local precipitation. Also, a fluvial flood can have greater catchment response time than a pluvial flood, so the effects of a local pluvial flood can be observed sooner than the effects of fluvial floods (Chen et al. Citation2010, Breinl et al. Citation2017). In addition, the effects of the pluvial flood are likely to cause relatively minor damage, but the pluvial flood can be observed more frequently than a fluvial flood (Van Ootegem et al. Citation2015). Moreover, fluvial floods can be observed in the cities located around a tributary (Burton et al. Citation2010). Pluvial floods can be observed in cities that have undergone rapid development, with increasing populations, and with inefficient drainage systems as a consequence of prolonged and intensive rainfall events (Falconer et al. Citation2008, Citation2009, Cabinet Office Citation2008, Morris et al. Citation2009, Kellagher et al. Citation2010, Houston et al. Citation2011, Falconer and Smyth Citation2012, Jha et al. Citation2012, Palla et al. Citation2018). Fluvial floods and pluvial floods have been evaluated separately because of the differences in their processes.
However, the magnitudes and frequency of flood events have been predicted to increase because of climate change and the development of urban areas (Merz et al. Citation2010, Yin et al. Citation2015, Szewrański et al. Citation2018). Changes in the rainfall pattern can cause an increase in precipitation severity (Waters et al. Citation2003, Marsh et al. Citation2016). Furthermore, changing land use from rural to urban can increase the surface overflow magnitude (Shi et al. Citation2007), thus decreasing the catchment response time (Weng Citation2001, Cheng and Wang Citation2002, Shi et al. Citation2007, Abdullah Citation2012). Therefore, some changes in the magnitude, length, and processes of the floods can be expected (Ashley et al. Citation2005). So, a rainfall event with high intensity and long duration can cause a combination of pluvial and fluvial floods simultaneously or consecutively in the same location, such as flood plains in urban regions located next to rivers (Falconer et al. Citation2008, Renaud et al. Citation2013).
Combinations of pluvial and fluvial floods have affected the United Kingdom over the past decade. Falconer et al. (Citation2009) mentioned that pluvial flooding occurred together with fluvial flooding in Carlisle in January 2005. Falconer and Smyth (Citation2012) reported that relatively long-duration frontal events, such as the November 2002 and October 2011 events in Ireland, caused a combination of pluvial and fluvial floods and floods from the sewer systems. Lastly, Thorne (Citation2014) reported that rainfall-induced surface runoff with a local river overflow was observed from 23 to 27 December 2013 from Dorset to Hampshire and at Surrey through Kent. Therefore, assessments of the inter-relationships of the floods can improve the flood resistance approaches for these places.
Additionally, combinations of pluvial and fluvial floods can be seen in the floodplains of urban basins. Heavy rain and impervious surfaces can generate a surface runoff, increasing the upstream discharge and making it the source of the river channel overflow in the floodplains (Evans et al. Citation2008, WMO and GWP Citation2008, Du et al. Citation2015). Therefore, the river channel overflow can be observed in the lower locations of a downstream area (WMO and GWP Citation2008, Hammond et al. Citation2015), which can be the floodplains next to an urban stream. Similarly, a heavy rainfall event on saturated soils and impervious surfaces may lead to an excessive flow load in a drainage system. In such a case, the urban drainage system cannot manage the runoff, and pluvial floods can occur in urbanized floodplains along the stream (Evans Citation2004, Cabinet Office Citation2008, Chen et al. Citation2010, Apel et al. Citation2016). Moreover, rapid population growth and valuable investments can be seen in floodplains (WMO and GWP Citation2008). Consequently, the floodplains along an urban stream may present a potential risk of both fluvial and pluvial floods. Chen et al. (Citation2010) and Apel et al. (Citation2016) reported that combined floods could have more profound consequences than each type of flood alone. Muthusamy et al. (Citation2019) added that the combined impacts of pluvial and fluvial flooding could be considered to improve flood risk assessment. These combinations can generate greater water depths in terms of the extent of flooding than individual floods do. Muthusamy et al. (Citation2019) calculated the household damage of the flooding in Cockermouth (Cumbria, UK) as £10 million from the fluvial event alone in 2015–2016. However, after an investigation, it was calculated that approximately £3.6 million of the damage was caused by the pluvial flooding.
Therefore, besides the effects of climate change and urbanization, the effects of combined flood events should be considered to improve urban flood risk management schemes (Cheng and Wang Citation2002, Re Citation2005, Dawson et al. Citation2008, Evans et al. Citation2008, WMO and GWP Citation2008, Ten Veldhuis Citation2010, Singh and Singh Citation2011). This study specifically focuses on the combinations of fluvial floods in downstream floodplains by the urban stream and pluvial floods at the lower impermeable locations along the same downstream floodplains to establish a location-dependent relationship between the processes of fluvial and pluvial floods for ungauged catchments. Currently, there is limited research on the combined consequences of pluvial and fluvial flooding at the same location (Burton et al. Citation2010, Apel et al. Citation2016, Breinl et al. Citation2017). Some combination approaches to pluvial and fluvial flood events can be found in the literature. For instance, Chen et al. (Citation2010) entered rainfall events during river overtopping and breaching to analyse the combined events using the coupled SIPSON/UIM software. Then, Horritt (Citation2010) proposed the integrated model method and the map combination method. The fully integrated approach assesses the interdependency of the sources of flood events. The map combination approach compares the flood extents of the different floods directly. Later, Moncoulon et al. (Citation2014) combined independent probabilistic fluvial and pluvial event sets. Next, Breinl et al. (Citation2017) investigated the common days of the combined pluvial and fluvial flood events by developing a joint probabilistic modelling framework.
Furthermore, Apel et al. (Citation2016) examined the possibility of the coincidence of pluvial and fluvial flood events. The joint occurrence of the fluvial and pluvial flood events was determined using the same individual possibility. Later, Patra et al. (Citation2016) simulated both the flow in the drainage network and the local precipitation using the MIKE FLOOD package. The MIKE 11 hydrodynamic model was used to model the flow in the drain. MIKE 21 was used to model the overflow due to the drainage and the local rainfall on the floodplain. Next, Muthusamy et al. (Citation2019) estimated the flood extent and damage at the property level of the combined pluvial and fluvial flooding via combining hydrological modelling with a high-resolution Digital Elevation Model (DEM)-based two-dimensional (2D) model.
Lastly, Rizeei et al. (Citation2019) analysed the probability and hazards of the combined fluvial and pluvial flash flood inundations. They also used a hydraulic 2D high-resolution sub-grid model Hydrologic Engineering Centre River Analysis System to simulate fluvial flood probability and hazard, and used a Geographical Information System (GIS)-based random forest (RF) model and a particle swarm optimization (PSO) algorithm to model the pluvial flash flood probability and hazard.
In contrast, the research methodology of the present study consists of a hydrological model and a 1D-linked 2D hydrodynamic model. This study merged and captured the surface runoff due to precipitation and impervious surfaces, and river channel overflows due to upstream discharge, in one simulation. Thus, various river overflows and rainfall-induced surface runoffs were modelled together to directly monitor the combinations of flood events in the floodplains along an urban stream. The fluvial system of Lower Wortley Beck was connected to the Lower Wortley flood extent to capture both the river overflow and efficient rainfall. Thus, flood inundation maps were generated with the merged water depth scale and the flood extent. This study presents a method that can also be applied to an insufficient amount of gauged rain and flow data in a basin. The study confirms that the effects of combined fluvial and pluvial floods can multiply their individual effects.
A separate flood assessment may result in a misleading assessment in locations likely to experience combined flooding and can lead to insufficient flood resilience approaches in these locations. Therefore, the motivation of this study is a requirement of an assessment of the consequences of flooding associated with fluvial flooding combined with pluvial flooding. The utility of this research is that the results can be used to enrich the flood resilience tools to manage the risk of combined floods in the urbanized floodplains.
2 Study area
The research area was Lower Wortley, which is located in the southwest of Leeds, UK. This basin is ungauged and urbanized. The simulated area of Lower Wortley is approximately 15 km2, and the length of the simulated Lower Wortley Beck channel is approximately 3.5 km. Lower Wortley Beck has two main tributaries upstream. These are Farnley Beck and Farnley Wood Beck ().
Figure 1. Lower Wortley Beck, Leeds, UK
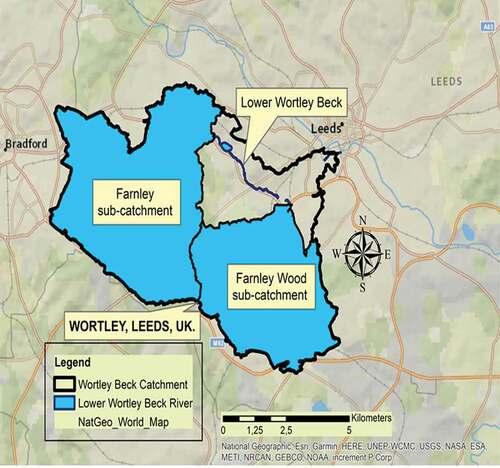
Flood Map for Planning (Rivers and Sea) of the Environment Agency reported that Lower Wortley Beck has an annual fluvial flood risk of at least 1 in 100 years (Environment Agency Citation2017). Many types of residences, buildings, and motorways can be found in this risky area.
The sources, pathways, and duration of flood events have until now been examined separately for a given location. However, the location of the research site can be the primary concern to observe the integrated pluvial and fluvial flood events. This research site is where fluvial flooding could occur due to the intense discharge from the upstream of Lower Wortley Beck. Pluvial flooding could also occur, due to the intense precipitation in the urbanized floodplains downstream of the Lower Wortley Beck, Leeds, UK ().
3 Methodology
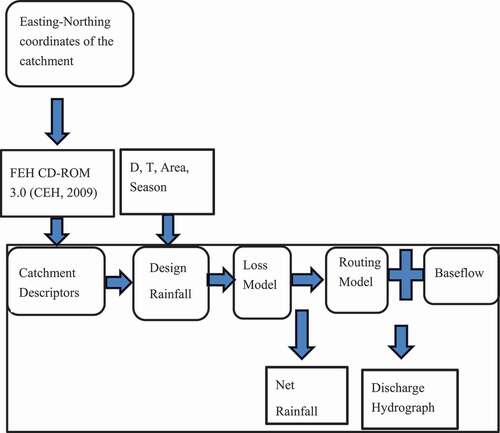
This research methodology consists of the following approaches to produce the merged flood extents with the maximum water depths. First of all, the net rainfall on Lower Wortley and the discharges from the Farnley Beck (FB) and Farnley Wood Beck (FWB) sub-catchments of Wortley Beck were computed. The measured rainfall and flow data were insufficient; therefore, the upstream discharges and the net rainfall were estimated using the Revitalized Flood Hydrograph (ReFH) rainfall–runoff model. The ReFH is mainly utilized for ungauged catchments by several organizations such as the Environment Agency (Kjeldsen et al. Citation2005, Kjeldsen Citation2007). The catchment descriptors (Houghton-Carr Citation1999, Kjeldsen Citation2007) were entered in the ReFH Boundary Unit (ReFHBDY), which is one of the units of the Flood Modeller Suite tool (). The catchment descriptors () were produced using FEH CD-ROM 3.0 (CEH Citation2009) by entering the east and north coordinates of the catchment.
Table 1. Catchment descriptors
Figure 2. The Flood Modeller Suite ReFH boundary (ReFHBDY) unit
3.1 Design of rainfall events
The gross rainfall was estimated by entering the catchment descriptors, storm duration, and return period in the ReFHBDY unit of the Flood Modeller Suite tool (). The storm duration was calculated using the catchment response time (Tp) and The standard average annual rainfall (1961-1990) (SAAR) (Houghton-Carr Citation1999, Kjeldsen Citation2007). The season of the storm profile was chosen as summer because the The extent of urban and suburban cover in 1990 (URBEXT1990) value was greater than 0.125 (Kjeldsen Citation2007).
3.2 Calculation of the urban extent (URBEXT) parameter
The URBEXT parameter was used to display the ratio of the pervious to impervious surfaces of the research area. URBEXT was estimated for 2016 using the equation of the urbanization expansion factor (UEF) (Bayliss Citation1999).
3.3 Calculation of net rainfall
The loss factor was applied to the gross rainfall and was estimated using the loss model based on the uniform probability distributed model (Moore Citation1985) to compute the net rainfall. The loss factor was entered as a percentage runoff value (70%) in the developed areas unit for the impervious surfaces (Kjeldsen Citation2007).
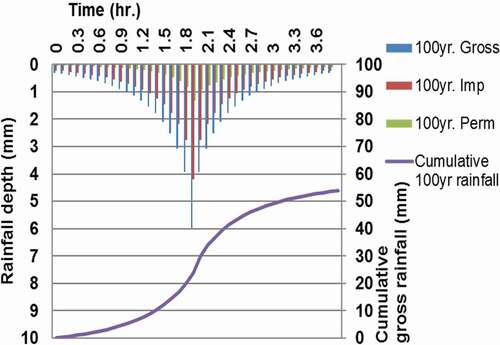
The loss factor was calculated using the maximum soil moisture capacity, the initial soil moisture content, and the initial soil moisture correction factor for the impervious surfaces (Kjeldsen Citation2007). Thus, the net rainfall was estimated for both impervious and pervious surfaces of the catchment () for the 1 in 100 years event.
Figure 3. Estimated hyetograph for the 1 in 100 years event (Sertyesilisik Citation2017)
3.4 Design of discharge hydrographs from sub-catchments
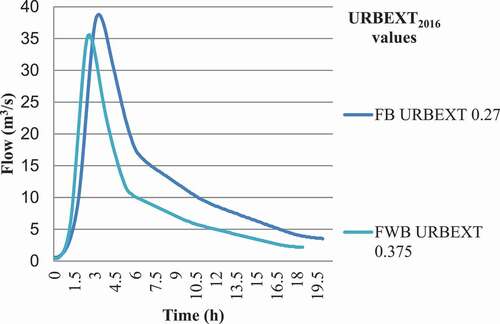
The total discharges from the sub-catchments into the river channel () were also computed using the ReFH rainfall–runoff model. The discharges were estimated for the 1 in 100 years event by entering the catchment descriptors in the ReFHBDY unit (). This calculation was based on the loss, routing, and baseflow models (Kjeldsen et al. Citation2005). The calculated net precipitation was then entered into the routing model. The routing model was used to produce the direct runoff via a unit hydrograph. Lastly, the baseflow was added as the subsurface flow with the direct runoff to calculate the total flow (Kjeldsen et al. Citation2005). The baseflow model consisted of the baseflow lag (h), baseflow recharge, and the initial baseflow (m3/s) parameters. These three parameters were computed via the catchment descriptors (Kjeldsen et al. Citation2005) in the ReFHBDY unit.
Figure 4. Discharges of Farnley Wood Beck (FWB) and Farnley Beck (FB) (Sertyesilisik Citation2017)
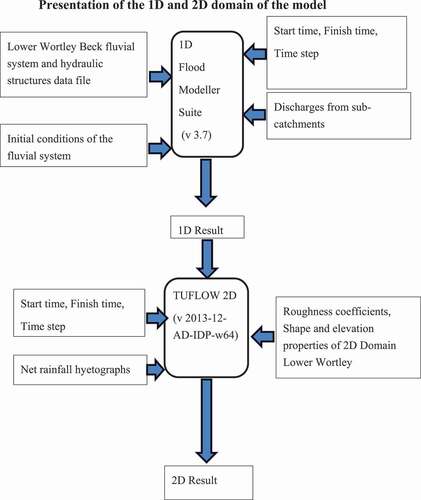
3.5 Presentation of the 1D and 2D domain of the model
The 1D hydraulic model of the Flood Modeller Suite was linked with the 2D scheme of the TUFLOW hydrodynamic model for the simulation (). Firstly, the 1D Lower Wortley Beck fluvial system was set. The Lower Wortley River was modelled using the 1D Flood Modeller Suite version 3.7. Thus far, the Flood Modeller Suite (CH2M) has been widely utilized to model 1D fluvial systems with various magnitudes of the water levels in river channels and at the hydraulic structures in the UK (Wangpimool and Pongput Citation2011). The 1D domain was set up using the datasets of hydraulic structures and the river channel. The roughness of the surface was determined by applying Manning’s n values according to the material of each land-use surface cell. According to the Environment Agency recommendations, the roughness values of the fluvial system were chosen to be between 0.030 and 0.045.
Figure 5. Combined pluvial and fluvial flooding simulation at Lower Wortley
Secondly, the 2D domain was set to capture both the river and the surface overflows in the floodplain in Lower Wortley. The flood extent was simulated using the TUFLOW (BMT WMB) 2D software version 2013–12-AD-IDP-w64. TUFLOW was specifically recommended for the flood simulations because it is rapid and flexible to use and to link with a 1D scheme (Syme Citation2001, BMT WMB Citation2016). In addition, the linking of the Flood Modeller Suite with the TUFLOW tool is widely utilized for flood simulations by researchers (BMT WMB Citation2010, Zhang Citation2015).
TUFLOW software uses the Finite Difference Alternating Direction Implicit (ADI) solution scheme to solve the full 2D free surface shallow-water flow equation. This equation consists of continuity and conservation of momentum equations in the horizontal x and y directions in Cartesian coordinates (Syme Citation1992, Krupka et al. Citation2007, BMT WMB Citation2010, Abdullah Citation2012).
The 2D continuity (EquationEquation 1)(1)
(1) :
X momentum (EquationEquation 2)(2)
(2) :
Y momentum (EquationEquation 3)(3)
(3) :
where ζ is water surface elevation; u and v are depth-averaged velocity components in X and Y directions, respectively; H is depth of water; t is time; x and y are distance in X and Y directions, respectively; Δx and Δy are cell dimensions in X and Y directions, respectively; Cf is the Coriolis force coefficient; n is Manning’s n; ƒi is the form (energy) loss coefficient; p is atmospheric pressure; ρ is the density of water; and Fx and Fy are the sum of components of external forces (e. g. the wind) in X and Y directions, respectively (BMT WMB Citation2010).
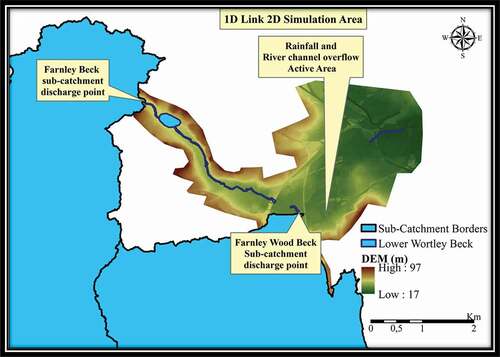
The discharge points from the sub-basins of Wortley Beck and the active precipitation area in Lower Wortley are shown in . The pluvial flood event was simulated using the 2D direct rainfall model. The precipitation () on the impervious and pervious areas of Lower Wortley was applied directly as a net rainfall event in the simulation.
Figure 6. Simulation location of combined pluvial and fluvial flooding in Lower Wortley
Lastly, the assessments were improved by linking the results to the GIS software to observe the flood extents. Direct observation of the flow and the water level at any location of the research site in the absence of the gauge station of the site was obtained using the TUFLOW link GIS tool, which was of significant importance to this research.
The 2D domain was set up using the LiDAR topographic data and the master map of the research area. The 2-m resolution of the LiDAR data was used to observe the impact of the surface elevation. The master map was used to define land use of the catchment as permeable and impermeable surfaces of Lower Wortley. Features of the permeable surfaces are natural landform, water land, and features of the impermeable surfaces are buildings, roads, structure and rail. The model was simulated for a 1D unsteady flow and 2D double precision. The model grid size was 8 m. The outcomes indicated the combinations of the river channel and the surface overflows in the floodplain in Lower Wortley Beck.
4 Results
The outcomes of the simulations in display the areas impacted by the fluvial flooding combined with pluvial flooding and by the individual fluvial and pluvial flood in the floodplains along with Lower Wortley Beck.
Figure 7. Stages of the flood inundation area of the combined flood simulation of the 1 in 100 years event (Sertyesilisik Citation2017)
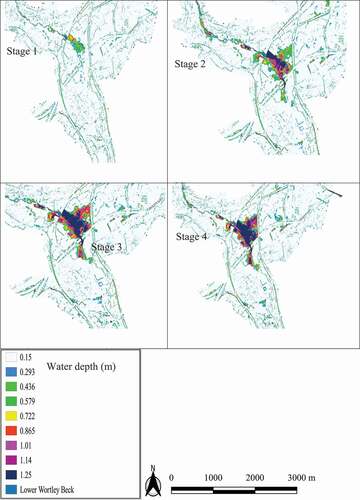
shows the formation of the combined inundation areas in Lower Wortley at different time steps. The fluvial flooding was monitored using the 1 in 100 years event of 20-h discharges from the sub-catchments into Lower Wortley Beck. The pluvial flooding was monitored using the 1 in 100 years of precipitation for the 4-h duration in Lower Wortley.
The inundation of the combined river overflow and rainfall-induced surface runoff progressed along with Lower Wortley Beck and downstream, into the centre of the Lower Wortley area, as shown in . Stages 1, 2, 3 and 4 display the simulation of the combined fluvial and pluvial flood inundation extent at 2.30, 5.00, 7.30, and 10.00 h time, respectively, with maximum water depth for Lower Wortley.
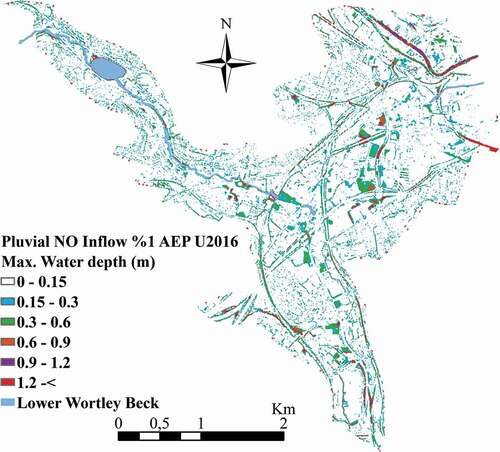
present the combined river and surface overflow with the maximum flood extent and the floodwater depth range. shows the areas susceptible to fluvial flooding only. The discharges of the FB and FWB sub-basins were designed for the fluvial flooding for the ratio of the impervious area in the basin in the year 2016. The 1D-linked 2D model (Flood Modeller Suite/TUFLOW) was utilized for fluvial flooding. The inundation of the river overflow progressed along with Lower Wortley Beck and downstream into the centre of the Lower Wortley area (). shows the areas susceptible to pluvial flooding only. The pluvial flooding simulation was designed using only the baseflow from Lower Wortley Beck and without the inflows from the sub-basins. The 2D direct rainfall model (TUFLOW) was used for pluvial flooding. shows that the lower areas tend to have a greater pluvial flood risk (Sertyesilisik Citation2017). The effects of the combined pluvial and fluvial flooding in Lower Wortley were investigated by comparing the combined fluvial and pluvial flood inundation map Annual Exceedance Probability (1% AEP) () with the fluvial flood inundation map (1% AEP) () and the pluvial flooding inundation map (1% AEP) (; no inflow upstream).
Figure 8. Integrated pluvial and fluvial flood extent with 1% probability with maximum water depth scales (Sertyesilisik Citation2017)
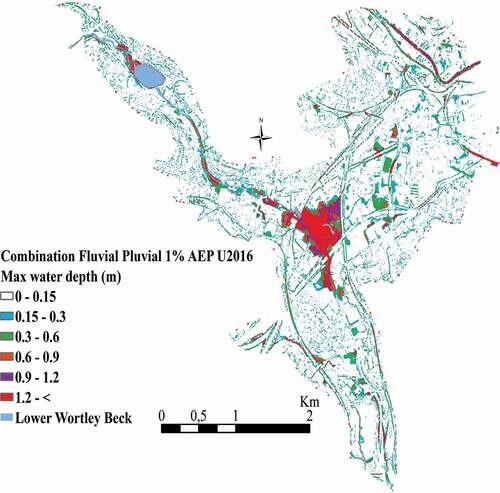
Figure 9. Integrated pluvial and fluvial flood extent with 2% probability with maximum water depth scales (Sertyesilisik Citation2017)
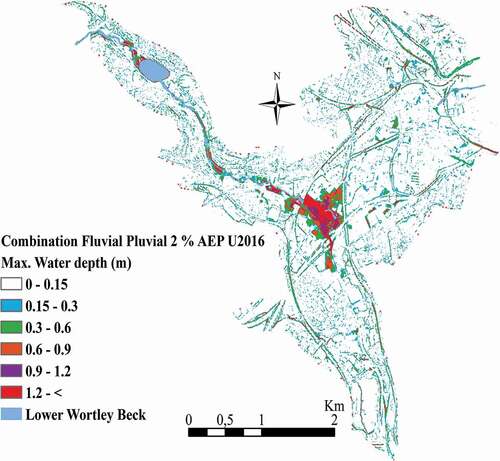
Figure 10. Flood inundation area of the fluvial flood event with 1% probability with maximum water depth scales (Sertyesilisik Citation2017)
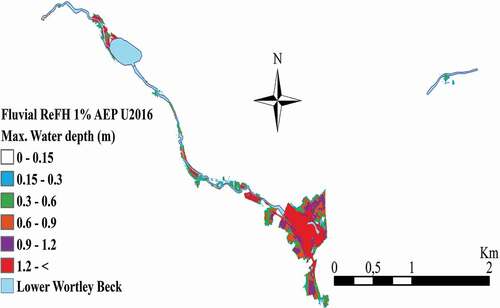
Figure 11. Flood inundation area of the pluvial flood event with 1% probability with maximum water depth scales (Sertyesilisik Citation2017)
5 Discussion
The outcomes of this research indicate that combined fluvial and pluvial flooding areas have greater flood extents and higher water levels than the individual floods do. Similarly, Chen et al. (Citation2010) stated that combining the pluvial and fluvial flood events could intensify the consequences of the events because the flood inundation area and the flood depth become more significant than those caused by a single type of flood.
In this study, the combined pluvial and fluvial flood events have the same inundation area () but have a greater water depth than the pluvial floods alone (). In addition, the combined pluvial and fluvial flood events have a larger flood extent than the fluvial flood events alone (). Also, a fluvial flood alone can cause a greater flood depth than a pluvial flood alone (). Similarly, the combined fluvial and pluvial flood maps generated by Apel et al. (Citation2016) and Muthusamy et al. (Citation2019) showed a greater flood extent than the map of fluvial floods alone because a pluvial flood can inundate places that a fluvial flood cannot.
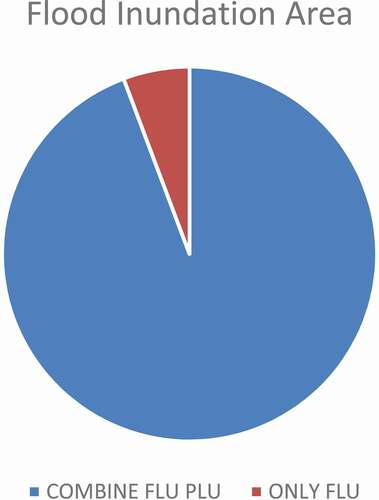
Figure 12. Percentages of the water depth values for flood events
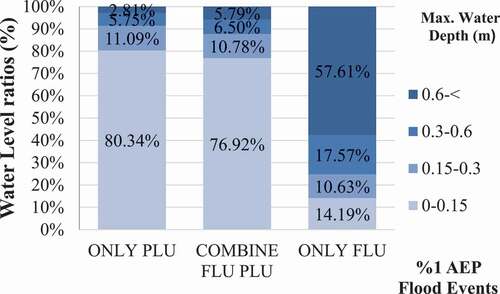
Figure 13. The ratio of flood inundation area of combined fluvial and pluvial to areas of only fluvial flood with 1% probability
The strengths of this methodology, which can be a source to enrich flood risk management, are as follows. First, combining the independent pluvial and fluvial flood simulations by overlapping the individual flood extent maps, or by summing and by calculating the mean of the flood levels, cannot give realistic outcomes because the flood extents and flood water level in the extent of the combined floods cannot be observed directly and computed precisely. Moreover, Lian et al. (Citation2013) pointed out the importance of assessing the combined risk probability to reduce the adverse consequences. Therefore, the simultaneous occurrence of pluvial and fluvial floods can have effects beyond those of their sole impacts, and neglecting these consequences can result in insufficient flood defence (Ashley et al. Citation2005, Burton et al. Citation2010, Chen et al. Citation2010, Lian et al. Citation2013, Apel et al. Citation2016, Breinl et al. Citation2017, Muthusamy et al. Citation2019).
Second, in this study, the merged water level and the flow at any location in the research area could be computed for the ungauged catchments using the TUFLOW 2D hydrodynamic model and considering the cell size of the model resolution.
Third, flood estimation methods have to be innovated using flood hydrodynamic models integrated with high-quality geomorphological data (Chen et al. Citation2009, Ernst et al. Citation2010, Patra et al. Citation2016, Breinl et al. Citation2017). The TUFLOW 2D hydrodynamic model was connected to the GIS and generated flood inundation maps in this research. However, this research can be improved in such ways that, firstly, various inflows and rainfall events can be designed for fluvial flood and pluvial flood events; thus, different probabilities of occurrence of each event can be combined. Secondly, rainfall events can be applied before, after, or during the peak time of fluvial flooding. Also, the impact of rainfall duration and the land-use change both at the upstream location and in the floodplains can be analysed in more detail. The most efficient approach may be using only one rainfall event to create a rainfall–runoff process at the Wortley. Hence, the interdependence between the pluvial and fluvial floods can be monitored. Precipitation and discharge data that are carefully measured and of sufficient length are required; therefore, an augmentation of the number of raingauge and flowgauge stations would be necessary.
Lastly, a more high-quality and detailed flood inundation map with the merged flood depth, level, and velocity can be used to identify flood zones and estimate the hazard efficiently (Dottori et al. Citation2018). For example, flooded bare land areas can be identified using these maps, sustainable drainage systems can be designed, and local governments can be informed during the planning of new settlements and the planning of the emergency responses for these locations (Muthusamy et al. Citation2019).
6 Conclusions
Previous studies mainly focused on flood events discretely and simulated the events separately, but this research was inspired by the significant link between the location of the flooding and the causes of the flood. Although the sources of flood events can be different, when the relationship between the location of the flooding and the flood events is considered, these events can be observed consecutively or simultaneously at the same location. For instance, pluvial and fluvial flooding is not expected to be observed at the same location, but due to heavy rain and the impervious surfaces in the floodplains along the urban streams, a relationship between pluvial and fluvial floods can be observed.
This research paper suggests an alternative approach to combine pluvial and fluvial flood events in urbanized catchments. An inflow hydrograph was integrated with a hyetograph in the simulation to observe the combined risk from pluvial and fluvial floods. Thus, the flood extent and the water level of the combined flood events could be displayed directly. The inundation maps displayed the merged flood levels and the inundation area along with Lower Wortley Beck. The merged water level and the flow at any location in an ungauged catchment can be computed using this methodology.
This research confirms that a discrete assessment of the flood events underrates the consequences of the combined flood events because the risk of the combined flood events is significant. For instance, pluvial flooding could increase the flood inundation area and depth influenced by only the fluvial flood. In conclusion, when the fluvial and pluvial flood events are assessed independently, either by simulating the events individually or by analysing the effects of the events one by one, the interactions of the sources and the magnitudes of the events cannot be observed and obtained.
This research results suggest that when assessing the risk of flooding for a location, besides climate change and urbanization, the potential links between each source of the floods should be considered. Thus, the combined magnitude of the effects of the floods at the location can be captured, and the flood resilience approaches can be enhanced to mitigate the adverse consequences of the flood risk posed by combined events in urbanized catchments by national and local governments. Finally, an awareness of the consequences of land development on the floodplains can be raised.
Acknowledgements
The author greatly appreciates the financial support of the Turkish Ministry of Education during her PhD studies. This paper was produced from her thesis at the University of Leeds, UK, in 2017. The UK Environment Agency provided the data.
Disclosure statement
No potential conflict of interest was reported by the author(s).
References
- Abdullah, A.F., 2012. A methodology for processing raw LiDAR data to support urban flood modelling framework. (Doctoral dissertation, TU Delft, Delft University of Technology).
- Apel, H., et al., 2016. Combined fluvial and pluvial urban flood hazard analysis: concept development and application to Can Tho city, Mekong Delta, Vietnam. Natural Hazards and Earth System Sciences (NHESS), 16, 941–961. doi:https://doi.org/10.5194/nhess-16-941-2016
- Ashley, R.M., et al., 2005. Flooding in the future – predicting climate change, risks and responses in urban areas. Water Science and Technology, 52 (5), 265–273. doi:https://doi.org/10.2166/wst.2005.0142
- Bayliss, A., 1999. Flood estimation handbook: catchment descriptors. Wallingford, UK: Institute of Hydrology.
- BMT WMB., 2010. TUFLOW User Manual – build 2010-10-AA.
- BMT WMB., 2016. TUFLOW User Manual – build 2016-03-AA.
- Breinl, K., et al., 2017. A joint modelling framework for daily extremes of river discharge and precipitation in urban areas. Journal of Flood Risk Management, 10 (1), 97–114. doi:https://doi.org/10.1111/jfr3.12150
- Burton, A., et al., 2010, July. Stochastic rainfall modelling for the assessment of urban flood hazard in a changing climate. In British Hydrological Society Third International Symposium, Managing Consequences of a Changing Global Environment (pp. 19–23). Newcastle.
- Cabinet Office. 2008. The Pitt Review: learning lessons from the 2007 floods. [online]. Available from: http://archive.cabinetoffice.gov.uk/pittreview/thepittreview/final_report.html [ Accessed 2 December 2015].
- CEH, 2009. The Flood Estimation Handbook CD-ROM Version 3 17:51:42 GMT on Tue 09-Dec–2014. Wallingford, Oxon, UK: Centre for Ecology & Hydrology.
- Chen, A.S., et al., 2010. An analysis of the combined consequences of pluvial and fluvial flooding. Water Science and Technology, 62 (7), 1491–1498. doi:https://doi.org/10.2166/wst.2010.486
- Chen, J., Hill, A.A., and Urbano, L.D., 2009. A GIS-based model for urban flood inundation. Journal of Hydrology, 373 (1–2), 184–192. doi:https://doi.org/10.1016/j.jhydrol.2009.04.021
- Cheng, S.J. and Wang, R.Y., 2002. An approach for evaluating the hydrological effects of urbanization and its application. Hydrological Processes, 16 (7), 1403–1418. doi:https://doi.org/10.1002/hyp.350
- Dawson, R.J., et al., 2008. Attribution of flood risk in urban areas. Journal of Hydroinformatics, 10 (4), 275–288. doi:https://doi.org/10.2166/hydro.2008.054
- Dottori, F., Martina, M.L.V., and Figueiredo, R., 2018. A methodology for flood susceptibility and vulnerability analysis in complex flood scenarios. Journal of Flood Risk Management, 11, S632–S645. doi:https://doi.org/10.1111/jfr3.12234
- Du, S., Van Rompaey, A., and Shi, P., 2015. A dual effect of urban expansion on flood risk in the Pearl River Delta (China) revealed by land-use scenarios and direct runoff simulation. Natural Hazards, 77 (1), 111–128. doi:https://doi.org/10.1007/s11069-014-1583-8
- Environment Agency. 2017. Wortley flood map for planning (Rivers and Sea). Available from: http://maps.environment-agency.gov.uk/wiyby/wiybyController?value=Wortley%2C+Leeds&submit.x=19&submit.y=3&submit=Search%09&lang=_e&ep=map&topic=floodmap&layerGroups=default&scale=9&textonly=off [ Accessed 9 February 2017].
- Ernst, J., et al., 2010. Micro-scale flood risk analysis based on detailed 2D hydraulic modelling and high resolution geographic data. Natural Hazards, 55 (2), 181–209. doi:https://doi.org/10.1007/s11069-010-9520-y
- Evans, E., 2004. Foresight: future flooding: scientific summary: volume I: future risks and their drivers.
- Evans, E.P., et al., 2008. An update of the Foresight Future Flooding 2004 qualitative risk analysis. Cabinet Office.
- Falconer, R. and Smyth, P., 2012. The Dublin Pluvial flooding study. World Congr. on Water, Climate and Energy. IWA Dublin, Ireland. Available from https://keynote.conference-services.net/resources/444/2653/pdf/IWAWCE2012_0779.pdf May. [ Accessed 2 November 2017].
- Falconer, R., Smyth, P., and Maani, L., 2008. Pluvial extreme event risk appraisal techniques with recent applications in Ireland and the Uk. In Irish National Hydrology Conference 2008 (pp. 43–52). Dublin: Irish National Committees for IHP and ICID.
- Falconer, R.H., et al., 2009. Pluvial flooding: new approaches in flood warning, mapping and risk management. Journal of Flood Risk Management, 2 (3), 198–208. doi:https://doi.org/10.1111/j.1753-318X.2009.01034.x
- Hammond, M.J., et al., 2015. Urban flood impact assessment: a state-of-the-art review. Urban Water Journal, 12 (1), 14–29. doi:https://doi.org/10.1080/1573062X.2013.857421
- Horritt, M., 2010. Developing a prototype tool for mapping flooding from all sources. Phase 1, Scoping and conceptual method development. [Online]. [ Accessed 13 July 2017]. Available from: https://assets.publishing.service.gov.uk/government/uploads/system/uploads/attachment_data/file/291202/scho0310bsgq-e-e.pdf
- Houghton-Carr, H., 1999. Flood Estimation Handbook: restatement and application of the flood studies report rainfall-runoff method. Wallingford, United Kingdom: Institute of Hydrology.
- Houston, D., et al., 2011. Pluvial (rain-related) flooding in urban areas: the invisible hazard.
- Jha, A.K., Bloch, R., and Lamond, J., 2012. Cities and flooding: a guide to integrated urban flood risk management for the 21st century. Washington, DC, USA: World Bank.
- Kellagher, R., et al., 2010. National pluvial flood mapping for all Ireland – the modelling approach. Irish National Hydrology Conference 2010, 16th November. Athlone.
- Kjeldsen, T.R., 2007. The revitalised FSR/FEH rainfall-runoff method. Centre for Ecology & Hydrology.
- Kjeldsen, T.R., et al., 2005. Revitalisation of the FSR/FEH rainfall-runoff method. CEH, Wallingford: Final Report to DEFRA/EA.
- Krupka, M., et al., 2007. A rapid flood inundation model. Proceedings of the Congress-international Association for Hydraulic Research, 32 (1), 28. July.
- Lian, J.J., Xu, K., and Ma, C., 2013. Joint impact of rainfall and tidal level on flood risk in a coastal city with a complex river network: a case study of Fuzhou city, China. Hydrology and Earth System Sciences, 17 (2), 679. doi:https://doi.org/10.5194/hess-17-679-2013
- Marsh, T., et al., 2016. The winter floods of 2015/2016 in the UK-a review. NERC/Centre for Ecology & Hydrology.
- Merz, B., et al., 2010. Fluvial flood risk management in a changing world. Natural Hazards and Earth System Sciences, 10, 509–527. doi:https://doi.org/10.5194/nhess-10-509-2010
- Moncoulon, D., et al., 2014. Analysis of the French insurance market exposure to floods: a stochastic model combining river overflow and surface runoff. Natural Hazards and Earth System Sciences, 14 (9), 2469–2485. doi:https://doi.org/10.5194/nhess-14-2469-2014
- Moore, R.J., 1985. The probability-distributed principle and runoff production at point and basin scales. Hydrological Sciences Journal, 30 (2), 273–297. doi:https://doi.org/10.1080/02626668509490989
- Morris, M., et al., 2009. An innovative approach to pluvial flood risk assessment. Irish National Hydrology Seminar, Tullamore, Ireland, 68, 78.
- Muthusamy, M., et al., 2019. A remote sensing based integrated approach to quantify the impact of fluvial and pluvial flooding in an urban catchment. Remote Sensing, 11 (5), 577. doi:https://doi.org/10.3390/rs11050577
- Palla, A., et al., 2018. Pluvial flooding in urban areas: the role of surface drainage efficiency. Journal of Flood Risk Management, 11, S663–S676. doi:https://doi.org/10.1111/jfr3.12246
- Patra, J.P., Kumar, R., and Mani, P., 2016. Combined fluvial and pluvial flood inundation modelling for a project site. Procedia Technology, 24, 93–100. doi:https://doi.org/10.1016/j.protcy.2016.05.014
- Re, M., 2005. Topics Geo Annual review: natural catastrophes 2005. Germany: Munich Re, Munich, 15.
- Renaud, F.G., et al., 2013. Tipping from the Holocene to the Anthropocene: how threatened are major world deltas? Current Opinion in Environmental Sustainability, 5 (6), 644–654. doi:https://doi.org/10.1016/j.cosust.2013.11.007
- Rizeei, H.M., Pradhan, B., and Saharkhiz, M.A., 2019. An integrated fluvial and flash pluvial model using 2D high-resolution sub-grid and particle swarm optimization-based random forest approaches in GIS. Complex & Intelligent Systems, 5 (3), pp. 283–302. doi:https://doi.org/10.1007/s40747-018-0078-8
- Sertyesilisik, P., 2017. Assessing urban flood risk with probabilistic approaches. PhD thesis, University of Leeds. Available from: http://etheses.whiterose.ac.uk/id/eprint/19343
- Shi, P.J., et al., 2007. The effect of land use/cover change on surface runoff in Shenzhen region, China. Catena, 69 (1), 31–35. doi:https://doi.org/10.1016/j.catena.2006.04.015
- Singh, R.B. and Singh, S., 2011. Rapid urbanization and induced flood risk in Noida, India. Asian Geographer, 28 (2), 147–169. doi:https://doi.org/10.1080/10225706.2011.629417
- Syme, W.J., 1992. Dynamically linked two-dimensional/one-dimensional hydrodynamic modelling program for rivers, estuaries & coastal waters.
- Syme, W.J., 2001, February. TUFLOW-Two- & One-dimensional unsteady flow Software for rivers, estuaries and coastal waters. In IEAust Water Panel Seminar and Workshop on 2nd Flood Modelling, Sydney.
- Szewrański, S., et al., 2018. Pluvial Flood Risk Assessment Tool (PFRA) for rainwater management and adaptation to climate change in newly urbanised areas. Water, 10 (4), 386. doi:https://doi.org/10.3390/w10040386
- Ten Veldhuis, J.A.E., 2010. Quantitative risk analysis of urban flooding in lowland areas. Doctoral dissertation, TU Delft, Delft University of Technology.
- Thorne, C., 2014. Geographies of UK flooding in 2013/4. The Geographical Journal, 180 (4), 297–309. doi:https://doi.org/10.1111/geoj.12122
- Van Ootegem, L., et al., 2015. Multivariate pluvial flood damage models. Environmental Impact Assessment Review, 54, 91–100. doi:https://doi.org/10.1016/j.eiar.2015.05.005
- Wangpimool, W. and Pongput, K., 2011. Integrated hydrologic and hydrodynamic model for flood risk assessment in Nam Loei basin, Thailand. Proceeding of the 1st International Conference on Water Resources Engineering, 201, 117–127.
- Waters, D., et al., 2003. Adaptation of a storm drainage system to accommodate increased rainfall resulting from climate change. Journal of Environmental Planning and Management, 46 (5), 755–770. doi:https://doi.org/10.1080/0964056032000138472
- Weng, Q., 2001. Modeling urban growth effects on surface runoff with the integration of remote sensing and GIS. Environmental Management, 28 (6), 737–748. doi:https://doi.org/10.1007/s002670010258
- WMO and GWP, 2008. Urban Flood Risk Management – a tool for integrated flood management version 1.0. APFM Technical Document No.11, Flood management tools series. Geneva: World Meteorological Organisation.
- Yin, J., et al., 2015. A review of advances in urban flood risk analysis over China. Stochastic Environmental Research and Risk Assessment, 29 (3), 1063–1070. doi:https://doi.org/10.1007/s00477-014-0939-7
- Zhang, H., 2015. Urban flood simulation by coupling a hydrodynamic model with a hydrological model (Doctoral dissertation, Newcastle University).