
 ?Mathematical formulae have been encoded as MathML and are displayed in this HTML version using MathJax in order to improve their display. Uncheck the box to turn MathJax off. This feature requires Javascript. Click on a formula to zoom.
ABSTRACT
The present study aims to illustrate the efficacy of socio-hydrology in understanding the interaction between coupled human and water systems for sustainable water resource management. Future Land use land cover (LULC) growth is projected under four scenarios – business as usual (BAU), sustainable growth (SG), exponential growth (EG-1 and EG-2), and combined sustainable and economic growth (CS-EG) – for the Subarnarekha basin of India. The associated impacts of the scenarios on hydrological processes are simulated using an integrated modelling system that combines a physically based distributed hydrological model (MIKE SHE/MIKE HYDRO RIVER) and a spatially explicit integrated LULC change model (multilayer perceptron Markov model). The magnitudes of different hydrological variables suggest SG as the most favourable scenario. In contrast, the CS-EG scenario is the most plausible scenario based on the signal-to-noise ratio. The findings may provide valuable knowledge for future LULC planning in the basin. The study suggests incorporating a citizen science approach in LULC planning to reflect local preferences in the decision making process.
Editor S. Archfield Associate Editor S. Pande
1 Introduction
Over the last century, India has experienced significant land use and land cover (LULC) changes, including urbanization, deforestation, agricultural expansion, and industrialization (Roy et al. Citation2015, Hinz et al. Citation2020). The development of land resources may strengthen economic productivity but simultaneously affect the sustainability of the natural resources (Adams et al. Citation2016). One of the most prominent causes of rapidly changing LULC is the increasing human population and the resulting higher demand for resources, i.e. food and shelter (Gaur et al. Citation2020a). Alterations in LULC modify the fluxes of physical and biogeochemical systems that ultimately affect water and environmental security. For example, deforestation may lead to a substantial reduction in evapotranspiration and, consequently, amplification of runoff (Das et al. Citation2018). LULC changes further affect the physical properties by modifying the leaf area index (LAI), rooting depth, and surface roughness, thus altering the momentum, radiation, and water movement dynamics between the atmosphere and land systems (Pielke Citation2005).
Demographic changes and transformation have the most profound impacts on LULC changes; therefore, most urban areas have been subjected to LULC changes worldwide (Patra et al. Citation2018). Furthermore, human-induced modifications to LULC characteristics can substantially affect hydrological processes, resulting in an alteration in surface and sub-surface flow patterns. These alterations emphasize the utility of incorporating human-induced (or anthropogenic) changes in the hydrological cycle in the scientific lexicon.
Socio-hydrology, an emerging branch of study of people and water, deals with comprehending the dynamics and synchronization of coupled human–water systems (Sivapalan et al. Citation2012). Here, humans and their deeds are considered a fundamental element of hydrological cycle dynamics. Socio-hydrology also plays a vital role in achieving a generalized understanding of coupled human–water systems (Di Baldassarre et al. Citation2019). Furthermore, to explore the human-induced changes (e.g. LULC changes) in hydrological regimes, the incorporation of scenario analysis in hydrological modelling exploring feedback among the natural, technical, and social dimensions of the human–water systems could be one solution.
Scenario analysis and modelling have been recognized as robust tools for understanding the mechanism of LULC changes and associated drivers, especially in the case of different mixes of land uses (Adams et al. Citation2016). Scenario planning aids in the reduction of uncertainty associated with future LULC projections by providing the opportunity to explore the outcomes associated with multiple probable futures, hence sustaining the development of effective policies (Reichert et al. Citation2015). Scenario-based studies seek to propose a reliable chance of LULC changes rather than reconstructing the study area’s vegetation history. Integrating LULC scenarios in planning and management is gaining momentum for anticipating future landscapes’ different pathways, allowing an exploration of the options to reach specific goals (Koo and Kleemann Citation2018). Since the scenario analysis is hypothetical, it includes uncertainties associated with the existence of the scenario (Bormann Citation2005). The identification of the plausibility of the scenario, however, is equally important. The utility of the scenario could be estimated based on different aspects, e.g. favourability and plausibility (Elfert and Bormann Citation2010, Wijesekara Citation2013).
To the best of our knowledge, relatively few studies have incorporated scenario analysis in hydrological modelling. Table S1 in the Supplementary material presents the highlights of the critical literature, including the scenario modelling framework. Here, we have applied scenario analysis to an integrated modelling system framed by a fully distributed hydrological model and spatially explicit LULC change model for the Subarnarekha River basin of Eastern India.
Subarnarekha basin was selected as the study area as the basin has been experiencing rapid LULC changes for the last several decades in addition to the changing climate. Subarnarekha harbours several industries along its banks. The basin is sustaining the three Indian states of Jharkhand, Orissa, and West Bengal, in terms of irrigation, municipal uses, and industrial uses; thus, the river is of great socio-economic importance for Eastern India. Gaur et al. (Citation2020a) studied the historical LULC characteristics and compared four spatially explicit LULC models to select the best-performing model for the predicted future LULC of the Subarnarekha basin. To gain a broader perspective on possible future developments of LULC change, however, the entire set of available quantitative LULC change scenarios should be investigated.
As a step forward, the present study provides an understanding of different possible LULC scenarios and their associated impacts on different hydrological processes under the socio-hydrology paradigm, i.e. under the consideration of human-induced impacts. Four types of scenarios are framed in the present study to investigate the dynamics of future LULC patterns and their corresponding impacts on hydrological processes for the Subarnarekha River basin: a business as usual scenario (BAU), a sustainable growth scenario (SG), two exponential growth scenarios (EG-1 and EG-2), and a combined sustainable and economic growth scenario (CS-EG). The plausibility of each scenario is tested by the signal-to-noise ratio (SNR) (Bormann Citation2005).
The dynamics of future LULC patterns is investigated from 2030 to 2050 using an integrated modelling system that combines a physically based distributed hydrological model (MIKE SHE/MIKE HYDRO RIVER) and a spatially explicit integrated LULC change model (Multilayer perceptron Markov chain model (MLP-MC) (Gaur et al. Citation2020a). Fully distributed physically based models are considered the most efficient tools to analyse the spatial variability of hydrological processes (Minville et al. Citation2008).
The novelty of the work lies in the combination of a spatially explicit LULC model and spatially distributed hydrological models within the socio-hydrology paradigm to analyse the scenario-wise future LULC growth and its associated impacts on hydrological processes. Although there are studies on scenario analysis that deal with dynamic aspects of LULC changes (Table S1), the “favourability” and “plausibility” of the LULC scenarios is rarely considered. The socio-hydrology paradigm is used here to analyse the isolated impacts of LULC changes. The rationale behind incorporating the “socio-hydrology paradigm” is integrating socio-economic variables in the LULC predictions. Two distinct LULC scenarios, i.e. EG-1 and EG-2, are framed following the socio-hydrology paradigm and analysed.
2 Methodology
2.1 Study area
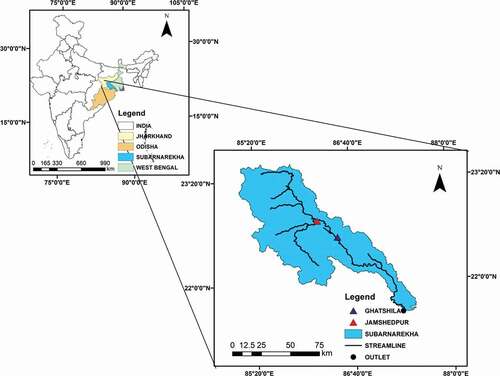
The Subarnarekha basin (19 296 km2) () is situated between 21°15′ and 23°34′N latitudes and between 85°80′ and 87°32′E longitudes. The basin encompasses a medium relief with elevation ranging from 15 to 1100 m a.m.s.l. The basin receives more than 80% of its rainfall through the southwest monsoon, with a mean annual rainfall of 1800 mm (Paul et al. Citation2019). Rapidly changing demographic patterns have caused significant LULC changes in the basin (Singh and Giri Citation2018). In terms of LULC, the majority of land in the basin is under agricultural use (Gaur et al. Citation2020a), with agriculture and food crop cultivation being the significant economic activity of the basin. presents an index map of the Subarnarekha basin. The calibration/validation of the model is carried out at two gauging stations, Jamshedpur and Ghatshila. Subsequently, the basin-wide water balance is calculated to assess the impact of different hydrological processes.
Figure 1. Index map of the Subarnarekha basin
2.2 Data acquisition and preparation
Topographic information at 30 m resolution was obtained from the Shuttle Radar Topographic Mission (SRTM). The precipitation and temperature (maximum and minimum) datasets are taken from India Meteorological Department (IMD), Pune, at resolutions of 0.25° × 0.25° and 1° × 1°, respectively. The soil datasets are taken from the Food and Agricultural Organization of the United Nations (FAO). The soil properties (e.g. saturated hydraulic conductivity, residual moisture content, and so on) are estimated using the Rosetta software. Observed discharge data is taken from the Central Water Commission (CWC), Bhubaneswar. The data related to aquifer properties (i.e. horizontal hydraulic conductivity, vertical hydraulic conductivity, specific yield, and specific retention) are taken from the Central Ground Water Board (CGWB). The LULC information has been taken from our earlier paper (Gaur et al. Citation2020a). Dense forest, water bodies, scrubland, agricultural land, barren land, and built-up area are the six major LULC classes in the basin.
2.3 Data on several explanatory variables of LULC changes in Subarnarekha
In the present study, 11 explanatory variables were grouped into three categories – (i) geophysical (elevation and slope); (ii) proximity (distance to major roads, distance to major cities, distance to major airports, distance to stream, distance to rail networks, and distance to reservoir); and (iii) socio-economic (population, population density, and literacy rate) – that have been generally considered predictors of land-use distribution. The prominent factors responsible for LULC changes in the Subarnarekha basin have been selected through Cramer’s V, as discussed in Gaur et al. (Citation2020a). lists the explanatory variables used in the study.
Table 1. List of explanatory variables exploring the dynamics of land-use changes in Subarnarekha basin
2.4 Applied framework
presents the schematization of the methodology used in the present study. A detailed description of the methodology is given below.
Figure 2. Schematization of the methodology
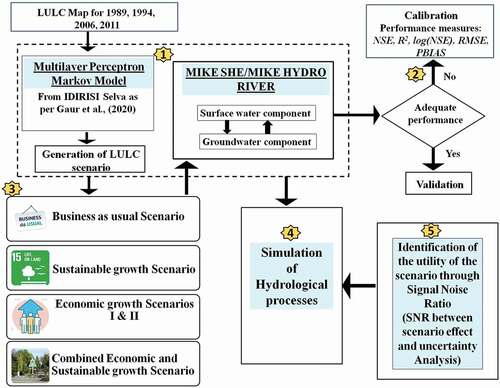
2.4.1 Integrated modelling system
The integrated modelling system incorporates the MIKE SHE/MIKE HYDRO RIVER model and the predicted LULC information from a spatially explicit LULC model, i.e. the MLP-MC model. The fully distributed, physically based MIKE SHE/MIKE HYDRO RIVER model can simulate various hydrological processes in the land phase of the hydrological cycle. The model domain is discretized by 500 m grid cells horizontally. Table S2 presents the details of the methods used to simulate the major hydrological processes. Further details about the MIKE SHE/MIKE HYDRO RIVER model can be retrieved from Refsgaard (Citation1997). The climate datasets (rainfall and potential evapotranspiration) were interpolated to 500 m and given as input to the model in fully distributed form. The potential evapotranspiration was calculated using the Hargreaves method (Hargreaves and Samani Citation1985). The LULC maps of the area for 1989, 1994, 2006, and 2011 were taken from Gaur et al. (Citation2020a). The model requires several inputs, such as LAI, rooting depth, Manning roughness coefficient, and detention storage, corresponding to each LULC class. Such input may be given as time-series or in fully distributed form. We have incorporated the abovementioned inputs in the fully distributed form to simulate the LULC changes more accurately.
Similarly, other model inputs like topography, soil, horizontal hydraulic conductivity, vertical hydraulic conductivity, specific yield, specific storage, and initial potential head are also given as inputs to the model in fully distributed form. MIKE HYDRO RIVER simulates the channel and river flow by utilizing a fully dynamic version of the St Venant equations. The river network was generated using ArcGIS. Details about the historical LULC and the dynamics of drivers causing LULC changes in the Subarnarekha basin can be found in Gaur et al. (Citation2020a). Future projection of LULC for different scenarios is performed by the MLP-MC model in IDRISI Selva software.
The performance of the hydrological model is evaluated using Nash-Sutcliffe efficiency (NSE), coefficient of determination (R2), percent bias (PBIAS), log (NSE), and root mean square error (RMSE) (ASCE Task Committee Citation1993). As NSE is highly sensitive to high flows and neglects the low flows (Wijesekara et al. Citation2014), logarithmic NSE (Ln(NSE)) is used to capture the model performance for low flows accurately. Details of the evaluation measures and their corresponding ranges are presented in the Appendix.
In the MIKE SHE calibration process, initially, the Manning roughness coefficient, detention storage, initial groundwater depth, vegetation parameters (LAI and root depth), soil parameters (water contents at saturation, field capacity and wilting point, and saturated hydraulic conductivity), evapotranspiration coefficients (C1, C2, and C3), and groundwater parameters (horizontal hydraulic conductivity, vertical hydraulic conductivity, specific yield, and specific retention) were considered as the calibration parameters. A parameter sensitivity analysis was performed before the calibration, which identified the Manning surface roughness coefficient, saturated hydraulic conductivity of soils, evapotranspiration coefficients (C1, C2, and C3), and the horizontal and vertical hydraulic conductivities of the aquifer as the sensitive parameters. Consequently, only the sensitive parameters were considered in the model calibration process.
2.4.2 Development of land-use scenarios
Scenario analysis deals with the simulation of the possible effect of LULC changes in the near future (Dwarakish and Ganasri Citation2015). Studies incorporating the hydrological response of a basin under different scenarios include calibrating/validating the model with the current condition and then operating the model with newly framed scenarios and comparing the results (Isik et al. Citation2013). Here, we have proposed scenarios by studying the regional LULC characteristics and reviewing the literature and proposed government policies for the Subarnarekha basin. We have utilized the LULC characteristics of 2011 as a baseline year and projected the LULC changes for 2030, 2040, and 2050. The climate variables are assumed to be constant throughout the simulations, and the climatic variables of 1989 used. The use of constant climate variables may be considered a limitation of the present study. Since this study focused solely on the isolated impacts of the LULC changes, the climate variability was neglected.
Numerous previous studies, e.g. Im et al. (Citation2009), Wijesekara et al. (Citation2014), and Dwarakish and Ganasri (Citation2015), have highlighted that LULC changes substantially impact the major hydrological processes like evapotranspiration, infiltration, and runoff. Therefore, for each scenario, the major hydrological processes, i.e. overland flow (OF), runoff, infiltration (Inf), and evapotranspiration (ET), have been simulated. For a specific simulation, the LULC information and the vegetation parameters (LAI and rooting depth) and Manning roughness coefficient have been changed for each LULC class while keeping the climate variable constant. Therefore, the resulting changes obtained from MIKE SHE simulations are attributed to LULC change only. A scenario is considered more favourable if it results in high infiltration and ET and low OF and runoff (Wijesekara Citation2013). In addition, the impact of LULC changes on the mean and extreme flows is also derived. The developed scenarios are described in the following subsections.
2.4.2.1 Business as usual scenario (BAU)
In the case of the BAU scenario, the historical LULC persists for future periods, i.e. future LULC will follow the historical LULC trends. For the prediction of future LULC under the BAU scenario, the explanatory variables () discussed in Gaur et al. (Citation2020a) are used without incorporating any new plans. However, for the prediction of future LULC, the non-stationarity of the explanatory variables is considered. In the absence of new sustainable, environmental or economic policies, future LULC is determined entirely by historical LULC growth.
2.4.2.2 Sustainable growth scenario (SG)
A sustainable growth scenario has been developed by considering the United Nations’ Sustainable Development Goal 15, i.e. life on land. As per SDG-15, it is required to sustainably manage the forests, ecosystems, soils, and lands on the planet. Therefore, SDG-15 aims to combat desertification and restore degraded land and soil, including land affected by desertification, by 2030. To achieve the SDG-15 goals, India has also committed to achieving Land Degradation Neutrality (LDN) set up by the United Nations Convention to Combat Desertification (UNCCD). Following the SDG-15 goals, India has planned to bring 1/3 of its land under forest cover (Kant et al. Citation2008). Therefore, our scenario aims to increase the forest cover by 7% by 2030 (1/3 of the average percentage of dense forest over 1989–2011, i.e. 21.50%) mainly on the scrublands, keeping the economic and population growth similar to those under BAU. Consequently, for the SG scenario, the transition potential maps are generated considering a 7% increase in the dense forest at the expense of scrublands.
2.4.2.3 Economic growth scenario (EG)
The EG scenario is based on the socio-hydrology paradigm, i.e. socio-economic growth is deemed prominent for the LULC changes. In the EG scenario, the population and economic growth are considered higher than in the BAU scenario. Here, population growth is considered the primary explanatory variable that changes the economy and LULC over time. However, according to Gaur et al. (Citation2020a), population and population density are also prominent drivers of LULC change. Two EG scenarios, namely “Uber” (EG-1) and “High” (EG-2), are considered, following Choi and Deal (Citation2008), in which weights of 150% and 125%, respectively, relative to the BAU scenario, are given to the population projections. Consequently, the socio-economic variables (population and population density) are projected by 150% and 125% for the EG scenarios. Additionally, the scenarios are also driven by more favourable economic development plans, urbanization, and infrastructure improvement. The main consequences of the scenario are expanding the built-up area on the current agricultural and forest lands.
2.4.2.4 Combined sustainable and economic growth scenario (CS-EG)
This scenario is assumed to be a hybrid of the SG and EG scenarios, where economic growth is considered with reforestation policies. In the CS-EG scenario, expanding the built-up area and forest land is considered on the agricultural land and the scrubland.
2.4.3 Signal-to-noise ratio (SNR)
Bormann (Citation2005) proposed the SNR to determine the significance of changes simulated through a scenario. SNR enables the comparison of model uncertainty to the scenario’s impact by linking the quantification of scenario effects to the model uncertainty. A positive value of SNR indicates the dominance of the scenario effect over the model uncertainty. Values greater than 1 indicate high suitability for a given scenario, while a negative value indicates that the given scenario is not suitable for the particular modelling study (Elfert and Bormann Citation2010). Here, the SNR has been estimated to derive the plausibility of the scenario. SNR relates the scenario effect and model uncertainty as follows:
where “Scenario” represents the annual water balance of a land-use scenario (mm/year), “Status quo” represents the annual water balance for the baseline period (mm/year), and “Water balance error” denotes the absolute water balance error (mm/year). Positive values of SNR show that the difference between scenario and status quo is at least as large as the water balance error (Elfert and Bormann Citation2010). An SNR value >1 indicates a large signal (scenario effect) compared to the noise (effect at least double the water balance error) (Elfert and Bormann Citation2010).
3 Results
3.1 Calibration and validation of MIKE SHE/MIKE HYDRO RIVER model
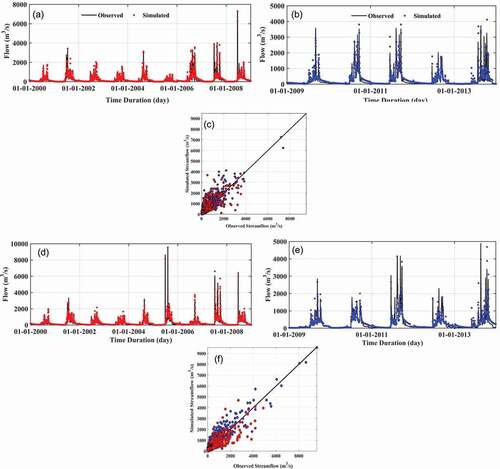
presents the calibration and validation results of MIKE SHE/MIKE HYDRO RIVER against streamflow at Jamshedpur and Ghatshila gauging stations. presents the time series and scatter plot for the calibration/validation at Jamshedpur and Ghatshila gauging stations. It is evident from and that the model is exhibiting underestimation bias at both gauging stations. However, as per the hydrological model evaluation guidelines by Moriasi et al. (Citation2007), the performance of MIKE SHE/MIKE HYDRO RIVER in simulating the streamflow at Jamshedpur and Ghatshila gauging stations falls under the “good” category. The performance measure Ln(NSE) also shows a good model performance during calibration/validation (Wijesekara Citation2013).
Table 2. Measures of performance evaluation used during streamflow simulation
Figure 3. (a) Time-series plot during calibration at Jamshedpur; (b) time-series plot during validation at Jamshedpur; (c) scatter plot during calibration/validation at Jamshedpur; (d) time-series plot during calibration at Ghatshila; (e) time-series plot during validation at Ghatshila; (f) scatter plot during calibration/validation at Ghatshila
3.2 Impact of LULC changes on the hydrological processes during 1989–2011
The percent coverage of each LULC class during 1989–2011 is presented in . The corresponding LULC maps are given in Fig. S1 in the Supplementary material. Due to the substantial growth of the built-up area over 1989–2011, the dense forest and agricultural lands have decreased. Areas under scrubland and barren lands have increased over 1989–2011. However, the area covered by water bodies has decreased, despite the construction of several reservoirs in the basin. More details on the LULC trends and causes can be found in Gaur et al. (Citation2020a).
Table 3. Percent coverage of LULC classes during 1989–2011
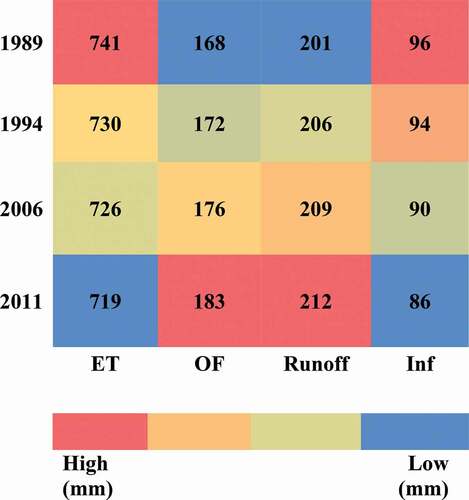
illustrates the basin-wide variation of various hydrological processes in terms of storage depth (mm). LULC changes over 1989–2011 are considered by incorporating 1989, 1994, 2006, and 2011 LULC maps. An increase in urbanization and anthropogenic activities and a decrease in dense forests resulted in increased overland flow and runoff and decreased evapotranspiration and infiltration. Another reason behind the reduced evapotranspiration and infiltration is the transition of dense forest to scrublands and agricultural lands to barren lands.
Figure 4. Variation in evapotranspiration (ET), overland flow (OF), runoff (Runoff), and infiltration (INF) for the period 1989–2011
3.3 Impact of LULC changes on the hydrological process for different LULC scenarios
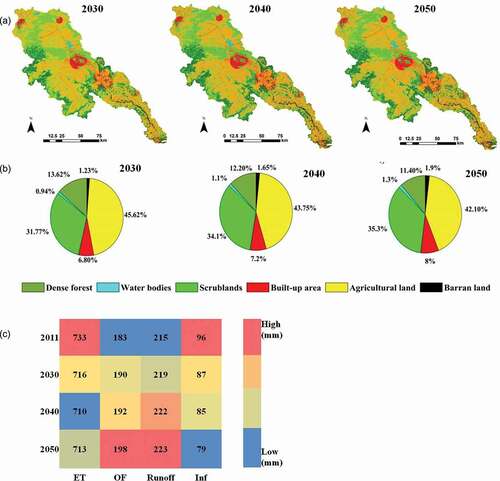
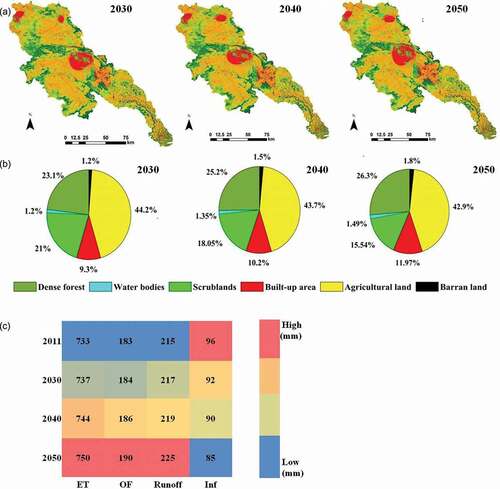
illustrate the predicted LULC maps and percent coverage of corresponding LULC classes, respectively, under the BAU scenario during 2030–2050. LULC trends under the BAU scenario are found in accord with historical LULC as per the pre-existing condition. ) presents the hydrological process variation in terms of storage depth (mm) for 2011–2050, with 2011 as a baseline period. It is evident from ) that all LULC classes follow a similar trend to that of 1989–2011 (Fig. S1). ) depicts an increased OF (by 3.8–8.2%) and runoff (3.7–1.9%), and decreased evapotranspiration (2.3–3.1%) and infiltration (9.3–17.7%) as compared to the baseline period. An increase in the built-up area and the corresponding decrease in the dense forest and agricultural areas are responsible for such changes in the hydrological processes. Under the BAU scenario, mean and low flows are projected to decrease by 2.5–6% and 15–35%, respectively, during 2030–2050 over the Subarnarekha basin. In contrast, the corresponding high flows are projected to increase by 40–110%. Our findings for the BAU scenarios are coherent with Wijesekara et al. (Citation2014), who reported an increase in OF and decreased Inf and ET over the catchment due to expansion of the built-up areas and reduction in the agricultural land and the dense forest.
Figure 5. BAU scenario: (a) predicted LULC map for 2030, 2040, and 2050; (b) percent coverage of LULC classes for 2030, 2040, and 2050; (c) variation of evapotranspiration (ET), overland flow (OF), runoff (Runoff), and infiltration (Inf) for the period 2011–2050
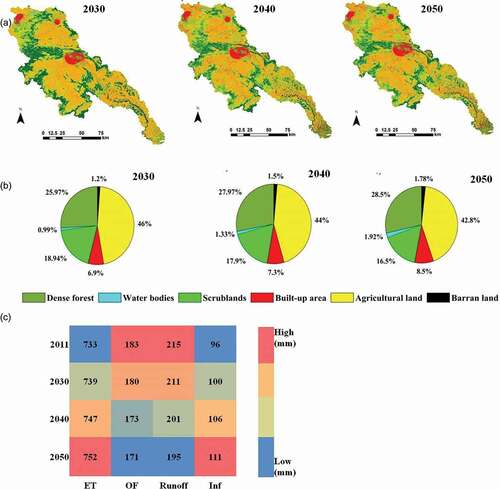
present, respectively, the predicted LULC maps, percent coverage of various LULC classes, and the corresponding variations in different hydrological variables under the SG scenario. As SG scenarios follow the SDG-15 goals of reforestation, in this case, the major transition occurred from scrubland to dense forest resulting in a 7% increase in dense forest by 2030 in the Subarnarekha basin. The other classes (built-up area, agricultural land, barren land, and water bodies) are assumed to follow the BAU scenario. It is evident from that a slight increase in agricultural land and built-up area takes place in the SG scenario as compared to the BAU scenario. An increase in the dense forest resulted in high detention of water for evapotranspiration and infiltration. Consequently, the forested areas generated low OF (1.6–6.6%) and runoff (1.9–9.3%) with higher Inf (4.2–15.6%) and ET (0.9–2.6%) ()). Under the SG scenario, the mean flows are projected to decrease by 4–6.5%. The high flows are projected to increase by 15–65%, while the low flows are projected to decrease by 5–20% during 2030–2050 over the Subarnarekha basin.
Figure 6. SG scenario: (a) predicted LULC map for 2030, 2040, and 2050; (b) percent coverage of LULC classes for 2030, 2040, and 2050; (c) variation of evapotranspiration (ET), overland flow (OF), runoff (Runoff), and infiltration (Inf) for the period 2011–2050
) and (b) and 8(a) and (b) present the predicted LULC maps and percent coverage of LULC classes under “Uber” (EG-1) and “High” (EG-2) scenarios, respectively. present the corresponding changes in the hydrological processes in terms of storage depth under the two scenarios mentioned above.
Figure 7. EG-1 scenario: (a) predicted LULC map for 2030, 2040, and 2050; (b) percent coverage of LULC classes for 2030, 2040, and 2050; (c) variation of evapotranspiration (ET), overland flow (OF), runoff (Runoff), and infiltration (Inf) for the period 2011–2050
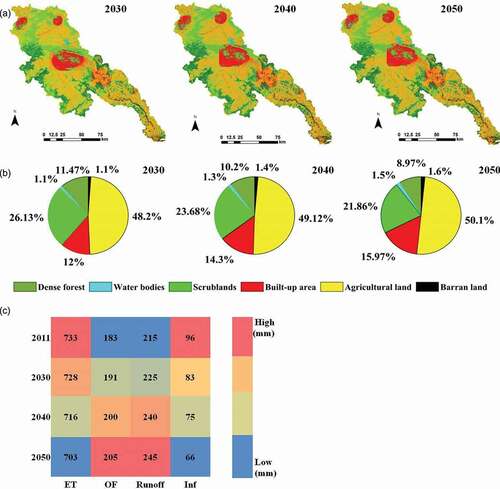
Figure 8. EG-2 scenario: (a) predicted LULC map for 2030, 2040, and 2050; (b) percent coverage of LULC classes for 2030, 2040, and 2050; (c) variation of evapotranspiration (ET), overland flow (OF), runoff (Runoff), and infiltration (Inf) for the period 2011–2050
The EG-1 and EG-2 scenarios considered only the socio-hydrology paradigm, i.e. human interventions for LULC change. The higher percentage increase for built-up areas reflects the projected population growth in EG-1 and EG-2. Consequently, agricultural intensification takes place to nourish the increased population, and the forest areas decrease over 2030–2050. It is evident from ) and (a) that built-up areas spread near the existing urban areas ()). The increase in the built-up area lowers the detention storage and provides less water to infiltrate. Therefore, there is a reduction in ET (0.6–4.1% and 0.5–2.4%) and Inf (13.5–45.4% and 10.4–21.9%), which leads to higher OF (4.3–12% and 3.3–7.6%) and runoff (3.7–11.6% and 4.6–14%) under EG-1 and EG-2 scenarios, respectively. Under the EG-1 scenario, the mean flows are projected to increase by 3–8.5%. The high flows are projected to increase by 70–250%, while low flows are projected to decrease by 20–42% during 2030–2050. Under the EG-2 scenario, the mean flows are projected to increase by 2–7%, with a 65–210% projected increase in high flows and a 20–40% projected decrease in low flows. The outcomes are coherent with the findings of Choi and Deal (Citation2008) and Cornelissen et al. (Citation2013), who reported a significant increase in the surface flow over the catchment under the EG scenario.
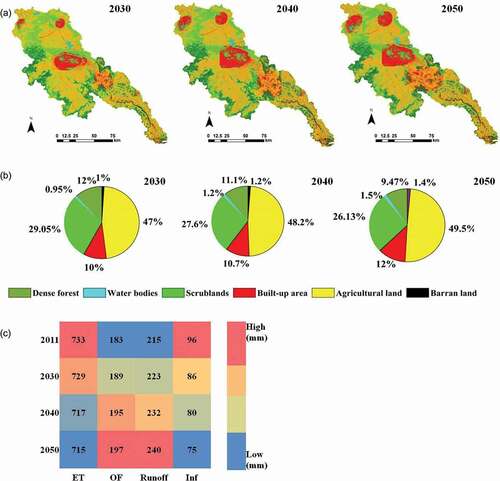
present, respectively, the predicted LULC maps, percent coverage of LULC classes, and corresponding changes in the hydrological variables under the CS-EG scenario. CS-EG is the only scenario that considers forest regeneration and economic growth (increase in the built-up area) simultaneously. It is evident from ) that built-up areas spread near the existing urban areas, while the dense forests spread at the expense of scrublands. Overall, the CS-EG scenario leads to an increase in ET (0.5–2.3%), OF (0.5–3.8%), and runoff (0.9–4.6%) and a decrease in Inf (4.2–11.4%). However, the overall increase in OF/runoff and decrease in Inf is less than in the EG-1 and EG-2 scenarios. Under the CS-EG scenario, the mean flows are projected to decrease by 3.5–6%, with a projected increase by 50–135% in high flows and a projected decrease by 15–40% in low flows during 2030–2050. Outcomes of the CS-EG scenario agree with Aduah et al. (Citation2016), who reported increased high flows owing to the economic growth with reforestation.
Figure 9. SG EG scenario: (a) predicted LULC map for 2030, 2040, and 2050; (b) percent coverage of LULC classes for 2030, 2040, and 2050; (c) variation of evapotranspiration (ET), overland flow (OF), runoff (Runoff), and infiltration (Inf) for the period 2011–2050
The results overall show that the SG scenario is the most favourable from the perspective of the impact of LULC changes on the hydrological processes. It is the only scenario that meets the criteria of high infiltration and ET and low OF and runoff (Wijesekara Citation2013).
3.4 Determination of scenario plausibility
The SNR values for the BAU, SG, EG-1, EG-2 and CS-EG scenarios are found to be 0.53, 0.87, 1.21, 1.06, and 1.42, respectively. The positive values of SNR in all cases indicate a high scenario effect (i.e. high signal) compared to the model uncertainty (i.e. low noise). The positive values (<1) of SNR for the BAU and SG scenarios show sufficient suitability. In contrast, the higher values (>1) of SNR for EG-1, EG-2, and CS-EG indicate the high suitability of these three scenarios. Hence, based on plausibility, the CS-EG scenario is the most suitable, suggesting the utility of the hybrid approach (simultaneous reforestation and economic growth) in generating significant positive changes in the water balance.
4 Discussion
Subarnarekha basin stands as testimony to the changing times as the basin has been subjected to drastic deforestation, expeditious urbanization, industrialization, and rapid soil degradation over the past several decades (Guha and Patel Citation2017, Singh and Giri Citation2018). Gaur et al. (Citation2020b) projected the high possibility of flood occurrence in the basin by studying the isolated impacts of climate change. Gaur et al. (Citation2020a) intercompared four LULC models and selected the best one for predicting the future LULC in the Subarnarekha basin. Almost all LULC models predict the future LULC by following historical LULC trends (Serneels et al. Citation2001). However, under changing environmental conditions, anthropogenic influences are prominent, and future LULC may not be solely dependent on historical LULC. Therefore, it is essential to understand the range of different LULC changes in the basin to effectively manage the land and water resources in the region (Aduah Citation2016).
Unlike the previous studies, viz. Thanapakpawin et al. (Citation2007), Choi and Deal (Citation2008), Elfert and Bormann (Citation2010), and He and Hogue (Citation2012), we have made a novel attempt to simulate the impact of various LULC scenarios using a flexible integrated modelling technique, linking the LULC changes to the hydrological model in a fully distributed manner. We have also attempted to identify the plausibility of the scenario over the model uncertainty using the SNR.
It is evident from the results presented in section 3.3 that specific LULC scenarios trigger changes in certain water balance components due to conditions/policies imposed under the scenario (e.g. socio-economic growth in the EG scenario leads to a substantial increase in runoff). Also, the hydrological processes vary with the percent increase/decrease in the LULC area (covered by a specific LULC class), the concentrated LULC development, and the spatial patterns of LULC. The projected increase in high flows under different LULC scenarios indicates a strong probability of floods in the Subarnarekha basin during 2030–2050.
The SG scenario is the most favourable in capturing the hydrological processes. It results in higher infiltration and evapotranspiration and lower overland flow and runoff compared to the other scenarios. In contrast, the CS-EG scenario is the most plausible based on the SNR. However, the feasibility of the SG scenario is questionable because, in reality, it is improbable to increase the forest area while maintaining the other classes at the BAU scenario level. The CS-EG scenario, on the other hand, seems closer to reality as it deals with reforestation and economic growth by expanding the forest area in the scrubland and built-up area in the agricultural land. Therefore, the CS-EG scenario is recommended as the preferable scenario for the Subarnarekha basin.
5 Summary and conclusions
The present study illustrates integrating a fully distributed physically based hydrological model (MIKE SHE/MIKE HYDRO RIVER) with a spatially explicit LULC model (multilayer perceptron) to study the impact of the LULC scenarios on the hydrological processes in the Subarnarekha River basin of Eastern India. The calibrated/validated hydrological model is subsequently used to simulate various hydrological processes under different LULC scenarios. The four scenarios of LULC changes simulated for the future (2030–2050) are: the business as usual scenario (BAU), a sustainable growth scenario (SG), two economic growth scenarios (EG-1 or “Uber” and EG-2 or “High”), and a combined sustainable and economic growth scenario (CS-EG).
A scenario is considered more favourable if it results in high Inf and ET and low OF and runoff. In this regard, the SG scenario is the most favourable. Also, the plausibility of the scenarios over the model uncertainty is tested using the SNR. Based on the magnitude of SNR, the CS-EG scenario is the most suitable. However, the CS-EG scenario is recommended as the preferable scenario for the Subarnarekha basin as it is closer to reality.
Numerous studies dealing with changing aspects of LULC have been carried out worldwide; however, the present work exhibits several unique features compared to other studies. The modelling system developed here includes the LULC changes and MIKE SHE/MIKE HYDRO RIVER models, connected through a comprehensive set of LULC-based parameters that are spatially explicit. The developed integrated modelling system is flexible (i.e. it allows the user to alter the data and model parameters) to easily incorporate future sustainability issues without any significant amendments.
The present study illustrates the utility of socio-hydrology in predicting future water resources by presenting the possible LULC scenarios for the Subarnarekha basin. The work further provides the opportunity to incorporate other socio-economic aspects to study LULC dynamics more accurately. The conclusion of the study, i.e. that the CS-EG scenario is the most suitable for the Subarnarekha basin, suggests massive reforestation and appropriate LULC planning to boost economic growth.
Supplemental Material
Download MS Word (77 KB)Disclosure statement
No potential conflict of interest was reported by the authors.
Supplementary material
Supplemental data for this article can be accessed here.
References
- Adams, V.M., Pressey, R.L., and Álvarez-romero, J.G., 2016. Using optimal land-use scenarios to assess trade-offs between conservation, development, and social values. PLoS ONE, 11 (6), 1–20. doi:https://doi.org/10.1371/journal.pone.0158350.
- Aduah, M.S., 2016. Impacts of Global Changes on a lowland rainforest region of West Africa Thesis (PhD). Centre for Water Resources Research (CWRR), School of Agricultural, Earth and Environmental Sciences, University of KwaZulu-Natal, Pietermaritzburg, South Africa.
- ASCE Task Committee, 1993. Criteria for evaluation of watershed models. Journal of Hydrologic Engineering, 119, 429–442.
- Bormann, H., 2005. Advances in geosciences evaluation of hydrological models for scenario analyses : signal-to-noise-ratio between scenario effects and model uncertainty. Advances in Geoscience, 5, 43–48. doi:https://doi.org/10.5194/adgeo-5-43-2005.
- Choi, W. and Deal, B.M., 2008. Assessing hydrological impact of potential land use change through hydrological and land use change modeling for the Kishwaukee River basin (USA). Journal of Environment Management, 88, 1119–1130. doi:https://doi.org/10.1016/j.jenvman.2007.06.001.
- Cornelissen, T., Diekkrüger, B., and Giertz, S., 2013. A comparison of hydrological models for assessing the impact of land use and climate change on discharge in a tropical catchment. Journal of Hydrology, 498, 221–236. Elsevier B.V. doi:https://doi.org/10.1016/j.jhydrol.2013.06.016.
- Das, P., et al., 2018. Impact of LULC change on the runoff, base flow and evapotranspiration dynamics in eastern Indian river basins during 1985–2005 using variable infiltration capacity approach. Journal of Earth System Science, 127 (2). doi:https://doi.org/10.1007/s12040-018-0921-8.
- Di Baldassarre, G., et al., 2019. Sociohydrology: scientific challenges in addressing the sustainable development goals. Water Resouces Research, 55 (8), 6327–6355. doi:https://doi.org/10.1029/2018WR023901.
- Dwarakish, G.S. and Ganasri, B.P., 2015. Impact of land use change on hydrological systems: a review of current modeling approaches. Cogent Geoscience, 1 (1), 1115691. Cogent. doi:https://doi.org/10.1080/23312041.2015.1115691.
- Elfert, S. and Bormann, H., 2010. Simulated impact of past and possible future land use changes on the hydrological response of the Northern German lowland ‘Hunte’ catchment. Journal of Hydrology, 383 (3–4), 245–255. Elsevier B.V. doi:https://doi.org/10.1016/j.jhydrol.2009.12.040.
- Gaur, S., et al., 2020a. Spatio-temporal analysis of land use and land cover change: a systematic model inter-comparison driven by integrated modelling techniques. International Journal of Remote Sensing, 41 (23), 9229–9255. Taylor & Francis. doi:https://doi.org/10.1080/01431161.2020.1815890.
- Gaur, S., Bandyopadhyay, A., and Singh, R., 2020b. Modelling potential impact of climate change and uncertainty on streamflow projections: a case study. Journal of Water and Climate Change, 1–17. doi:https://doi.org/10.2166/wcc.2020.254.
- Guha, S. and Patel, P.P., 2017. Evidence of topographic disequilibrium in the Subarnarekha river basin, India: a digital elevation model based analysis. Journal of Earth System Science, 126 (7), 1–20. Springer India. doi:https://doi.org/10.1007/s12040-017-0884-1.
- Hargreaves, G.H. and Samani, Z.A., 1985. Reference crop evapotranspiration from temperature. Applied Engineering in Agriculture, 1, 96–99. doi:https://doi.org/10.13031/2013.26773.
- He, M. and Hogue, T.S., 2012. Integrating hydrologic modeling and land use projections for evaluation of hydrologic response and regional water supply impacts in semi-arid environments. Environmental Earth Science, 65, 1671–1685. doi:https://doi.org/10.1007/s12665-011-1144-3.
- Hinz, R., et al., 2020. Agricultural development and land use change in India: a scenario analysis of trade-offs between UN Sustainable Development Goals (SDGs). Earth’s Futur, 8 (2), 1–19. doi:https://doi.org/10.1029/2019EF001287.
- Im, S., et al., 2009. Assessing the impacts of land use changes on watershed hydrology using MIKE SHE. Environmental Geology, 57 (1), 231–239. doi:https://doi.org/10.1007/s00254-008-1303-3.
- Isik, S., et al., 2013. Modeling effects of changing land use/cover on daily streamflow: an artificial neural network and curve number based hybrid approach. Journal of Hydrology, 485, 103–112. doi:https://doi.org/10.1016/j.jhydrol.2012.08.032.
- Kant, P., et al., 2008. India: bringing a third of the land under forest cover. (Keep Asia Green Volume III South Asia). IUFRO World Series, 20 (3), 111–162.
- Koo, H. and Kleemann, J., 2018. Land use scenario modeling sased on local knowledge for the provision of ecosystem services in Northern Ghana. Land, 7 (2), 59. doi:https://doi.org/10.3390/land7020059.
- Minville, M., Brissette, F., and Leconte, R., 2008. Uncertainty of the impact of climate change on the hydrology of a nordic watershed. Journal of Hydrology, 358 (1–2), 70–83. doi:https://doi.org/10.1016/j.jhydrol.2008.05.033.
- Moriasi, D.N., et al., 2007. Model evaluation guidelines for systematic quantification of accuracy in watershed simulations. Transactions of ASABE, 50 (3), 885–900. doi:https://doi.org/10.13031/2013.23153.
- Patra, S., et al., 2018. Impacts of urbanization on land use /cover changes and its probable implications on local climate and groundwater level. Journal of Urban Management, 7 (2), 70–84. Elsevier B.V. doi:https://doi.org/10.1016/j.jum.2018.04.006.
- Paul, P.K., et al., 2019. Diagnosing credibility of a large-scale conceptual hydrological model in simulating streamflow. Journal of Hydrology Engineering, 24 (4), 1–14. doi:https://doi.org/10.1061/(ASCE)HE.1943-5584.0001766.
- Pielke, R.A., 2005. Land use and climate change. Science, 310 (5754), 1625–1626. doi:https://doi.org/10.1126/science.1120529.
- Refsgaard, J.C., 1997. Parameterisation, calibration and validation of distributed hydrological models. Journal of Hydrology, 198 (1–4), 69–97. doi:https://doi.org/10.1016/S0022-1694(96)03329-X.
- Reichert, P., et al., 2015. The conceptual foundation of environmental decision support. Journal of Environmental Management, 154, 316–332. Elsevier Ltd. doi:https://doi.org/10.1016/j.jenvman.2015.01.053.
- Roy, P.S., et al., 2015. Development of decadal (1985-1995-2005) land use and land cover database for India. Remote Sensing, 7 (3), 2401–2430. doi:https://doi.org/10.3390/rs70302401.
- Serneels, S., Said, M.Y., and Lambin, E.F., 2001. Land cover changes around a major East African Wildlife Reserve: the Mara Ecosystem (Kenya). International Journal of Remote Sensing, 22 (17), 3397–3420. doi:https://doi.org/10.1080/01431160152609236.
- Singh, A.K. and Giri, S., 2018. Subarnarekha river: the gold streak of India. The Indian Rivers, February. doi:https://doi.org/10.1007/978-981-10-2984-4.
- Singh, J., Knapp, H. V., Arnold, J. G. and Demissie, M., 2004. Hydrological modeling of the Iroquois River watershed using HSPF and SWAT. Journal of American Water Resources Association, 41(2), 343–360. doi:https://doi.org/10.1111/j.1752-1688.2005.tb03740.x
- Sivapalan, M., Savenije, H.H.G., and Blöschl, G., 2012. Socio-hydrology: a new science of people and water. Hydrological Process, 26 (8), 1270–1276. doi:https://doi.org/10.1002/hyp.8426.
- Thanapakpawin, P., et al., 2007. Effects of landuse change on the hydrologic regime of the Mae Chaem river basin, NW Thailand. Journal of Hydrology, 334, 215–230. doi:https://doi.org/10.1016/j.jhydrol.2006.10.012.
- Wijesekara, G.N., 2013. An integrated modeling system to simulate the impact of land-use changes on hydrological processes in the Elbow River watershed in Southern Alberta. Unpublished doctoral thesis. University of Calgary, Calgary, AB. doi:https://doi.org/10.11575/PRISM/24908.
- Wijesekara, G.N., et al., 2014. A comprehensive land-use/hydrological modeling system for scenario simulations in the Elbow River watershed, Alberta, Canada. Environmental Management, 53 (2), 357–381. doi:https://doi.org/10.1007/s00267-013-0220-8.
Appendix
Details of the evaluation measures for the hydrological model
Nash-Sutcliffe efficiency (NSE):
Here, represents the observed discharge,
represents the simulated discharge, and
represents the average of observed discharge. NSE values lie between −∞ and 1. The ideal value, 1, corresponds to a perfect match between modelled and observed data, whereas a value of 0 indicates that the model predictions are as accurate as the mean of the observed data. NSE < 0 indicates that the mean of the observed data is a better predictor than the model.
The NSE is not very sensitive to systematic model over- or under-prediction, especially during low flow periods.
Coefficient of determination (R2):
Here, represents the observed discharge,
represents the simulated discharge,
represents the average of observed discharge, and
represents the average of simulated discharge. R2 values lie between 0 and 1, with higher values indicating less error variance; values greater than 0.5 are considered acceptable.
Logarithmic NSE (Ln(NSE)):
Here, represents the observed discharge,
represents the simulated discharge, and
represents the average of observed discharge. Ln(NSE) values lie between −∞ and 1. Using the logarithm of flows reduces the sensitivity of the metric to high flows and increases the sensitivity to low and mid-range flows. For this reason, Ln(NSE) is often used for model calibration when low-flow performance is important.
Percent bias (PBIAS):
Here, represents the observed discharge and
represents the simulated discharge. PBIAS ranges between −∞ and ∞, with 0 as the optimum value.
Root mean square error (RMSE):
Here, represents the observed discharge and
represents the simulated discharge. RMSE values smaller than half the standard deviation of measured data are considered to be accurate (Singh et al. Citation2004).