
 ?Mathematical formulae have been encoded as MathML and are displayed in this HTML version using MathJax in order to improve their display. Uncheck the box to turn MathJax off. This feature requires Javascript. Click on a formula to zoom.
ABSTRACT
Plant transpiration is the dominant water flux in the global terrestrial water balance and a key process in the hydrological sciences. Stable isotopes have contributed greatly to this understanding but one difficult assumption for plant water source quantification using hydrogen and oxygen isotopes is that no isotopic fractionation occurs during water uptake and transport within the plant. Here we present a simple glasshouse experiment with two potted olive trees to test isotopic fractionation. We irrigated the trees with labelled water and cryogenically extracted water from twigs, cores and roots. We found no significant differences in the isotopic composition of water extracted from wood cores and twigs in distinct parts of the trees as they reflected the signature of labelled water. However, significant differences were obtained between plant water and deep soil water. Our results suggest no isotopic fractionation in olive trees, under the specific experimental conditions, validating the traditional isotope-tracing approach.
Editor A. Fiori Associate editor N. Malamos
1 Introduction
Stable isotopes of hydrogen and oxygen (2H and 18O) are powerful tools to investigate water pathways and determine the water sources used by plants (Beyer et al. Citation2016, Hervé-Fernández et al. Citation2016, Volkmann et al. Citation2016, Orlowski et al. Citation2018b, Barbeta et al. Citation2019). Recently, many studies have focused on quantifying the proportion of soil water and groundwater exploited by plants for transpiration in forest settings at the plot, catchment and global scale (e.g. Evaristo et al. Citation2015, Citation2016, Citation2019, Barbeta and Peñuelas Citation2017, Dudley et al. Citation2017, Barbeta et al. Citation2019, Amin et al. Citation2020), as well as in agro-ecosystems (Penna et al. Citation2020 and references therein). Studies employing the stable isotope mixing model approach assume that isotopic fractionation does not occur during water uptake by plants and along the pathway from the roots up to the leaves, i.e. that the original water source isotopic composition remains unaltered during uptake at the soil–root interface and transport to the distal twigs (as shown in early studies: Wershaw et al. Citation1966, White et al. Citation1985, Dawson and Ehleringer Citation1993, Dawson et al. Citation2002). However, factors such as the phase change, i.e. from solid to liquid to vapour and vice versa (Michener and Lajtha Citation2008), and the kinetic isotope effects resulting from diffusion at the air–water interface (Horita et al. Citation2008) can play an important role in the alteration of the isotopic composition of the transpired water. In addition, some other factors such as storage vessels, conduits dimensions and diffusion of leaf water in the backward direction, and even the direct absorption of atmospheric water, can affect the xylem water isotopic signature (see references in von Freyberg et al. Citation2020, Beyer and Penna Citation2021). The mixing of xylem–phloem fluids across membranes is one of the proposed mechanisms of xylem water enrichment along the stem, branches and young plant tissues (e.g. Dawson and Ehleringer Citation1993, Thorburn et al. Citation1993, Cernusak et al. Citation2005, Lehmann et al. Citation2018). However, other processes that may involve water exchange between phloem and xylem during transport are still unclear.
Despite the large number of ecohydrological studies using stable isotopes, there is not much research testing the assumption of no or negligible isotopic fractionation of water taken up by plants in controlled or uncontrolled vegetated environments. Early work by Ellsworth and Williams (Citation2007) using hydrogen (before dual-isotope analysis was common) showed fractionation throughout the root water uptake pathway, i.e. +3 to +9‰ fractionation of δ2H recorded in 12 xerophytic species. Similarly, Lin and Sternberg (Citation1993) used a greenhouse hydroponic system experiment to show significant depletion of δ2H of about 10–11‰ in stem water relative to the source water in a salt-excluding halophyte tree species, and about 3‰ in a salt-secreting species (Avicennia germinans).
More recent work by Zhao et al. (Citation2016) showed remarkable δ2H differences (up to 26.4‰) between xylem sap and twig water, core water and root tissue water. Similarly, Poca et al. (Citation2019) tested the effect of mycorrhizal fungi on the xylem water isotopic signal and reported a significant depletion for both δ2H (up to −24.6‰) and δ18O (up to −2.9‰) isotopes in xerophytic Acacia caven. Barbeta et al. (Citation2020), in a recent glasshouse experiment using potted beech saplings, found a δ2H depletion of stem water compared to soil water under wet conditions when soil was maintained at field capacity (i.e. control treatment). Conversely, a progressive δ2H enrichment of stem water compared to soil water was observed during the drought treatment.
It appears that some plant species do show evidence of fractionation during stem transport, but there is also the issue of potential alteration of the original isotopic signal of water samples associated with the methods used for the extraction of soil and plant water (Millar et al. Citation2018, Citation2019, Penna et al. Citation2018). Despite the technological advancements in isotope analysis and water extraction methods, testing isotopic fractionation in soil and plant materials is still challenging due to several problems such as physicochemical soil properties (Orlowski et al. Citation2018b, Barbeta et al. Citation2020), soil water content (Oerter et al. Citation2014, Orlowski et al. Citation2018a), and extraction times and temperature leading to incomplete water extraction (Orlowski et al. Citation2013, Citation2016a, Gaj et al. Citation2017). Moreover, for plant materials, the likelihood of coextraction of various organic compounds can affect isotopic analysis performed by laser spectroscopy (West et al. Citation2010, Martín-Gómez et al. Citation2015, Millar et al. Citation2018). A clear example of these challenging issues is reported by Orlowski et al. (Citation2018a), who carried out an interlaboratory comparison of soil water extraction methods and found large differences in the isotopic composition of water extracted through the same method from identical soil samples by different laboratories.
Henceforth, there is clearly a need for more experiments to test whether tree species show or do not show fractionation associated with transpiration. One issue is that in open field conditions there are often too many variables and interactions to rule in or out the cause of transpiration fractionation for a certain species. Secondly, there are the conflating issues of extraction. Does one laboratory’s extraction system show something different than that of another laboratory? At present, we are yet unaware of any plant water uptake studies comparing the isotopic composition of plant water extracted by various cryogenic vacuum distillation systems developed in different laboratories.
Here we present a simple experiment in a glasshouse to quantify the isotopic fractionation of plant water source along the transport pathway and to examine the possible effects of the extraction method. Given the recent explosion of studies showing fractionation associated with transpiration, we hypothesized that plant water undergoes fractionation during uptake and transport from roots to twigs pathway and that this effect is not compromised by cryogenic extraction in different laboratories. We used local tap water and labelled water to irrigate two olive trees (Olea europaea), an evergreen tree species commonly cultivated in the Mediterranean region. Then, we extracted replicate samples of plant tissues and soils via cryogenic vacuum distillation systems developed in two different laboratories (to test for any confounding or conflating effects on our analysis). We then compared the isotopic compositions of irrigation water with plant water extracted from different tissues (i.e. twigs along branch; wood cores along the trunk and roots) and soil water extracted from various depths.
2 Material and methods
2.1 Set-up of the experiment
Two 6-year-old olive trees (O1 and O2), 0.06 m in diameter and 1.9 m in height, were placed in a glasshouse managed by the Department of Land, Environment, Agriculture and Forestry of the University of Padova (Italy). The trees were positioned in a 70 L drainage pot () containing a soil mixture of 80% sandy loam and 20% pumice. Both pots were tightly covered with transparent plastic film to minimize evaporation from the soil surface. Three holes were left on the top of the pot, covered with aluminium foil, for recording daily soil moisture and irrigating the plants. Plant readily available water was calculated based on soil texture (Allen et al. Citation1998). For the two olive trees, potted in a soil mixture of sandy loam and pumice and with a rooting depth of 0.35 m, the total adjusted plant readily available water was approximately 21 mm. Shallow soil moisture (0–6 cm depth) measurements were taken manually twice a day for seven weeks using a soil moisture probe (ML2x type 2 Thetaprobe, Delta-T devices Cambridge, UK) at three locations in each pot; at the end of the experiment soil moisture readings were calibrated for specific soil type. The two pots were also equipped with two tension lysimeters (15 and 30 cm depth) to extract gravity-drained soil water. A vacuum of about 60 kPa was applied to the lysimeters for at least one hour before the collection of soil water each time. Four drainage holes were present at the bottom of each pot to measure the volume of drained irrigation water. The bottom outflow, flushed down from the drainage holes and collected in a plate placed underneath, ranged between 10 and 400 mL during the irrigation rounds.
Figure 1. Sketch of the experimental set-up for each olive tree, including sap flow sensors, tension lysimeters, and holes for irrigation and soil moisture measurements
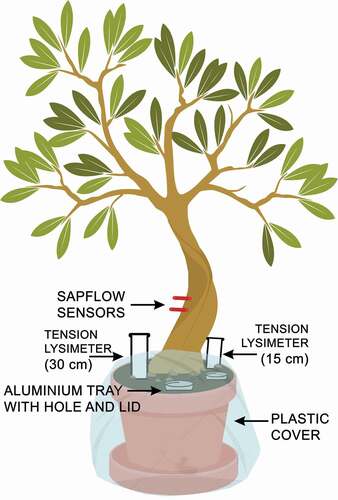
Thermal dissipation sap flow sensors (Granier Citation1985) were installed in both stems to record sap flow rate at five-minute intervals (). Air temperature, relative humidity and global solar radiation were measured at five-minute intervals by a weather station installed inside the glasshouse, 1 m from the two olive trees. Temporal dynamics of sap flow, air temperature, relative humidity and solar radiation were used to infer the evapotranspiration temporal dynamics throughout the experiment. The experiment lasted seven weeks. The period was split into a two-week conditioning period beginning 14 May 2018 when the plants were irrigated with tap water, followed by a five-week period during which both plants were irrigated with labelled water.
2.2 The tracer experiment and sample collection
The two olive trees were irrigated with local tap water (δ2H: −52.3‰ (average) ± 1.8‰ (standard deviation), δ18O: −7.97‰ ± 0.77‰, n = 3) during the set-up of the experiment (from 17 April until 13 May 2018) and the conditioning period (14–27 May 2018; ). During the conditioning period the two olive trees were irrigated with 3 L (i.e. 12.6 mm) of tap water every two days.
Table 1. Number of samples collected throughout the sampling rounds during the set-up, the conditioning period, and the experiment. Samples were grouped based on their type, olive tree (O1 and O2), and laboratory for soil and plant water extractions
On the first day of the experiment (28 May 2018), 5 L (i.e. 21 mm) of labelled water (δ2H: −93.3‰ ±1.8‰, δ18O: −12.75‰ ± 0.50‰, n = 4; ) was added to each pot. The amount of water was increased subsequently from 3 to 5 L during the experiment due to the high transpiration rates. Five litres of labelled water were provided to each plant on Monday, Wednesday and Friday each week until the end of the experiment. The total amount of water added to each plant per week was 15 L. The labelled water was much more depleted in heavy isotopes compared to the tap water (difference of around −41‰ and almost −5‰ for δ2H and δ18O, respectively). The average d-excess of tap water was 11.4 ± 4.4 (n = 3), and that of the labelled water was 8.7 ± 3.3 (n = 4).
Table 2. The isotopic compositions (mean ± standard deviation) of tap water and labelled water used for irrigation
Soil and vegetation samples were taken at the end of each week during the conditioning period and the experiment (). Replicate samples of twigs were collected along the entire length of each selected branch (see Supplementary material, Figure S1) and debarked quickly before being stored. Soil cores (at three different depths, i.e. 0–5, 5–15 and 15–25 cm) and roots (at the end of the experiment) were also collected. All the samples were stored in 12 mL Labco Exetainer® glass vials (Labco Ltd, Lampeter, UK). At the end of the experiment (6 July 2018) additional soil and plant samples were retrieved completely from O1 while the usual sampling was carried out from O2 (considered a replicate). The materials collected after completely cutting down O1 included debarked twigs, roots and wood cores (at four different sections along the entire length of the trunk, i.e. close to the ground, at 0.8 m, at 1.2 m, and close to the crown at 1.7 m). For wood core sampling, a manual tree borer was first used, but the olive wood was hard and therefore, to avoid any evaporation of the wood sections we used the following method instead: the trunk was first cut into four sections at the defined heights and debarked, and then cores were immediately extracted by cutting each of the sections horizontally with a woodcutter tool. Irrigation water samples were collected from the tap water and labelled water at the beginning and the end of the conditioning period and the experiment. All the samples were stored in a refrigerator until analysed.
2.3 Soil and plant water extraction by cryogenic vacuum distillation
The extraction of soil water (except for that collected with tension lysimeters) and plant water was carried out by cryogenic vacuum distillation performed in two different laboratories, at the Faculty of Science and Technology, Free University of Bozen-Bolzano (Italy) (Lab 1), and the Global Institute for Water Security, University of Saskatchewan (Canada) (Lab 2). Both laboratories adopted the cryogenic vacuum distillation system developed by Koeniger et al. (Citation2011). The cryogenic extraction apparatus comprised a pair of Labco Exetainer® vials (12 mL each) serving as independent extraction-collection units, connected by a thin stainless steel capillary tube (2.00 × 0.95 mm) (). The first step after the preparation of the extraction-collection vial unit for each sample was to freeze the sample vials by immersing them in liquid nitrogen (approx. −196°C) to prevent the loss of water vapour during evacuation. Prior to heating the sample vials for water extraction, the collection vials were evacuated to a baseline vacuum pressure. Samples were then loaded in an aluminium block and heated to a temperature of 200°C. All the individual soil and plant samples were extracted at a temperature of 200°C for an extraction time of 15 min per sample. After the water in the sample had been quantitatively transferred to the collection vial, the vials were removed from the cold trap, defrosted in perfect sealed conditions at room temperature, wrapped tightly with Parafilm®, labelled and stored in a refrigerator until the isotopic analysis. During the cryogenic extraction process in both labs, soil and plant samples were weighed pre- and post-water extraction and after the oven-drying (24 h, at 100°C) for the computation of extraction efficiencies. We found no differences between the post-extraction weights and post-oven-drying weights of all the extracted samples. We obtained average extraction efficiencies of 99.9% (soil, n = 83) and 99.5% (plant, n = 99) in Lab 1 and 99.9% (n = 73) and 99.7% (n = 105) in Lab 2 for all the extracted samples.
Figure 2. Cryogenic vacuum distillation system in Lab 1 (a) and Lab 2 (b)
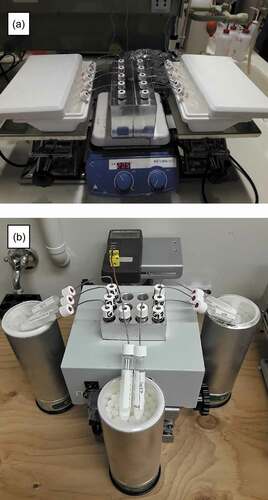
Both cryogenic extraction systems (Lab 1 and Lab 2; ) were based on the same design and had the same characteristics. However, differences were observed in handling amounts of soil and plant materials considered for extraction, vacuum pressure, calculations of extraction efficiencies, post-extraction filtering method for soil and plant water extracts, and cleaning of capillary tubes. The collections vials in Lab 1 were evacuated to a pressure of 0.1 kPa but to 87.0 Pa in Lab 2. In Lab 2 the post-extraction filtrations of plant water samples were carried out on 0.45 μm Nylon disk filters and the filtered samples were always transferred to 2 mL amber glass vials covered by polypropylene screw-thread caps with septa and sealed tightly with Parafilm®. In contrast, no filtration was done for plant water samples extracted in Lab 1.
For the subsequent rounds of extraction, the capillary tubes were cleaned each time with acetone and dried on a hot plate in Lab 1. In Lab 2, before the next round of cryogenic extraction, the capillary tubes were cleaned firstly by blowing air, and then left in a mixture of water and sulphuric acid (50%) over a vibrating platform (Fisher Scientific, Hampton, USA) for 40 min, and then oven dried for 1–2 h.
2.4 Isotopic and data analyses
The isotopic composition (δ2H and δ18O) of all the plant water samples was measured by IRMS at InnoTech Alberta (Edmonton, Canada), while soil water and irrigation water samples (both tap and labelled water) were transferred to the Faculty of Science and Technology (Free University of Bozen-Bolzano, Italy) for isotopic analysis via Picarro isotope analyser (cavity ring-down spectroscopy method, model L2130-i, manufactured by Picarro Inc., USA). Between-sample memory effects were minimized through the procedure described by Penna et al. (Citation2012). The analytical uncertainty of the laser spectroscope was 0.20‰ and 1.0‰ for δ18O and δ2H, respectively (Marchina et al. Citation2020).
The δ2H of plant water samples was determined using a Delta V™ advantage (Thermo Fisher Scientific, Waltham, MA, US) mass spectrometer and an HDevice peripheral. A CTC Analytics autosampler injected the water sample (1 µL) into an HDevice septum, and a dual inlet peripheral produced H2 gas from H2O using chromium metal at 900°C (Morrison et al. Citation2001). The H2 gas of the water sample was introduced into the mass spectrometer by dual inlet bellows, and the isotopic composition was measured relative to pure hydrogen gas. The accuracy of the δ2H measurements was ± 1‰. The δ18O of plant water samples was determined using a Delta V advantage mass spectrometer and GasBench II peripheral. Samples were equilibrated in sealed vials and flushed with CO2 (0.3%). As a result, the oxygen in the water sample was exchanged with the oxygen of CO2. A CTC Analytics autosampler sampled the headspace onto the GasBench II, where multiple injections of the sample oxygen (as CO2) were measured versus a pure CO2 gas. The accuracy of the δ18O measurements was ± 0.2‰. All the resulting isotopic compositions were reported vs Vienna Standard Mean Ocean Water (VSMOW). A more detailed description of this methodology can be found in Nelson (Citation2000).
All the plant and soil water isotopic data (both δ2H and δ18O) were tested for normality. Thereafter, Kruskal-Wallis one-way analysis of variance test (significance level at .05) was performed to assess the differences in the isotopic composition of plant and soil water across different plant tissues and soil water depths. Subsequently, the Dunn multiple comparison test was used to determine which groups were significantly different (p < .05).
The deuterium excess (d-excess) for both soil and plant water samples was computed following (Dansgaard Citation1964):
To assess the differences in the isotopic compositions of plant and soil water samples determined at Lab 1 vs. Lab 2, Z-scores were computed for each paired sample and isotope (Orlowski et al. Citation2016b), as follows:
where Lab1 is the δ18O or δ2H value of the samples extracted cryogenically in Lab 1, Lab2 is the δ18O or δ2H value of the Lab 2 extracted samples, and SD is the typical standard deviation of the measurements performed by the IRMS (1 and 0.20 for δ2H and δ18O, respectively, and Picarro (1 and 0.20 for δ2H and δ18O, Penna et al. Citation2010, Citation2012). Based on Orlowski et al. (Citation2016b), for a Z-score < 2, the difference between the cryogenic extraction systems was considered acceptable; for 2 < Z-score < 5, the difference was considered questionable; and for a Z-score > 5 the difference was defined as unacceptable.
3 Results
3.1 Time series of meteorological variables, sap flow and shallow soil moisture
The average relative humidity inside the glasshouse was 48% (with diurnal changes from 18% to 83%), and the average temperature was 29°C (with mean daily temperatures ranging between 22°C and 33°C; ).
Figure 3. Time series of environmental variables measured in tree 1 (O1) and tree 2 (O2). The average soil moisture (%) is shown with error bars representing the minimum and maximum values. The vertical dashed pink line marks the start of the experiment with labelled water
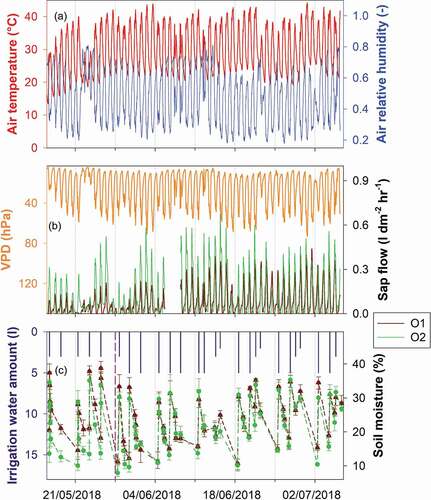
Sap flow rates for the two trees were quite similar, with a maximum sap flow of about 0.68 L dm−2 h−1 (in O2) while the minimum sap flows were close to zero at night when the transpiration was null (). However, some differences were observed in the diurnal patterns of sap flow of the two trees. The sap flow monitored in O2 was more stable during the entire period compared to O1 (). Daily sap flow dynamics were very pronounced for both plants, indicating that they were transpiring efficiently throughout the duration of the experiment. During the conditioning period, we observed that shallow soil moisture slightly differed in the two pots, with O1’s surface soil having higher moisture than the soil of O2 (). However, during the experimental period the measured soil moisture was much more similar in the two pots. Shallow soil moisture showed clear temporal dynamics of wetting up due to the input of irrigation water and then drying down until the following irrigation application.
3.2 Isotopic response of soil and plant water to the labelled water
At the end of the conditioning period, δ2H and δ18O values of cryogenically extracted soil water (CVD-Soil) and plant water were similar to the isotopic signature of tap water, but some samples (particularly CVD-Soil) remained enriched in heavy isotopes relative to tap water (
Figure 4. Time series of δ18O (panels a–d) and δ2H (panels e–h) of soil and plant water for samples extracted in the two laboratories. CVD-Soil represents the cryogenically extracted soil water, while LYS-Soil is the gravity-drained soil water obtained via tension lysimeters. The two horizontal dotted lines with their respective bands indicate the average and the standard deviation, respectively, of the isotopic composition of tap water (grey), and labelled water (pink). The vertical dashed pink line marks the start of the experiment with labelled water
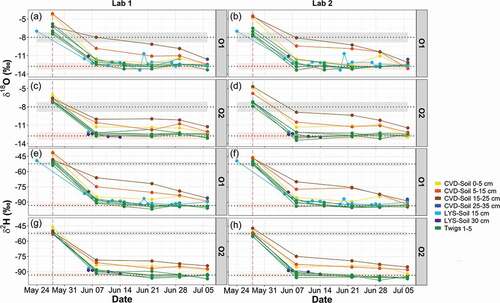
Figure 5. Time series for d-excess determined in soil and plant water for samples extracted in the two laboratories. CVD-Soil represents the cryogenically extracted soil water, while LYS-Soil is the soil water obtained via tension lysimeters. The two horizontal dotted lines with their respective bands indicate the average and the standard deviation, respectively, of the isotopic composition of tap water (grey), and labelled water (pink). The vertical dashed pink line marks the start of the experiment with labelled water
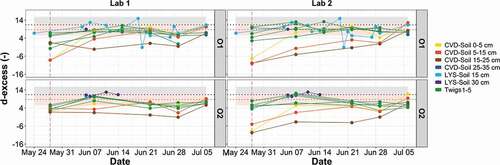
Figure 6. Dual-isotope plots of different plant tissues water (twigs, cores and roots), and soil water samples extracted by cryogenic vacuum distillation (CVD-Soil) and tension lysimeters (LYS-Soil). The global meteoric water line (GMWL) is plotted in black, round symbols indicate soil and plant water samples of O1 and triangle symbols represent soil and plant water samples of O2. Sample size is given in the Supplementary material, Table S3
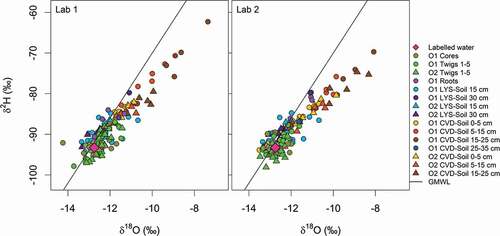
Figure 7. The spatial variation of δ18O and δ2H of plant water from various tissues, and soil water at different depths (LYS-Soil and CVD-Soil), for O1 during the tracer experiment. The vertical dotted line with grey band indicates the isotopic composition of labelled water (mean ± standard deviation)
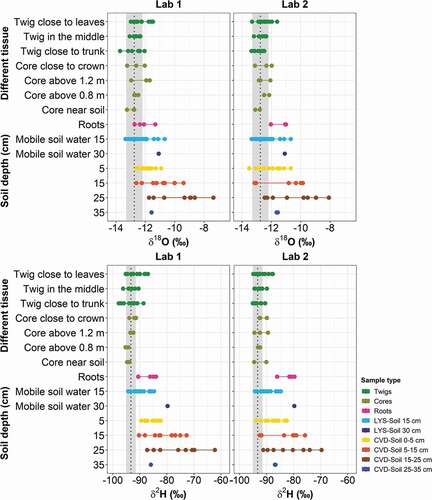
Figure 8. The spatial variation of d-excess of plant water from various tissues, and soil water at different depths (LYS-Soil and CVD-Soil), for O1 during the tracer experiment. The vertical dotted line with grey band indicates the isotopic composition of labelled water (mean ± standard deviation)
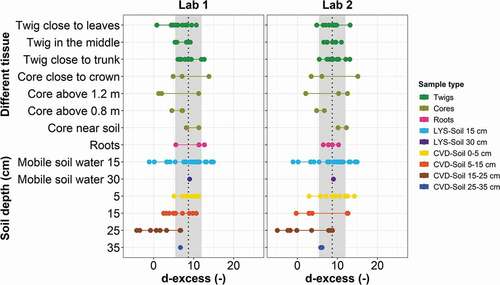
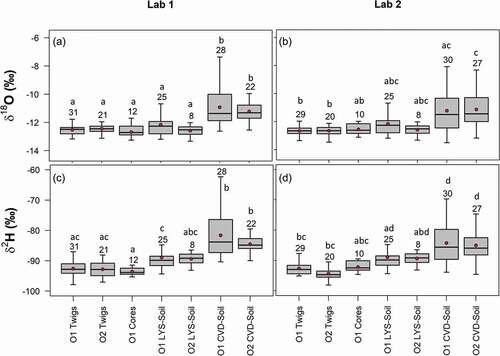
Figure 9. Box plots of (a, b) δ18O and (c, d) δ2H of O1 and O2 samples grouped by plant and soil water types for the sampling rounds irrigated with labelled water. The boxes indicate the 25th and 75th percentiles, while the whiskers represent the minimum and maximum values. The horizontal solid lines within the box mark the median and the red circles are the mean. Letters above the boxes represent the significantly different groups based on the Dunn post hoc analysis
One week into the labelling, plant water retrieved from twigs had a more negative isotopic composition than during the conditioning period, and it plotted (both δ2H and δ18O) close to or together with the labelled water (). In contrast to soil water, little difference was found in the isotopic composition of plant water for the two olive trees (see Table S2). During the experiment, the absolute differences in the median isotopic composition of CVD-Soil water in the O1 and O2 pots were 0.69‰ (δ18O) and 2.7‰ (δ2H) (Table S2). Absolute differences in the median isotopic composition of plant water collected from twigs of O1 and O2 and extracted in Lab 1 were 0.04‰ (δ18O) and 0.1‰ (δ2H) (Table S2).
Soil water extracted by tension lysimeters (LYS-Soil) showed temporal dynamics in the isotopic composition quite similar to that of plant water. The only exception was one LYS-Soil sample collected on 20 June 2018, which was enriched in heavy isotopes compared to labelled water (). Unlike plant water and gravity-drained soil water, the cryogenically extracted soil water sampled at different depths was not as depleted in heavy isotopes as the labelled water. The isotopic composition of CVD-Soil water varied greatly at different depths after the start of the experiment, and it was more similar to the labelled water towards the end of the experiment. For soil water extracted in Lab 1, throughout the experiment, more negative values of median δ18O (–11.88‰ in O1 and −11.53‰ in O2) and median δ2H (–86.3‰ in O1 and −85.4‰ in O2) were observed for soil water taken at 0–5 cm depth as compared to 15–25 cm (Table S2). The temporal dynamics of the CVD-Soil water isotopic compositions during the experiment were quite similar for O1 and O2 ( and 5).
The d-excess values () showed that most of the plant water samples (e.g. twig water taken at different sections) fell within the range of tap water (Table S1) and labelled water (Table S2) thus providing evidence that no isotopic fractionation occurred in the twig water samples throughout the experiment. Conversely, cryogenically extracted soil water (CVD-Soil) samples at 15–25 cm depth had negative d-excess (), suggesting that the deep soil water had an evaporation signature compared to plant water.
3.3 Variability in the isotopic composition across plant tissues and soil water
Labelled water, plant water (twigs, cores and roots) and gravity-drained soil water (LYS-Soil) plotted on or close to the global meteoric water line (GMWL) in the dual isotope space, whereas most of the CVD-Soil water at >15 cm depths plotted below and to the right of the GMWL ( and Table S3).
The isotopic composition of wood core samples obtained at different sections along the trunk, and of the twigs taken close to the leaves, middle of the branch and trunk of O1 ( and Table S4), was very similar to the isotopic composition of the labelled water and gravity-drained soil water (LYS-Soil), while few root water samples and cryogenically extracted soil water samples collected at depths below 15 cm showed some differences. Small differences were observed in δ18O (ranges up to 1.67‰ (twigs), 1.55‰ (wood cores) and 1.42‰ (roots)) and δ2H (ranges up to 9.2‰, 3.9‰ and 6.6‰) of the plant water extracts (). Conversely, LYS-Soil and CVD-Soil at different depths showed large variability in isotopic composition; ranges in δ18O were 1.68‰ (CVD-Soil, 0–5 cm), 3.22‰ (CVD-Soil, 5–15 cm), 4.39‰ (CVD-Soil, 15–25 cm) and 2.67‰ in LYS-Soil at 15 cm while ranges in δ2H were 7.3‰, 17.3‰, 24.9‰ and 9.6‰, respectively ().
The d-excess values of plant water samples (i.e. twigs, core and root water) were close to those of the labelled water (). In particular, the d-excess values showed no enrichment of plant water and soil water except for few soil samples (i.e. CVD-Soil at >15 cm depths) ().
Results of Kruskal-Wallis one-way analysis of variance showed no significant differences in the isotopic composition of plant water samples (for both δ2H and δ18O at p > 0.05). Specifically, the isotopic compositions were similar for the twigs and between the wood core water samples taken at different heights along the trunk. However, significant differences were found between plant water (twig, core), cryogenically extracted soil water samples (CVD-Soil) and gravity-drained soil water (LYS-Soil) (Kruskal-Wallis one-way analysis of variance, p < .001 for both δ18O and δ2H). Dunn post hoc analysis revealed that twig water, core water and gravity-drained soil water were significantly different from cryogenically extracted soil water samples (). Moreover, for the soil water samples δ2H enrichment was more evident compared to δ18O for both Lab 1 and Lab 2 ().
3.4 Differences in the isotopic composition of soil and plant water cryogenically extracted in the two laboratories
δ2H and δ18O of plant water and soil water extracted by cryogenic vacuum distillation in the two laboratories showed similar patterns (). CVD-Soil samples at 5–15 and 15–25 cm were more enriched in heavy isotopes than all the other plant samples (i.e. wood core, twig, and root), and they plotted on the right side of the GMWL, highlighting a distinct evaporation signature (). Slope values were close to 1 for both δ2H and δ18O of plant and soil water samples (), showing that the isotopic compositions of the samples cryogenically extracted in two laboratories were quite similar.
Table 3. Slopes and intercepts of the linear regressions between δ18O, δ2H and d-excess of plant tissue water and soil water of Lab 1 vs. Lab 2. Lab 1 is plotted along the x-axis while Lab 2 is plotted along the y-axis. All values are in ‰
Plant water maintained an isotopic composition similar to the labelled water throughout the experiment and similar values were obtained for the two labs; the median δ18O of plant water taken from twigs was −12.49‰ (Lab 1) and −12.67‰ (Lab 2), while the median δ2H was −92.8‰ and −93.0‰. The temporal dynamics of the plant water isotopic composition were quite similar for O1 and O2 and for the samples extracted in the two laboratories; δ18O values of plant water taken from twigs were −13.72‰ (minimum) and −11.48‰ (maximum) in Lab 1 and −13.47‰ and −11.61‰ in Lab 2, while δ2H values were −97.8‰ and −87.0‰ in Lab 1 and −98.1‰ and −87.7‰ in Lab 2, respectively.
Our results revealed similarities between Lab 1 and Lab 2 in the isotopic composition (both δ2H and δ18O) of soil water (Wilcoxon signed-rank test, p > .10 for both δ18O and δ2H) and plant water (Wilcoxon signed-rank test, p > .10 for both δ18O and δ2H) at the end of the experiment. The isotopic composition of plant water extracted from different tissues (i.e. wood cores, twigs and roots) and soil water from shallow soil depths (CVD-Soil at 0–5 cm and 5–15 cm) obtained by the cryogenic extraction system developed at Lab 1 was comparable to that of Lab 2.
When considering d-excess (), similar trends were observed for plant and soil water samples, i.e. there was no significant effect of the extraction method developed in the two laboratories on the sample d-excess (p > .05 for soil and p > .10 for plant water, Wilcoxon signed-rank test). d-excess varied among the samples; deep CVD-Soil samples at 5–15 and 15–25 cm depths had negative d-excess, particularly at the end of the conditioning period, with median d-excess values of soil water at 5–15 cm depth being −8.2 (O1) and 3.9 (O2) for analyses at Lab 1, while they were −10.1 (O1) and −5.0 (O2) for analyses at Lab 2. A marked evaporation signature was found only for CVD-Soil samples collected at 15–25 cm depth and for the extractions carried out in Lab 2 (Table S2). The comparison of different sample types of O1 and O2 between Lab 1 and Lab 2 showed that the plant water (i.e. twig and core) was isotopically different from cryogenically extracted soil water (CVD-Soil) samples (, different groups were found by Dunn post hoc analysis), and a similar pattern was found for the two laboratories ().
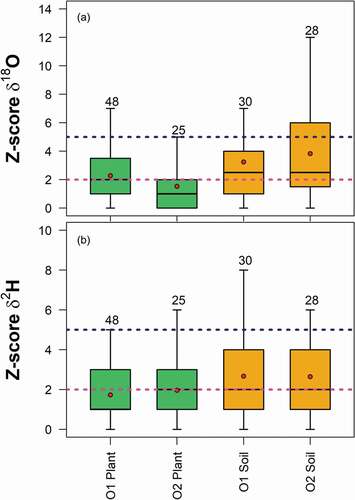
The Z-score analysis () showed that generally, the median of the differences between Lab 1 and Lab 2 in terms of δ18O and δ2H values of plant water and δ2H values of soil water fell within the pre-defined acceptable range of Z-scores < 2; the only exception was observed for δ18O values of soil water. Overall computed Z-scores values were smaller for plant water isotopic values than for soil water (). Nonetheless, Z-scores for both δ18O and δ2H of plants and most of the soil plotted below the limit for questionable (Z-score = 5) differences between the two cryogenic vacuum extraction systems, thus indicating small differences in δ18O and δ2H of the soil and plant water extracted from Lab 1 and Lab 2.
Figure 10. Dimensionless Z-scores values for (a) δ18O and (b) δ2H grouped by cryogenically extracted soil water (CVD-Soil), and plant water (samples from twigs, cores and roots were grouped together) of O1 and O2. Sample size is reported above the boxes. The boxes indicate the 25th and 75th percentiles, while the whiskers represent the minimum and maximum values. The horizontal solid lines within the box mark the median and the red circles are the mean, respectively. The dashed purple and pink lines represent the upper limits for acceptable (Z-score = 2) and questionable (Z-score = 5) differences respectively, between Lab 1 and Lab 2 cryogenically extracted samples
4 Discussion
4.1 Fractionation issues compared to previous controlled experiments
Our main finding from this simple glasshouse experiment was that there was no evidence of fractionation during transpiration. Wood cores that were taken at different sections of the trunk, and the twigs of the two olive trees, showed no significant differences in isotopic composition; all samples reflected the composition of the labelled water. Findings from previous controlled experiments were highly equivocal in terms of the assumption of “no fractionation.” Our results are in agreement with previous research (although that research was based on the application of δ2H only) by Dawson and Ehleringer (Citation1991), who reported no isotopic fractionation in a study carried out with Acer negundo in pots. Similarly, Walker and Richardson (Citation1991) reported no isotopic fractionation with potted plants (barley and a range of native species). Thorburn et al. (Citation1993) showed that under controlled environmental conditions (i.e. in a laboratory and greenhouse set-up), there was no isotopic fractionation in plant water collected from Eucalyptus spp. More recently, Newberry et al. (Citation2017) found that the isotopic composition of xylem water extracted from Salix viminalis cuttings reflected that of soil water quite well, except for a small offset in δ18O in a greenhouse study. Conversely, other studies, such as those of Lin and Sternberg (Citation1993) and Ellsworth and Williams (Citation2007), observed isotopic fractionation involving 2H in water extracted from plant tissues of some halophytes and xerophytes. Our results also contrast with the marked fractionation in 2H found recently by Vargas et al. (Citation2017) and by Poca et al. (Citation2019). Our results are also in disagreement with Barbeta et al. (Citation2020) who reported marked depletion, as well as enrichment of stem water δ2H compared to soil water under different water regimes (i.e. control and drought treatment). Barbeta et al. (Citation2020) explained that the δ2H depletion of stem water compared to the soil water when watered regularly (control treatment) was due to depleted storage water in the xylem tissue as compared to the sap (i.e. vessel water). The depletion of stem water δ2H became more pronounced when storage water mixed with vessel water during low transpiration rates. However, Barbeta et al. (Citation2020) found justification for more negative stem water δ2H, in contrast with the explanation of Vargas et al. (Citation2017) who attributed stem water δ2H depletion to the soil evaporation and isotopic discrimination during uptake by roots.
4.2 Why do olive tree data show no fractionation?
Our results showed no fractionation of transpired stem water. The current results are similar to the recent work by Nehemy et al. (Citation2020) who reported no differences across the xylem samples taken at different sections of stem.
Why did our olive trees show no sign of fractionation with transpiration? One immediate answer might be that they are small, indoors and have a very short transit time from roots to shoots. But greenhouse experiments with even younger fast-transpiring trees have found fractionation associated with transpiration. For instance, Vargas et al. (Citation2017) used two-year old seedling trees of avocado (Persea americana) in an 18.9 L pot and found depletion of both δ18O and δ2H in stem water. Poca et al. (Citation2019) tested for isotopic fractionation by treating a plant seedling (Acacia caven) with mycorrhizal fungi in a 0.5 L pot and also found significant depletion of both δ18O and δ2H. Barbeta et al. (Citation2020) placed one-year old tree saplings of Fagus sylvatica, with a stem diameter of 21 mm, in 3.5 L pots and found that stem water was more depleted in δ2H compared to soil water. By comparison, our 6-year-old Olea europaea trees were both older and in larger (70 L) pots. Our soil moisture values (varying between 8 and 39%) were similar to those of Barbeta et al. (Citation2020), which ranged between 25 and 45% in their control treatment, but below the 10% water content values obtained in their drought treatment. Vargas et al. (Citation2017) reported soil moisture for different soil types ranging from approximately 23% to 27% (simulated rainy season) and from 19% to 23% (dry season), whereas in Poca et al. (Citation2019) soil moisture was 46 ± 1.5%. Furthermore, compared to Vargas et al. (Citation2017), Poca et al. (Citation2019) and Barbeta et al. (Citation2020), we must note that our labelled water was much more depleted in heavy isotopes than their irrigation water (roughly −93.3 vs ≈ 29.5‰, ≈ −25.9‰ and ≈ −35.3 in δ2H for Vargas et al. (Citation2017), Poca et al. (Citation2019) and Barbeta et al. (Citation2020), respectively), and we continually irrigated the two olive trees to avoid drought conditions. Based on our data, we have no evidence relating the observed lack of isotopic fractionation to the specific experimental conditions inside the glasshouse. In any case, if isotopic fractionation had occurred, we should have observed a clear depletion in δ2H compared to labelled water, as found by Zhao et al. (Citation2016), Vargas et al. (Citation2017), Poca et al. (Citation2019) and Barbeta et al. (Citation2020), and less positive d-excess values in water extracted from the various plant tissues compared to the labelled water.
Although our findings are in agreement with some literature reporting no isotopic fractionation in plant water, we observed differences between the isotopic composition of labelled water and soil water (CVD-Soil) deeper than 15 cm extracted by cryogenic vacuum distillation. However, gravity-drained soil water (Brantley et al. Citation2017) extracted by tension lysimeters (LYS-Soil) showed isotopic similarity with labelled water and plant water. It is interesting to note that these observations are in contrast to field-based studies where plant water showed isotopic signals more similar to the cryogenically extracted matrix soil water than to the gravity-drained soil water (Brooks et al. Citation2010, Hervé-Fernández et al. Citation2016). Based on our simple experiment, we can relate the observed similarity between LYS-Soil water and plant water to the environmental conditions inside the glasshouse, which led the two olive trees to preferentially take up gravity-drained soil water as compared to presenting the signature of matrix soil water linked to cryogenic extraction. As far as we know, this behaviour, which appears opposite to the so-called “ecohydrological separation” (McDonnell Citation2014), has not been observed elsewhere in natural conditions and should therefore be explored in more detail. The differences observed between the labelled water and deep soil water were largest one week after the start of the experiment and smallest during the last sampling (), indicating that there was a slow mixing between the depleted irrigation water and the water stored in the soil matrix close to the bottom of the pot. The observed differences between soil water extracted by tension lysimeters and cryogenic vacuum distillation at similar depths (15 cm) suggest different velocities in the water percolation and the likely presence of preferential flow pathways in the soil. Benettin et al. (Citation2019) also found slower isotopic changes in soil water in their lysimeter drainage water (which was strongly affected by preferential flow pathways). However, compared to their study, we found less isotopic fractionation of soil water and negligible fractionation of our collected drainage water (δ2H: −89.8‰ (average) ± 1.6‰ (standard deviation), δ18O: −13.06‰ ± 0.33‰, d-excess: 14.6 ± 1.2, n = 15). The greater isotopic fractionation of both soil and drainage water for Benettin et al. (Citation2019) was probably due to the exposure of surface-ponded water to evaporation. Geris et al. (Citation2015) found negligible differences between lysimeter-extracted gravity-drained soil water and water obtained through cryogenic vacuum distillation, hypothesizing that in the wet Scottish environments where they worked, soil water stored in smaller pores was more likely to exchange or mix with gravity-drained soil water.
Recent works on the application of cryogenic vacuum distillation for soil water extraction (e.g. Meißner et al. Citation2014, Orlowski et al. Citation2016a, 2016b; Fischer et al. Citation2019) suggest that we cannot totally exclude the possibility that the differences between the isotopic composition of soil water and the labelled water could be due to the cryogenic extraction method itself. Our results could have been different if we had used other extraction techniques like centrifugation, bag distillation or hydraulic squeezing. That said, our experimental soils had a low clay content – often the main factor in cryogenic extraction problems (Orlowski et al. Citation2018b).
Our results showed that root water samples collected at the end of the experiment had a more enriched isotopic composition (particularly in δ2H and for extractions carried out in Lab 2) than the labelled water but were similar to cryogenically extracted soil water (CVD-Soil). Overall, the isotopic composition of root water fell within the isotopic range of both CVD-Soil and LYS-Soil water whereas water extracted from twigs and cores plotted close to the depleted irrigation water ( and 7). These differences in the isotopic composition of plant water tissues can be explained by the fact that the sampled roots were not close to the percolation flows and did not take up the depleted gravity-drained soil water that we extracted by tension lysimeters, or shallow soil water extracted by cryogenic vacuum distillation. Our findings are in agreement with an earlier study by Thorburn et al. (Citation1993), who found that in Eucalyptus spp. trees, root water had an isotopic signature much more similar to soil water than to water extracted from twigs and concluded that the sampled roots were not taking up and transmitting significant quantities of water to the tree canopy. Our work suggests that even in a small 70 L pot system, the isotopic composition of water obtained from a few root samples may not be representative of the entire isotopic variability of the water taken up by the root system of an olive tree.
4.3 Effects of cryogenic vacuum distillation extraction on the isotopic composition of soil and plant water
Currently, cryogenic vacuum distillation is the most commonly applied method for the extraction of water samples from soils and plant tissues for isotopic analyses (Amin et al. Citation2020). Despite the popularity of cryogenic vacuum distillation, due to its low cost and relative ease of construction (e.g. Koeniger et al. Citation2011, Orlowski et al. Citation2013), this technique is still associated with much ambiguity regarding the extraction of a representative transpiration water pool (Penna et al. Citation2018, Beyer et al. Citation2020). For instance, Orlowski et al. (Citation2018a) found large differences in the retrieved isotopic composition of soil water extracted by cryogenic vacuum distillation systems developed in different laboratories. Millar et al. (Citation2018) compared various techniques for plant water extraction and observed that the cryogenic vacuum distillation generally produced water more depleted in δ2H and δ18O compared to other techniques.
Compared to previous research, our results show that water extracted from the various plant tissues in the two different laboratories had a statistically similar isotopic composition ( and 9), which was also similar to that of the labelled water, the soil water extracted by tension lysimeters, and the water extracted from shallow layers by cryogenic vacuum distillation (, 7 and 9). Although we observed some differences in sample handling, preparation and after-extraction filtering in the two laboratories involved in the comparison, we found no significant effect of the cryogenic system on the isotopic composition of either soil or plant water (). The observed small differences in the isotopic signature of the extracted soil water in the two laboratories ( and 10) could be related to the relatively wet conditions (mean soil moisture varying between 8 and 39%) and the soil type (80% of soil with a sandy loam texture, and 20% pumice), which was different from the more problematic clayey soils (Orlowski et al. Citation2018b).
4.4 Limitations of the study
Our findings contribute to answering the pressing questions surrounding fractionation issues during transpiration that are critical to consider in isotope-based studies of root water uptake (Vargas et al. Citation2017, Orlowski et al. Citation2018b). Nevertheless, we acknowledge some limitations associated with the experimental set-up that may impact the interpretation of the results.
Firstly, it is important to consider this study as a pilot experiment aimed at testing the isotopic fractionation of plant water sources during uptake and within the plant. We used two 6-year-old olive trees growing in 70 L pots. The reason for using large trees in pots was to mimic a field situation and to obtain enough plant samples through weekly sampling of twigs. However, managing issues with such large trees in potted conditions limited the number of experimental plants to two, and further work involving a larger number of trees is needed, to increase the sample size and overcome possible individual tree variability.
Secondly, the structure where we placed the potted trees was made of glass, which can make the internal environment even more extreme, especially when temperatures rise above 30°C. The purpose of keeping the plants in the glasshouse was to avoid any variation in the plant water source due to external environmental conditions (e.g. rain, wind). However, the average temperature of 29°C inside the glasshouse was not too high for olive tree species as they can tolerate very high temperatures and are normally cultivated in areas where temperatures range from 10 to 40°C (Lockwood Citation2009, Sebastiani Citation2018). Despite the very high-temperature conditions inside the glasshouse, the daily sap flow rates were very pronounced for the two olive trees, indicating that both trees were transpiring well throughout the entire duration of the experiment.
Thirdly, the practical difficulty in obtaining adequate root samples resulted in a relatively small number of samples that may not be representative of the entire root system of the olive trees. This could limit the assessment of any possible differences between root water and xylem water isotopic composition. However, an observed rapid change in the isotopic signature of plant water (i.e. twig and wood core water) which matched almost identically with the irrigation water, gravity-drained soil water and cryogenically extracted matrix soil water at shallow soil depths indicates that the isotopic mismatch of root water is likely due to root water isotopic variability and the sample replicates and not the isotopic fractionation during water uptake at the soil–root interface (Thorburn et al. Citation1993).
Finally, the likely short transit time from roots to leaves in our young potted trees might be the reason for the negligible fractionation we observed. In forest trees, however, the time lag between root water absorption and transport to other plant parts is much longer; in fact, it can take days to weeks depending on the tree species (Brinkmann et al. Citation2018, Allen et al. Citation2019, Amin et al. Citation2020), making xylem water possibly more prone to fractionation. Thus, the results of our experiment yield some important conclusions, but further experimentation on other plant species under fully controlled environmental conditions (such as greenhouse hydroponic systems; Orlowski et al. Citation2018b) and in natural environments are needed to further test the working hypothesis of “no fractionation in plants.”
5 Conclusions and future research
We explored the variability of isotopic composition and possible isotopic fractionation in soil and plant water in a simple irrigation experiment carried out in a glasshouse, using water of known isotopic composition. We also tested the reliability of the cryogenic vacuum distillation systems developed in two different laboratories for the extraction of plant water for our isotopic analyses.
Our experiment showed that about one week after the start of the experiment, plant water extracted from twigs had an isotopic composition similar to that of labelled water used for irrigation. Unlike plant water and gravity-drained soil water (LYS-Soil), cryogenically extracted soil water (CVD-Soil) at depths below 15 cm reflected the signature of the labelled water only towards the end of the experiment, suggesting a slow mixing of irrigation water from the large to small pores. This behaviour also suggests that due to the conditions inside the glasshouse, plants were preferably taking up gravity-drained soil water rather than matrix soil water obtained cryogenically. Interestingly, this behaviour is opposite to what was observed in other studies that led to the development of the so-call “ecohydrological separation” hypothesis (McDonnell Citation2014, Brooks et al. 2020), and therefore deserves more experiments and tests.
We found isotopic differences between soil water extracted by tension lysimeters and cryogenic vacuum distillation at similar depths (at 15 cm), which suggest different velocities in the water percolation due to soil heterogeneity, even in pot conditions. At the end of the experiment, we did not observe a significant difference in the isotopic composition of water extracted from the different plant tissues (i.e. wood cores and twigs from different parts of the tree). The similar isotopic composition of plant water to that of the labelled water and the gravity-drained soil water, and the positive d-excess of plant water, leads us to conclude that no isotopic fractionation occurred during the root uptake and transport of water through the stem of the two olive trees. We further found no significant effect of the different cryogenic systems on the isotopic composition of both soil and plant water.
Despite the specified conditions, we were not able to resolve the mechanisms behind the isotopic differences in soil water deeper than 15 cm, compared to the labelled water. Even though recent studies performed under control conditions have reported that some plants do fractionate the transpired water, the isotopic fractionation during transpiration could be tree species-specific, or condition-specific. Our results, although obtained from only two trees of a single species, and under specific experimental and environmental conditions, add evidence to existing studies reporting no isotopic fractionation during water absorption and transport. Hence, we suggest that further research under controlled and natural conditions, and on different species, is needed, including testing other plants and soil water extraction methods.
Research contribution
Such research performed with tree species, under specific experimental conditions, is crucial for future applications of stable isotopes in ecohydrological studies because it tests the basic underlying assumption of “no isotopic fractionation” of water by plants. Thus, it not only adds evidence to existing studies, but also highlights the need for further research on different species, including testing other plant-water extraction methods.
Supplemental Material
Download MS Word (694.5 KB)Acknowledgements
GZ and CM acknowledge the financial support provided by Fondazione Cassa di Risparmio di Padova e Rovigo (Italy) (research project “Ecohydrological Dynamics and Water Pathways in Forested Catchments,” Bando Starting Grants 2015). AA, GZ, CM, DP and MB acknowledge the financial support provided by the Italian MIUR project (PRIN 2017) “WATer mixing in the critical ZONe: observations and predictions under environmental changes – WATZON” (project code: 2017SL7ABC). The authors thank Vinicio Carraro and Marco Stefenatti (University of Padova, Italy) for the technical support during the experiment. Kim Janzen and Cody Millar are thanked for the laboratory support at GIWS, University of Saskatchewan (Canada); Jason Frentress and Christian Ceccon are thanked for the supervision of the laboratory activities at the Free University of Bozen-Bolzano (Italy).
Disclosure statement
No potential conflict of interest was reported by the authors.
Supplementary material
Supplemental data for this article can be accessed here
Additional information
Funding
References
- Allen, R., et al., 1998. Crop evapotranspiration. FAO Irrigation and drainage paper 56. Irrigation and Drainage, 300 (56), 326.
- Allen, S.T., et al., 2019. Seasonal origins of soil water used by trees. Hydrology and Earth System Sciences, 23 (2), 1199–1210. doi:https://doi.org/10.5194/hess-23-1199-2019
- Amin, A., et al., 2020. Depth distribution of soil water sourced by plants at the global scale: a new direct inference approach. Ecohydrology, 13 (2), e2177. doi:https://doi.org/10.1002/eco.2177
- Barbeta, A., et al., 2019. Unexplained hydrogen isotope offsets complicate the identification and quantification of tree water sources in a riparian forest. Hydrology and Earth System Sciences, 23 (4), 2129–2146. doi:https://doi.org/10.5194/hess-23-2129-2019
- Barbeta, A., et al., 2020. An explanation for the isotopic offset between soil and stem water in a temperate tree species. New Phytologist, 227 (3), 766–779. doi:https://doi.org/10.1111/nph.16564
- Barbeta, A. and Peñuelas, J., 2017. Relative contribution of groundwater to plant transpiration estimated with stable isotopes. Scientific Reports, 7 (1), 10580. doi:https://doi.org/10.1038/s41598-017-09643-x
- Benettin, P., et al., 2019. Velocities, residence times, tracer breakthroughs in a vegetated lysimeter: a multitracer experiment. Water Resources Research, 55 (1), 21–33. doi:https://doi.org/10.1029/2018WR023894
- Beyer, M., et al., 2016. A deuterium-based labeling technique for the investigation of rooting depths, water uptake dynamics and unsaturated zone water transport in semiarid environments. Journal of Hydrology, 533, 627–643. doi:https://doi.org/10.1016/j.jhydrol.2015.12.037
- Beyer, M., Kühnhammer, K., and Dubbert, M., 2020. In situ measurements of soil and plant water isotopes: a review of approaches, practical considerations and a vision for the future. Hydrology and Earth System Sciences, 24 (9), 4413–4440. doi:https://doi.org/10.5194/hess-24-4413-2020
- Beyer, M. and Penna, D., 2021. On the spatio-temporal under-representation of isotopic data in ecohydrological studies. Frontiers in Water, 3, 643013. doi:https://doi.org/10.3389/frwa.2021.643013
- Brantley, S.L., et al., 2017. Reviews and syntheses: on the roles trees play in building and plumbing the critical zone. Biogeosciences, 14 (22), 5115–5142. doi:https://doi.org/10.5194/bg-14-5115-2017
- Brinkmann, N., et al., 2018. Employing stable isotopes to determine the residence times of soil water and the temporal origin of water taken up by Fagus sylvatica and Picea abies in a temperate forest. New Phytologist, 219 (4), 1300–1313. doi:https://doi.org/10.1111/nph.15255
- Brooks, J.R., et al., 2010. Ecohydrologic separation of water between trees and streams in a Mediterranean climate. Nature Geoscience, 3 (2), 100–104. doi:https://doi.org/10.1038/ngeo722
- Cernusak, L.A., Farquhar, G.D., and Pate, J.S., 2005. Environmental and physiological controls over oxygen and carbon isotope composition of Tasmanian blue gum, Eucalyptus globulus. Tree Physiology, 25 (2), 129–146. doi:https://doi.org/10.1093/treephys/25.2.129
- Dansgaard, W., 1964. Stable isotopes in precipitation. Tellus, 16 (4), 436–468. doi:https://doi.org/10.1111/j.2153-3490.1964.tb00181.x
- Dawson, T.E., et al., 2002. Stable isotopes in plant ecology. Annual Review of Ecology and Systematics, 33 (1), 507–559. doi:https://doi.org/10.1146/annurev.ecolsys.33.020602.095451
- Dawson, T.E. and Ehleringer, J.R., 1991. Streamside trees that do not use stream water. Nature, 350 (6316), 335–337. doi:https://doi.org/10.1038/350335a0
- Dawson, T.E. and Ehleringer, J.R., 1993. Isotopic enrichment of water in the “woody” tissues of plants: implications for plant water source, water uptake, and other studies which use the stable isotopic composition of cellulose. Geochimica et Cosmochimica Acta, 57 (14), 3487–3492. doi:https://doi.org/10.1016/0016-7037(93)90554-A
- Dudley, B.D., Graham, S.L., and Evison, R., 2017. Water sources for woody shrubs on hillslopes : an investigation using isotopic and sapflow methods. Ecohydrology, 11 (2), 1–11. doi:https://doi.org/10.1002/eco.1926
- Ellsworth, P.Z. and Williams, D.G., 2007. Hydrogen isotope fractionation during water uptake by woody xerophytes. Plant and Soil, 291 (1–2), 93–107. doi:https://doi.org/10.1007/s11104-006-9177-1
- Evaristo, J., et al., 2016. Insights into plant water uptake from xylem-water isotope measurements in two tropical catchments with contrasting moisture conditions. Hydrological Processes, 30 (18), 3210–3227. doi:https://doi.org/10.1002/hyp.10841
- Evaristo, J., et al., 2019. Characterizing the fluxes and age distribution of soil water, plant water, and deep percolation in a model tropical ecosystem. Water Resources Research, 55 (4), 3307–3327. doi:https://doi.org/10.1029/2018WR023265
- Evaristo, J., Jasechko, S., and McDonnell, J.J., 2015. Global separation of plant transpiration from groundwater and streamflow. Nature, 525 (7567), 91–94. doi:https://doi.org/10.1038/nature14983
- Fischer, B.M.C., et al., 2019. Mojito, anyone? An exploration of low-tech plant water extraction methods for isotopic analysis using locally-sourced materials. Frontiers in Earth Science, 7, 150. doi:https://doi.org/10.3389/feart.2019.00150
- Gaj, M., Kaufhold, S., and McDonnell, J.J., 2017. Potential limitation of cryogenic vacuum extractions and spiked experiments. Rapid Communications in Mass Spectrometry, 31 (9), 821–823. doi:https://doi.org/10.1002/rcm.7850
- Geris, J., et al., 2015. Ecohydrological separation in wet, low energy northern environments? A preliminary assessment using different soil water extraction techniques. Hydrological Processes, 29 (25), 5139–5152. doi:https://doi.org/10.1002/hyp.10603
- Granier, A., 1985. Une nouvelle methode pour la measure du flux de seve brute dans le tronc des arbres. Annales des Sciences Forestières, 42 (2), 193–200. doi:https://doi.org/10.1051/forest:19850204
- Hervé-Fernández, P., et al., 2016. Assessing the two water worlds hypothesis and water sources for native and exotic evergreen species in south-central Chile. Hydrological Processes, 30 (23), 4227–4241. doi:https://doi.org/10.1002/hyp.10984
- Horita, J., Rozanski, K., and Cohen, S., 2008. Isotope effects in the evaporation of water: a status report of the Craig-Gordon model. Isotopes in Environmental and Health Studies, 44 (1), 23–49. doi:https://doi.org/10.1080/10256010801887174
- Koeniger, P., et al., 2011. An inexpensive, fast, and reliable method for vacuum extraction of soil and plant water for stable isotope analyses by mass spectrometry. Rapid Communications in Mass Spectrometry, 25 (20), 3041–3048. doi:https://doi.org/10.1002/rcm.5198
- Lehmann, M.M., et al., 2018. The effect of 18 O-labelled water vapour on the oxygen isotope ratio of water and assimilates in plants at high humidity. New Phytologist, 217 (1), 105–116. doi:https://doi.org/10.1111/nph.14788
- Lin, G. and Sternberg, L., 1993. Hydrogen isotopic fractionation by plant roots during water uptake in coastal wetland plants. In: J.R. Ehleringer, A.E. Hall, and G.D. Farquhar, eds. Stable isotopes and plant carbon-water relations. San Diego, USA: Academic Press, 497–510. doi:https://doi.org/10.1016/B978-0-08-091801-3.50041-6
- Lockwood, R., 2009. Olives: crop production science in horticulture 18. 2009/09/18. Experimental Agriculture. Wallingford, UK: CABI Publishing. doi:https://doi.org/10.1017/S0014479709990342
- Marchina, C., et al., 2020. Alternative methods to determine the δ2H-δ18O relationship: an application to different water types. Journal of Hydrology, 587 (124951), 1–14. doi:https://doi.org/10.1016/j.jhydrol.2020.124951
- Martín-Gómez, P., et al., 2015. Isotope-ratio infrared spectroscopy: a reliable tool for the investigation of plant-water sources? New Phytologist, 207 (3), 914–927. doi:https://doi.org/10.1111/nph.13376
- McDonnell, J.J., 2014. The two water worlds hypothesis: ecohydrological separation of water between streams and trees? WIREs Water, 1 (4), 323–329. doi:https://doi.org/10.1002/wat2.1027
- Meißner, M., et al., 2014. Soil water uptake by trees using water stable isotopes (δ2H and δ18O)−a method test regarding soil moisture, texture and carbonate. Plant and Soil, 376 (1–2), 327–335. doi:https://doi.org/10.1007/s11104-013-1970-z
- Michener, R., and Lajtha, K., eds. 2008. Stable isotopes in ecology and environmental science. 2nd ed. Malden, MA: Blackwell Publishing.
- Millar, C., et al., 2018. A comparison of extraction systems for plant water stable isotope analysis. Rapid Communications in Mass Spectrometry, 32 (13), 1031–1044. doi:https://doi.org/10.1002/rcm.8136
- Millar, C., et al., 2019. Further experiments comparing direct vapor equilibration and cryogenic vacuum distillation for plant water stable isotope analysis. Rapid Communications in Mass Spectrometry, 33 (23), 1–2. doi:https://doi.org/10.1002/rcm.8530
- Morrison, J., et al., 2001. On-line high-precision stable hydrogen isotopic analyses on nanoliter water samples. Analytical Chemistry, 73 (15), 3570–3575. doi:https://doi.org/10.1021/ac001447t
- Nehemy, M.F., et al., 2020. Tree water deficit and source water partitioning. Hydrological Processes, 35, e14004. doi:https://doi.org/10.1002/hyp.14004
- Nelson, S.T., 2000. A simple, practical methodology for routine VSMOW/SLAP normalization of water samples analyzed by continuous flow methods. Rapid Communications in Mass Spectrometry?: RCM, 14 (12), 1044–1046. doi:https://doi.org/10.1002/1097-0231(20000630)14:12<1044::AID-RCM987>3.0.CO;2-3
- Newberry, S.L., Nelson, D.B., and Kahmen, A., 2017. Cryogenic vacuum artifacts do not affect plant water-uptake studies using stable isotope analysis. Ecohydrology, 10 (8), e1892. doi:https://doi.org/10.1002/eco.1892
- Oerter, E., et al., 2014. Oxygen isotope fractionation effects in soil water via interaction with cations (Mg, Ca, K, Na) adsorbed to phyllosilicate clay minerals. Journal of Hydrology, 515, 1–9. doi:https://doi.org/10.1002/eco.2083
- Orlowski, N., et al., 2013. Validation and application of a cryogenic vacuum extraction system for soil and plant water extraction for isotope analysis. Journal of Sensors and Sensor Systems, 2 (2), 179–193. doi:https://doi.org/10.5194/jsss-2-179-2013
- Orlowski, N., et al., 2018a. Inter-laboratory comparison of cryogenic water extraction systems for stable isotope analysis of soil water. Hydrology and Earth System Sciences, 22 (7), 3619–3637. doi:https://doi.org/10.5194/hess-22-3619-2018
- Orlowski, N., et al., 2018b. A simple greenhouse experiment to explore the effect of cryogenic water extraction for tracing plant source water. Ecohydrology, 11 (5), e1967. doi:https://doi.org/10.1002/eco.1967
- Orlowski, N., Breuer, L., and McDonnell, J.J., 2016a. Critical issues with cryogenic extraction of soil water for stable isotope analysis. Ecohydrology, 9 (1), 1–5. doi:https://doi.org/10.1002/eco.1722
- Orlowski, N., Pratt, D.L., and McDonnell, J.J., 2016b. Intercomparison of soil pore water extraction methods for stable isotope analysis. Hydrological Processes, 30 (19), 3434–3449. doi:https://doi.org/10.1002/hyp.10870
- Penna, D., et al., 2010. On the reproducibility and repeatability of laser absorption spectroscopy measurements for δ2H and δ18O isotopic analysis. Hydrology and Earth System Sciences, 14 (8), 1551–1566. doi:https://doi.org/10.5194/hess-14-1551-2010
- Penna, D., et al., 2012. Technical Note: evaluation of between-sample memory effects in the analysis of δ2H and δ18O of water samples measured by laser spectroscopes. Hydrology and Earth System Sciences, 16 (10), 3925–3933. doi:https://doi.org/10.5194/hess-16-3925-2012
- Penna, D., et al., 2018. Ideas and perspectives: tracing terrestrial ecosystem water fluxes using hydrogen and oxygen stable isotopes: challenges and opportunities from an interdisciplinary perspective. Biogeosciences, 15 (21), 6399–6415. doi:https://doi.org/10.5194/bg-15-6399-2018
- Penna, D., et al., 2020. Water sources for root water uptake: using stable isotopes of hydrogen and oxygen as a research tool in agricultural and agroforestry systems. Agriculture, Ecosystems & Environment, 291, 106790. doi:https://doi.org/10.1016/j.agee.2019.106790
- Poca, M., et al., 2019. Isotope fractionation during root water uptake by Acacia caven is enhanced by arbuscular mycorrhizas. Plant and Soil, 441 (1–2), 485–497. doi:https://doi.org/10.1007/s11104-019-04139-1
- Sebastiani, L., 2018. Abiotic stresses in olive: physiological and molecular mechanisms. Acta Horticulturae, 1199 (1199), 47–56. doi:https://doi.org/10.17660/ActaHortic.2018.1199.8
- Thorburn, P.J., Walker, G.R., and Brunel, J.P., 1993. Extraction of water from Eucalyptus trees for analysis of deuterium and oxygen-18: laboratory and field techniques. Plant, Cell & Environment, 16 (3), 269–277. doi:https://doi.org/10.1111/j.1365-3040.1993.tb00869.x
- Vargas, A.I., et al., 2017. Testing plant use of mobile vs immobile soil water sources using stable isotope experiments. New Phytologist, 215 (2), 582–594. doi:https://doi.org/10.1111/nph.14616
- Volkmann, T.H.M., et al., 2016. A method for in situ monitoring of the isotope composition of tree xylem water using laser spectroscopy. Plant, Cell & Environment, 39 (9), 2055–2063. doi:https://doi.org/10.1111/pce.12725
- von Freyberg, J., et al., 2020. Plant and root-zone water isotopes are difficult to measure, explain, and predict: some practical recommendations for determining plant water sources. Methods in Ecology and Evolution, 11 (11), 1352–1367. doi:https://doi.org/10.1111/2041-210X.13461
- Walker, C.D. and Richardson, S.B., 1991. The use of stable isotopes of water in characterising the source of water in vegetation. Chemical Geology, 94 (2), 145–158. doi:https://doi.org/10.1016/S0009-2541(10)80026-9
- Wershaw, R.L., et al. 1966. Hydrogen isotopic fractionation of water passing through trees. In, and G.D. Hobson, eds. Advances in organic geochemistry. Oxford, UK: Pergamon Press. 55–67.
- West, A.G., et al., 2010. Discrepancies between isotope ratio infrared spectroscopy and isotope ratio mass spectrometry for the stable isotope analysis of plant and soil waters. Rapid Communications in Mass Spectrometry, 24 (14), 1948–1954. doi:https://doi.org/10.1002/rcm.4597
- White, J., et al., 1985. The ratios of sap in trees: implications for water sources and tree ring ratios. Geochimica et Cosmochimica Acta, 49 (1), 237–246. doi:https://doi.org/10.1016/0016-7037(85)90207-8
- Zhao, L., et al., 2016. Significant difference in hydrogen isotope composition between xylem and tissue water in populus euphratica. Plant, Cell & Environment, 39 (8), 1848–1857. doi:https://doi.org/10.1111/pce.12753