
 ?Mathematical formulae have been encoded as MathML and are displayed in this HTML version using MathJax in order to improve their display. Uncheck the box to turn MathJax off. This feature requires Javascript. Click on a formula to zoom.
ABSTRACT
A new approach for the modified method of innovative trend analysis (ITA) was applied to the categories of maximum daily rains coming from 41 pluviometric stations of Macta (northwest Algeria) for the period 1970–2010. Six categories of maximum daily rainfall were considered: light: 0–4 mm/day (A); mild to moderate: 4–16 mm/day (B); moderate to heavy: 16–32 mm/day (C1); heavy: 32–64 mm/day (C2); heavy to torrential: 64–128 mm/day (D1); and torrential: equal to or greater than 128 mm/day (D2). The results show that during the second period (1990–2010), increasing trends were detected in the middle categories B (most frequent: 20.78%), C1 (17.85%), C2 (20.21%) and D1 (4.92%). In addition, migratory movements and rainy events towards the higher categories were detected (in particular towards C1 (8.84%)). These results show an increase in extreme rains in the Macta watershed during the period 1990–2010.
Editor A. Castellarin Associate Editor K. Kochanek
1 Introduction
Unprecedented changes in the global climate system have occurred since the 1950s, and global warming is now unequivocally accepted as a phenomenon that disrupts the climate (IPCC Citation2013). These global climate changes are modifying rainfall regimes in different regions of the world, with far-reaching environmental, social and economic impacts for local communities (Elouissi Citation2016, Dabanlı et al. Citation2017, Benzater et al. Citation2018, Citation2021, Abul Basher et al. Citation2018).
In recent years, an increase in the frequency and/or intensity of extreme weather events (minimum and/or maximum extremes), such as heat waves and sand winds, droughts, heavy rains and floods, has been observed worldwide (Groisman et al. Citation2005, Trenberth Citation2011, IPCC Citation2013, Kundzewicz et al. Citation2014, Kreibich et al. Citation2017, Elouissi et al. Citation2021) and in Algeria (Nekkache and Megnounif Citation2016, Benzater et al. Citation2019, Citation2021, Bouklikha et al. Citation2020), Germany (Berg et al. Citation2013), Saudi Arabia (Subyani Citation2012, Almazroui Citation2013, Labban Citation2016, Abdelkarim and Gaber Citation2019), Canada (Requena et al. Citation2019), China (Hu et al. Citation2012), South Korea (Jung et al. Citation2017), Spain (Eekhout et al. Citation2018), the USA (Kunkel et al. Citation1999, Wilhelmi and Wilhite Citation2002, Villarini et al. Citation2011, Mallakpou and Villarini Citation2017), France (Blanchet et al. Citation2018), India (Chandrashekar and Shetty Citation2018, Tirupathi et al. Citation2018, Chattopadhyay et al. Citation2019, Saha et al. Citation2020), Iran (Bhalta et al. Citation2019, Attar et al. Citation2020) and Italy (Brugnara et al. Citation2012, Caloiero et al. Citation2016, Citation2017).
In this context, extreme rainfalls cause some of the most frequent and catastrophic economic and social impacts of all meteorological phenomena (Attar et al. Citation2020). Floods are systematically observed in association with these phenomena, especially in urban areas where drainage may be inadequate to convey a sudden and significant amount of rainfall in a short time (Bui et al. Citation2019, Abdelkarim and Gaber Citation2019, Costache and Bui Citation2020). Similarly, in rural areas, agricultural activity may suffer losses due to excessive rainfall (Carvalho et al. Citation2002).
Disproportionate changes in the extreme rainfall intensity have been observed around the world. For example, despite the decrease in total rainfall, there has been a paradoxical increase in extreme rainfall in some Mediterranean areas (Alpert et al. Citation2002, Benzater et al. Citation2019, Citation2021) and in West Africa (Zahiri et al. Citation2016). These extreme events lead to harmful effects on the ecosystem, society and the economy (Mishra and Singh Citation2010, Trenberth et al. Citation2015, Dabanlı et al. Citation2017). Therefore, concerns about variations in extreme weather conditions are increasing considerably (Estrela and Vargas Citation2010, Kreibich et al. Citation2017, Wu et al. Citation2018).
Because of the changes in extreme rains, which can alter the strategy and policy regarding water resources as well as the criteria for the design of hydraulic infrastructures, a better understanding and better quantification of these extremes, now and in the future, are essential to prevent floods (Abdelkarim and Gaber Citation2019, Almazroui and Saeed Citation2020). Several authors have worked on the extreme rainfall trends in the world, but there are few studies on the categorization of this catastrophic weather event (Alpert et al. Citation2002, Yosef et al. Citation2009, Caloiero et al. Citation2016, Citation2017, Bhalta et al. Citation2019, Saha et al. Citation2020). In India, a statistically significant increase in the trend of very heavy and heavy rain categories, accompanied by a significant decreasing trend in the moderate extreme rain category, has been observed (Chandrashekar and Shetty Citation2018). In the South of Italy, Caloiero et al. (Citation2016) showed that the lowest rain categories (A and B) show increasing trends, while the highest rain categories (D1 and D2) show no trends. Similar results were obtained for the number of rainfall days falling in the different categories. Faced with this increase in extreme rainfall in different regions of the world, it is essential to analyse the changes by category of the different intensities of extreme rain and highlight the evolution of each.
The north of Algeria is subject to floods generated directly by this kind of extreme rainfall. The evolution of these events with climate change is a key issue for this region with strong demographic dynamics. Northern Algeria is known for its frequent catastrophic floods. For most of the year, most rivers remain in their lower states of well-defined alluvial channels. During these periods, the proximity of the wadis provides a water supply and an appropriate means of discharge. At rare intervals, during periods of high water, the alluvial plains serve to absorb, and to a certain extent to drain, flood waters that exceed the capacity of the river bed. Despite their appeal otherwise, the occupation of floodplains carries a risk during extreme floods. This risk can turn into a peril causing serious damage to property and agriculture, and disrupting communications systems, commerce and industry. The maximum floods occur at the beginning of autumn, because of the frequency of thunderstorms accompanied by torrential rains, which leads to devastating floods of the Mekerra (a tributary of the Macta) which was the subject of a regular flood generally in October of each year (Yahiaoui Citation2012).
The study of extreme rains is of paramount importance. It contributes effectively to several hydrological parameters, such as flood estimation where gauging data are lacking. These flow data are used in the design of hydraulic installations such as dam spillways and to protect cities against flooding.
In this study, the monthly maximum rainfall series recorded at 41 weather stations in the Macta watershed (Northwest Algeria), during the period 1970–2010, were analysed by separating them into different categories of rainfall according to the classification used by many studies (Alpert et al. Citation2002, Yosef et al. Citation2009, Caloiero et al. Citation2016, Citation2017). Then, the modified innovative trend analysis (ITA) technique was applied to the different categories to distinguish the trend of each one.
The objective of this article is to provide a new approach for the ITA method applied to extreme rains. The new visualization of the modified ITA method will make it possible to illustrate the trend in each category of extreme rains, to transform the graphic interpretation into a digital one. Finally, another original goal that has not been pursued in previous work is the detection of migration movements from one category to another.
2 Study area and data
The study is devoted to the Macta watershed, which is located in the northwest of Algeria (). Its geographical position is between 1.25°W and 0.6°E longitude, and between 34 and 36°N latitude. Macta is a basin that covers an area of 14 410 km2. Average annual rainfall is low. The spatial variation of average rainfall is moderate (25%). The Macta watershed is drained by two main rivers: the El-Hammam Wadi to the east and the Mekkera Wadi (called the Mebtouh Wadi downstream) to the west (Elouissi et al. Citation2017) ().
Figure 1. (a) Selected stations in the Macta watershed; (b) hydrographic network
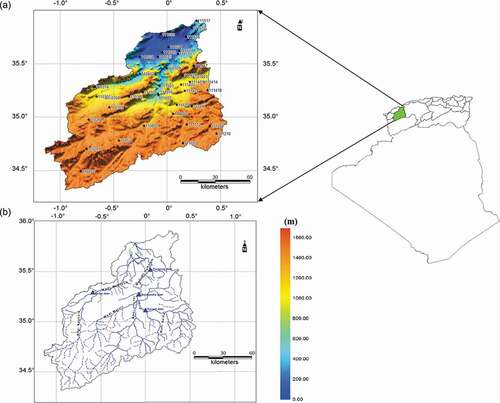
The raw maximum daily rainfall data (Pdmax) (in mm/day) were collected from the National Agency for Water Resources (ANRH). The 41 stations selected for the study are spread over all the regions of the Macta watershed (). The rainfall stations used in this work are represented numerically (for example, Sidi Bel Abbes: 110305; Mascara: 111429). The monthly maximum values were considered for the ITA method. For a given month, the value adopted stands for the maximum daily rainfall.
The reliability of an assessment of hydrometeorological extreme events risks strongly depends on the quality of the rain time series data (Chuan et al. Citation2019). Indeed, a graphical adjustment of the monthly maximum rains to a generalized extreme value distribution (GEV) allows us to visually prejudge the reliability of these data (Berolo and Laborde Citation2003). Thus, a homogeneous database of monthly maximum rainfall, with statistical parameters, for 41 Macta stations over a period of 41 years (1970–2010) was formed ()
Table 1. Statistical parameters of the extreme rainfall (1970–2010)
3 Methodology
As suggested by Alpert et al. (Citation2002), Yosef et al. (Citation2009) and Caloiero et al. (Citation2016, Citation2017), six categories of daily rainfall were taken into account: light: 0–4 mm/day (A); mild to moderate: 4–16 mm/day (B); moderate to heavy: 16–32 mm/day (C1); heavy: 32–64 mm/day (C2); heavy to torrential: 64–128 mm/day (D1) and torrential: equal to or greater than 128 mm/day (D2).
The ITA technique was developed by Şen (Citation2012) to analyse trends in time series. This method has been widely used by several researchers because of its simplicity and efficiency. It consists in dividing the series into two equal parts. Each one is arranged in ascending order, forming a scatter plot with the first part on the x-axis. A 1:1 line, indicating neutrality, is drawn to represent the boundary between the classes with decreasing and increasing trends.
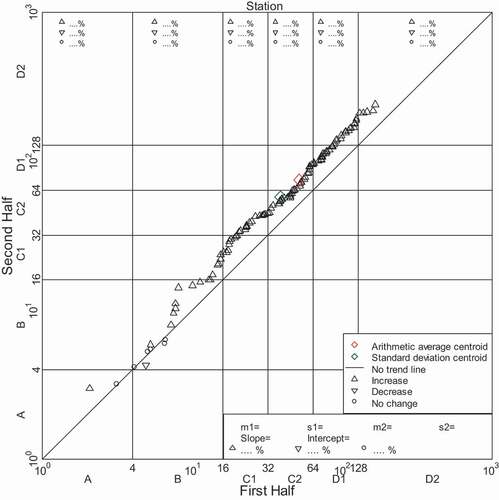
In the new modified ITA approach (), five modifications have been made:
the two axes (x and y) of the graph have been sub-divided according to the six categories considered (A, B, C1, C2, D1 and D2);
the graph axes of the graph have been transformed into a bi-logarithmic scale, for better visibility of the values in the lower categories;
symbols
and —, representing increasing trend, decreasing trend and no trend, respectively, are displayed along with their percentages for each category at the top of the figure ();
a minimum distance from the non-trend line which shows whether a positive or negative trend is fixed. Each value of the 2nd half is considered increasing (decreasing) if it is greater (less) than that of the 1st half plus (minus) 10% (Wu and Qian Citation2016);
finally, this new configuration of the ITA allows the detection of migration movements from one category to another. If a scatter point of a given category on the x-axis is in a higher (lower) cell on the y-axis, this signifies a migration to the upper (lower) category.
Figure 2. Template for the modified innovative trend analysis (ITA) method
4 Results and discussion
All the calculations for this work were carried out using the R written software. In order to analyse the spatiotemporal evolution of the categories of extreme rainfall, the observation period was divided into two sub-periods, P1 (January 1970–June 1990) and P2 (July 1990–December 2010) (Benzater et al. Citation2019, Citation2021), using 1990 as the baseline year (Hegerl et al. Citation2007, Prudhomme and Davies Citation2009, IPCC Citation2013, Buric et al. Citation2015, Mathbout et al. Citation2018, Zhang et al. Citation2021).
Thus, from the global initial matrix of (41 years, 12 months, 41 stations; i.e. 20 172 rainy events), two matrices (20 years and 6 months; 41 stations) were created to form 246 monthly maximum rainy events for each station.
The contributions (as a percentage of rainy events) for the six categories of daily rainfall were calculated for the two periods (). During the first period (1970–1990), it is clear that the contribution coincides with the order of categories. The light category A (30.20%) is the first contributor (), followed immediately by the light to moderate category B (20.70%), then the moderate to heavy C1 (18%). The lowest contribution is that of the torrential category (D2), at only 1.60%.
Table 2. Average values (%) of annual contributions (as a percentage of rainy events) for each category of daily rain for the Macta
For the second period (1990–2010), there is a change in the contributors’ order. In fact, the heavy rainfall category (C2) becomes second (21.70%), before the light to moderate category B (21.30%) and moderate to heavy C1 (20.70%), and after the light class A (26.40%), whose contribution decreased compared to the first period. The heavy (D1) and torrential (D2) categories have low contributions of 8.80% and 1%, respectively.
4.1 New modified ITA approach
The new approach applying the modified ITA method to the monthly maximum rainfall on 41 weather stations in the Macta watershed makes it possible to visualize the spatial behaviour of the 41 graphs during the two periods P1 (1970–1990) and P2 (1990–2010) ().
Figure 3. Trends in extreme rainfall identified by the modified innovative trend analysis (ITA), 1970–1990
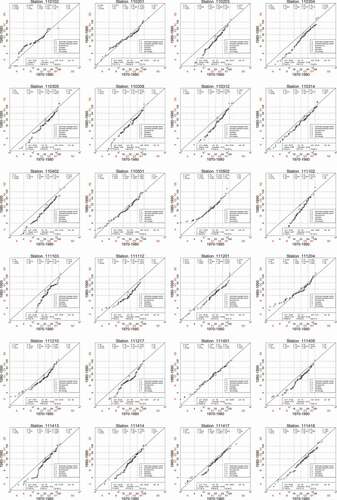
Figure 3. (Continued)
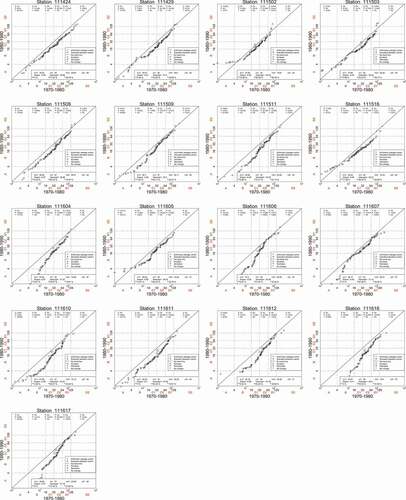
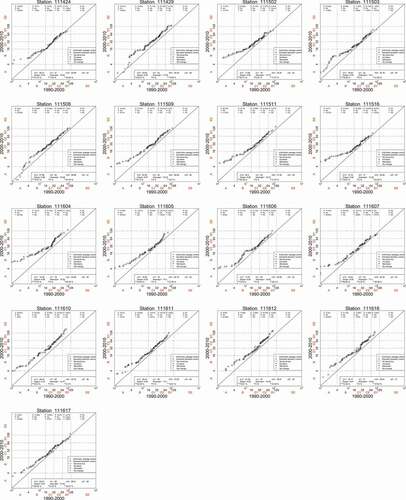
Figure 4. Trends in extreme rainfall identified by the modified innovative trend analysis (ITA), 1990–2010
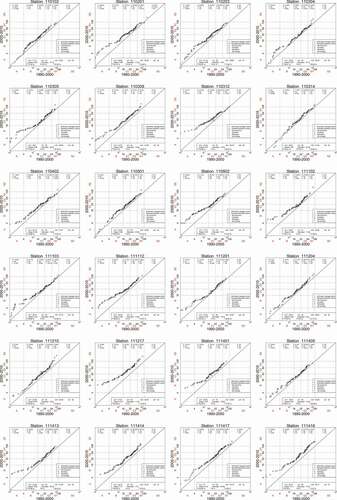
Figure 4. (Continued)
The first reading from the modified ITA method for the 41 stations during the first period (1970–1990) () shows that, over time, 3356 out of 5043 rainy events (66.55%) show a decreasing trend (Benzater et al. Citation2019, Citation2021), while 1341 rainy events (26.59%) show no trend and only 346 rainy events (6.86%) show an increasing trend. This decline in extreme rainfall trends prior to 1990 has been observed in several regions of the world (Venkata Rao et al. Citation2020).
To identify the trend for each category of extreme rain, and from , 41 matrices were established. Examination of these matrices makes it possible to visualize one decision matrix (). On a spatial scale (), categories B, C1, C2, D1 and D2 show a decreasing trend (of 82.93%, 87.80%, 97.56%, 90.24% and 53.66%, respectively), while 40 stations (97.56%) in the light A and D2 categories showed no trend.
Table 3. Trends of extreme rainfall categories (1970–1990)
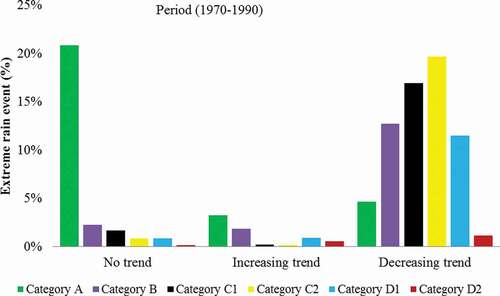
For the temporal trend behaviour of the rain events of the 41 stations during period 1 (1970–1990) (), it is clear that the decreasing trend prevails for the five categories: light to moderate (B: 12.69%), moderate to heavy (C1: 16.89%), heavy (C2: 19.65%), heavy torrential (D1: 11.48%) and torrential (D2: 1.17%). Category A did not show any trend (20.80%).
Figure 5. Trends in extreme rainfall categories during P1 (1970–1990)
On the other hand, during the second period (1990–2010) (), the spatial and temporal behaviour is totally reversed: the trends of the 41 stations are tilting towards an increase (Alpert et al. Citation2002, Yosef et al. Citation2009, Benzater et al. Citation2019, Citation2021). Temporarily and on average, 3926 rainy events (77.85%) are increasing, 1092 rainy events (21.65%) do not have a trend and only 25 points (0.50%) represent a decreasing trend.
To identify the trend of each extreme rain category for P2 (1990–2010), and from , 41 matrices were established. Examination of these matrices makes it possible to establish one decision matrix (). In space, the analysis of shows a completely opposite situation from the first period. For the 41 stations, it is clear that during this period (1990–2010), the five categories (B, C1, C2 and D1 and D2) showed an increasing trend (100%, 95.12%, 97.56%, 95.12% 95.12% and 2.40%, respectively). The two ends of the categories, namely light (A) and torrential (D2) showed no trend (58.53% and 95.12%, respectively).
Table 4. Trends of extreme rainfall categories (1990–2010)
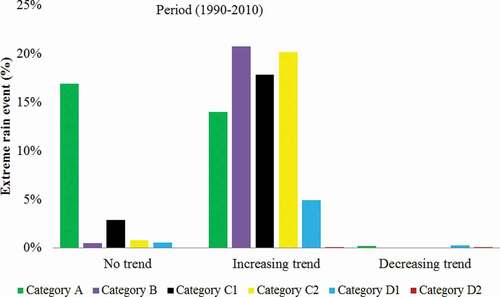
For the temporal trend behaviour of the rain events of the 41 stations during P2 (1990–2010) (), it is obvious that the situation was completely reversed compared to the first one. Indeed, the extreme rainy events show increasing trends in five categories: light to moderate (B: 20.78%), heavy (C2: 20.21%), moderate to heavy (C1: 17.85%) and heavy to torrential (D1: 4.92%). This ascending behaviour in the middle categories is consistent with the work of Boudiaf et al. (Citation2021) in northeast Algeria, El Alaoui El Fels et al. (Citation2021) in western central Morocco and Caloiero et al. (Citation2016) in southern Italy but does not fully converge with that of Bisht et al. (Citation2018) and Chandrashekar and Shetty (Citation2018) in India.
Figure 6. Trends in extreme rainfall categories during P2 (1990–2010)
This trend increase in the middle categories of extreme rains, during the first period, supports the use of ‘1990’ as baseline year (IPCC Citation2013). It corresponds to the intensification of the impacts of greenhouse gas emissions following the industrial revolution that began in 1850(Mathbout et al. Citation2018, Zhang et al. Citation2021). The two ends of the light (A) and torrential (D2) categories did not change their trend and retained their monotonic no-trend during the two periods P1 and P2 ().
Finally, this new configuration of the modified ITA method makes it possible to detect migration movements of rainy events from one category to another. Thus, from (1970–1990) and (1990–2010) 41 decision matrices for each period, representing the 41 stations, were constructed to highlight possible displacements from one category to a higher or lower category. presents a decision matrix model as an example. Thus, for all 41 stations in the Macta watershed during the period (1970–1990), migration movements from higher categories to lower categories were detected for 1716 rainy events (34.03%). In contrast, migrations to higher categories are negligible (1.39%).
Table 5. Example of categories’ migration movements (station 110102; 1970–1990)
Conversely, for the second period (1990–2010), the results show that in total, 1712 rainy events (33.95%) migrated from lower categories to higher categories (): 393 rainy events (7.79%) migrated from category (A) to category (B), 446 (8.84%) from (B) to (C1), 426 (8.45%) from (C1) to (C2), 379 (7.52%) from (C2) to (D1), and 68 (1.35%) from (D1) to (D2). No migration to a lower category was detected.
Table 6. Global migration movements (%) of categories (1990–2010)
The two main results of this study lie in the detection of increasing trends in the middle categories of rains accompanied by migration movements towards the higher categories. These results show the intense nature of the increase in extreme rains in the Macta catchment area during the period 1990–2010.
The new approach of the ITA method, described in this article, made it possible to highlight three points that were not revealed by the initial method:
i)Detection of partial trends in the six categories of extreme rainfall;
ii)Interpretation has become arithmetic instead of visual (for the classic ITA) using a critical difference of 10% (Wu and Qian Citation2016);
iii)Finally, the most interesting and original point is the detection of migratory movements of rainy events, which previous works did not mention at all.
Several researchers have attempted to study extreme rainfall events (Lu et al. Citation2021, El Alaoui El Fels et al. Citation2021) using the ITA method (Alifujiang et al. Citation2020, Güçlü Citation2020, Boudiaf et al. Citation2021) or the Mann-Kendall test (Caloiero et al. Citation2017, Młyński et al. Citation2018, Yaduvanshi et al. Citation2020). The shortcomings noted in the studies cited above are that they cannot identify trends by category, nor the migration of an extreme rainfall event from one category to another (higher or lower). The added value of the present work, compared to the similar work undertaken in Algeria (Boudiaf et al. Citation2021) and in different regions of the world (Caloiero et al. Citation2018, Alifujiang et al. Citation2020), consists in the following: (i) the introduction and identification of the trends in the extreme rainfall categories; (ii) determination of a threshold (10%) to identify a change and therefore avoid the usual visual procedure; and (iii) the most interesting and original point is the detection of migratory movements of rainy events, which was not explored in previous work at all.
5 Conclusion
Several results were produced from this study, by analysing the monthly extreme rains of the Macta watershed, using the new approach of the modified ITA method. The five rainfall categories light to moderate (B), moderate to heavy (C1), heavy (C2), heavy to torrential (D1) and heavy (D2) shifted from a decreasing trend in extreme rainy events (12.69%, 16.89%, 19.65%, 11.48% and 1.17%, respectively) during the first period (1970–1990) towards an increasing trend (20.78%, 17.85%, 20.21%, 4.92% and 0.10%, respectively) during the second period (1990–2010). The light to moderate rain category (B) is the class that showed the greatest increase (20.78%), followed by the heavy class (C2: 20.21%) and then the moderate to heavy class (C1: 17.85%). There was a monotony of trend in the light category (A), which did not show a clear trend during the two periods (20.80% and 16.91%). The two ends of the categories, namely light (A) and torrential (D2), showed monotony (no trend) during the two periods (1970–1990 and 1990–2010).
Positive trends only appear for the lower and middle classes. All the stations showed this upward trend in these classes. The results obtained show the behaviour of increasing extreme rainy events in the middle categories, as well as the detection of migration movements of rainy events towards higher categories (especially from B to C1: 8.84%). These two results show the intense nature of the increase in extreme rains in the Macta watershed during the period 1990–2010.
Acknowledgements
The authors thank the National Water Resources Agency (ANRH) for making the data available. The authors thank Prof. Zohair Chentouf (King Saud University, KSA) for his linguistic advice. We extend our gratitude to Prof. Laborde J. for his free Hydrolab software, which was used for data analysis.
Disclosure statement
No potential conflict of interest was reported by the authors.
References
- Abdelkarim, A., and Gaber, A.F.D., 2019. Flood risk assessment of the Wadi Nu’man Basin, Mecca, Saudi Arabia (During the Period, 1988–2019) based on the integration of geomatics and hydraulic modeling: a case study. Water, 11 (9), 1887. Available from: www.mdpi.com/journal/water. Accessed10 September 2020.
- Abul Basher, M., et al., 2018. Assessing climatic trends of extreme rainfall indices over northeast Bangladesh. Theoretical and Applied Climatology, 134 (1–2), 441–452. doi:https://doi.org/10.1007/s00704-017-2285-4.
- Alifujiang, Y., et al., 2020. Innovative trend analysis of precipitation in the Lake Issyk-Kul Basin, Kyrgyzstan. Atmosphere, 11 (4), 332. doi:https://doi.org/10.3390/atmos11040332.
- Almazroui, M., 2013. Simulation of present and future climate of Saudi Arabia using a regional climate model (PRECIS). International Journal of Climatology, 33 (9), 2247–2259. doi:https://doi.org/10.1002/joc.3721.
- Almazroui, M. and Saeed, S., 2020. Contribution of extreme daily precipitation to total rainfall over the Arabian Peninsula. Atmospheric Research, 231, 104672. doi:https://doi.org/10.1016/j.atmosres.2019.104672
- Alpert, P., et al., 2002. The paradoxical increase of Mediterranean extreme daily rainfall in spite of decrease in total values. Geophysical Research Letters, 29 (11), 31. doi:https://doi.org/10.1029/2001GL013554.
- Attar, N.F., et al., 2020. Enhancing the prediction accuracy of data-driven models for monthly streamflow in Urmia Lake Basin based upon the autoregressive conditionally heteroskedastic time-series model. Applied Sciences, 10 (2), 571. doi:https://doi.org/10.3390/app10020571.
- Benzater, B., et al. (2018). The reuse of wastewater in the contextof climate change: case of Mascara Wilaya(Algeria). Advances in Sustainable and Environmental Hydrology, Hydrogeology, Hydrochemistryand Water Resources Proceedings of the 1st Springer Conference of theArabian Journal of Geosciences (CAJG-1). Tunisia.
- Benzater, B., et al., 2019. Spatio-temporal trends in daily maximum rainfall in northwestern Algeria (Macta watershed case, Algeria). Arabian Journal of Geosciences, 12 (11), 1–18. 1866-7511. doi:https://doi.org/10.1007/s12517-019-4488-8.
- Benzater, B., et al., 2021. Extreme rain trend analysis in Macta watershed North West Algeria. Arabian Journal of Geosciences, 14 (4), 302. doi:https://doi.org/10.1007/s12517-021-06636-z.
- Berg, P., Moseley, C., and Haerter, J.O., 2013. Strong increase in convective precipitation in response to higher temperatures. Nature Geoscience, 6 (3), 181–185. doi:https://doi.org/10.1038/ngeo1731.
- Berolo, W. and Laborde, J.P., 2003. Statistiques des pluies journalières extrêmes sur les Alpes-Maritimes. Université Sophia Antipolis. Nice. Notice explicative de la carte au 1/200 000 et de ses annexes.
- Bhalta, R., et al., 2019. Evolution of extreme rainfall events over Indo-Gangetic plain in changing climate during 1901–2010. Journal of Earth System Science, 128 (5), 120. c Indian Academy of Sciences. doi:https://doi.org/10.1007/s12040-019-1162-1.
- Bisht, D.S., et al., 2018. An analysis of precipitation climatology over Indian urban agglomeration. Theoretical and Applied Climatology, 133 (1–2), 421–436. doi:https://doi.org/10.1007/s00704-017-2200-z.
- Blanchet, J., Molinié, G., and Touati, J., 2018. Spatial analysis of trend in extreme daily rainfall in southern France. ClimDyn, 51, 799–812. doi:https://doi.org/10.1007/s00382-016-3122-7
- Boudiaf, B., Şen, Z., and Boutaghane, H., 2021. Climate change impact on rainfall in north-eastern Algeria using innovative trend analyses (ITA). Arabian Journal of Geosciences, 14 (6), 511. doi:https://doi.org/10.1007/s12517-021-06644-z.
- Bouklikha, A., et al., 2020. The innovative trend analysis applied to annual and seasonal rainfall in the Tafna Watershed (Algeria). Revista Brasileira De Meteorologia, 35 (4), 631. doi:https://doi.org/10.1590/0102-77863540068.
- Brugnara, Y., et al., 2012. High-resolution analysis of daily precipitation trends in the central Alps over the last century. International Journal of Climatology, 32 (9), 1406–1422. doi:https://doi.org/10.1002/joc.2363.
- Bui, D.T., et al., 2019. Flood spatial modeling in Northern Iran using remote sensing and GIS: a comparison between evidential belief functions and its ensemble with a multivariate logistic regression model. Remote Sensing, 11 (13), 1589. doi:https://doi.org/10.3390/rs11131589.
- Buric, D., et al., 2015. Recent trends in daily rainfall extremes over Montenegro (1951–2010). Natural Hazards and Earth System Sciences, 15 (9), 2069–2077. doi:https://doi.org/10.5194/nhess-15-2069-2015.
- Caloiero, T., et al., 2016. Trends in the daily precipitation categories of Calabria (southern Italy). Procedia Engineering, 162, 32–38. doi:https://doi.org/10.1016/j.proeng.2016.11.008
- Caloiero, T., et al., 2017. Temporal analysis of rainfall categories in Southern Italy (Calabria Region). Environmental Processes, 4 (Suppl 1), S113–S124. doi:https://doi.org/10.1007/s40710-017-0215-1.
- Caloiero, T., Coscarelli, R., and Ferrari, E., 2018. Application of the innovative trend analysis method for the trend analysis of rainfall anomalies in Southern Italy. Water Resources Management, 32 (15), 4971–4983. doi:https://doi.org/10.1007/s11269-018-2117-z.
- Carvalho, L.M.V., Charles, J., and Brant, L., 2002. Extreme precipitation events in Southeastern South America and large-scale convective patterns in the South Atlantic convergence zone. Journal of Climate, 15 (17), 2377–2394. doi:https://doi.org/10.1175/1520-442(2002)015<2377:EPEISS>2.0.CO;2.
- Chandrashekar, V.D. and Shetty, A., 2018. Trends in extreme rainfall over ecologically sensitive Western Ghats and coastal regions of Karnataka: an observational assessment. Arabian Journal of Geosciences, 11 (12), 327. doi:https://doi.org/10.1007/s12517-018-3700-6.
- Chattopadhyay, R., et al., 2019. A study on the capability of the NCEP-CFS model in simulating the frequency and intensity of high-intensity rainfall events over Indian region in the high and low resolutions. Modeling Earth Systems and Environment, 5 (1), 85–100. doi:https://doi.org/10.1007/s40808-018-0520-3.
- Chuan, Z.L., et al., 2019. The effectiveness of a probabilistic principal component analysis model and expectation maximisation algorithm in treating missing daily rainfall data. Asia-Pacific Journal of Atmospheric Sciences. doi:https://doi.org/10.1007/s13143-019-00135-8.
- Costache, R. and Bui, D.T., 2020. Identification of areas prone to flash-flood phenomena using multiplecriteria decision-making, bivariate statistics, machine learning and their ensembles. Science of the Total Environment, 712, 136492. doi:https://doi.org/10.1016/j.scitotenv.2019.136492
- Dabanlı, I., Mishra, A.K., and Şen, K., 2017. Long-term spatio-temporal drought variability in Turkey. Journal of Hydrology, 552, 779–792. doi:https://doi.org/10.1016/j.jhydrol.2017.07.038
- Eekhout, J.P.C., et al., 2018. Why increased extreme precipitation under climate change negatively affects water security. Hydrology and Earth System Sciences, 22 (11), 5935–5946. doi:https://doi.org/10.5194/hess-22-5935-2018.
- El Alaoui El Fels, A., et al., 2021. Rainfall regionalization and variability of extreme precipitation using artificial neural networks: a case study from western central Morocco. Journal of Water and Climate Change, 12 (4), 1107–1122. doi:https://doi.org/10.2166/wcc.2020.217.
- Elouissi, A., 2016. Changement climatique, impacts et vulnérabilité. Cas du bassin versant de la Macta (Climate change, impacts and vulnerability. Case of the Macta watershed). Doctoral dissertation. Abou Bakr Belkaid University of Tlemcen, Algeria. Available from: http://dspace.univ-tlemcen.dz/bitstream/112/15065/1/Doc.Hyd.Elouissi.pdf. Accessed15 November 2020.
- Elouissi, A., et al., 2017. Climate change impact on rainfall spatio-temporal variability (Macta watershed case, Algeria). Arabian Journal of Geosciences, 10 (22), 1866-7511. doi:https://doi.org/10.1007/s12517-017-3264-x.
- Elouissi, A., et al., 2021. Drought investigation and trend assessment in Macta watershed (Algeria) by SPI and ITA methodology. Arabian Journal of Geosciences, 14 (14), 1329. doi:https://doi.org/10.1007/s12517-021-07670-7.
- Estrela, T. and Vargas, E., 2010. Drought management plans in the European Union. Water Resources Management, 26 (6), 1537–1553. doi:https://doi.org/10.1007/s11269-011-9971-2.
- Groisman, P.Y., et al. 2005. Trends in intense precipitation in the climate record. Journal of Climate, 18 (9), 1326–1350. doi:https://doi.org/10.1175/JCLI3339.1.
- Güçlü, Y.S., 2020. Improved visualization for trend analysis by comparing with classical Mann-Kendall test and ITA. Journal of Hydrology, 584, 124674. doi:https://doi.org/10.1016/j.jhydrol.2020.124674
- Hegerl, G.C., et al., 2007. Understanding and attributing climate change. In: S. Solomon, et al., eds. Climate change 2007: the physical science basis. Contribution of Working Group I to the Fourth Assessment Report of the Intergovernmental Panel on Climate Change. Cambridge, United Kingdom and New York, NY, USA: Cambridge University Press.
- Hu, Y., Maskey, S., and Uhlenbrook, S., 2012. Trends in temperature and rainfall extremes in the Yellow River source region. Climatic Change, 110 (1–2), 403–429. doi:https://doi.org/10.1007/s10584-011-0056-2.
- Intergovernmental Panel on Climate Change (IPCC, 2013). Edited by T.F. Stocker, et al. and Working Group I Technical Support Unit, Working Group I Contribution to the Fifth Assessment Report of the Intergovernmental Panel on Climate Change (IPCC), Summary for Policymakers. Kendall MG (1975) Rank Correlation Methods. New York: Oxford Univ. Press.
- Jung, Y., et al., 2017. The spatial and temporal structure of extreme rainfall trends in South Korea. Water, 9 (10), 809. doi:https://doi.org/10.3390/w9100809.
- Kreibich, H., et al., 2017. Adaptation to flood risk: results of international paired flood event studies. Earth’s Future, 5 (10), 953–965. doi:https://doi.org/10.1002/2017EF000606.
- Kundzewicz, Z.W., et al., 2014. Flood risk and climate change: global and regional perspectives. Hydrological Sciences Journal, 59 (1), 1–28. Available from: http://www.tandfonline.com/loi/thsj20. Accessed20 January 2020.
- Kunkel, K.E., Andsager, K., and Easterling, D.R., 1999. Long-term trends in extreme precipitation events over the conterminous United States and Canada. Journal of Climate, 12 (8), 2515–2527. doi:https://doi.org/10.1175/1520-0442(1999)012<2515:LTTIEP>2.0.CO;2.
- Labban, A.H., 2016. Dust storms over Saudi Arabia: temporal and spatial characteristics, climatology and synoptic case studies. Thesis in Meteorology. School of Science College of Science Engineering and Health RMIT University, Australia. September 2016.
- Lu, S., et al., 2021. Changes of extreme precipitation and its associated mechanisms in Northwest China. Advances in Atmospheric Sciences, 38 (10), 1665–1681. doi:https://doi.org/10.1007/s00376-021-0409-3.
- Mallakpou, I. and Villarini, G., 2017. Analysis of changes in the magnitude, frequency, and seasonality of heavy precipitation over the contiguous USA. Theoretical and Applied Climatology, 130 (1–2), 345–363. doi:https://doi.org/10.1007/s00704-016-1881-z.
- Mathbout, S., et al., 2018. Observed changes in daily precipitation extremes at annual timescale over the eastern mediterranean during 1961–2012. Pure and Applied Geophysics, 175 (11), 3875–3890, 2017 Springer International Publishing AG. doi:https://doi.org/10.1007/s00024-017-1695-7.
- Mishra, A.K. and Singh, V.P., 2010. A review of drought concepts. Journal of Hydrology, 391 (1–2), 202–216. doi:https://doi.org/10.1016/j.jhydrol.2010.07.012.
- Młyński, D., Cebulska, M., and Wałęga, A., 2018. Trends, variability, and seasonality of maximum annual daily precipitation in the Upper Vistula Basin, Poland. Atmosphere, 9 (8), 313. doi:https://doi.org/10.3390/atmos9080313.
- Nekkache, A.G. and Megnounif, A., 2016. Variability and trend of annual maximum daily rainfall in Northern Algeria. Hindawi Publishing Corporation International Journal of Geophysics, Article ID 6820397, 2016, 11. doi:https://doi.org/10.1155/2016/6820397.
- Prudhomme, C. and Davies, H., 2009. Assessing uncertainties in climate change impact analyses on the river flow regimes in the UK. Part 1: baseline climate. Climatic Change, 93 (1–2), 177–195. doi:https://doi.org/10.1007/s10584-008-9464-3.
- Requena, A.I., Burn, D.H.B., and Coulibaly, P., 2019. Estimates of gridded relative changes in 24-h extreme rainfall intensities based on pooled frequency analysis. Journal of Hydrology, 577, 123940. doi:https://doi.org/10.1016/j.jhydrol.2019.123940
- Saha, U., et al., 2020. Deciphering the extreme rainfall scenario over Indian landmass using satellite observations, reanalysis and model forecast: case studies. Atmospheric Research, 240, 104943. doi:https://doi.org/10.1016/j.atmosres.2020.104943
- Şen, Z., 2012. An innovative trend analysis methodology. Journal of Hydrologic Engineering, 17 (9), 1042–1046. doi:https://doi.org/10.1061/(ASCE)HE.1943-5584.0000556.
- Subyani, A.M., 2012. Flood vulnerability assessment in arid areas, Western Saudi Arabia. International Journal of River Basin Management, 10 (2), 197–203, Sustainable Solutions for Global Crisis of Flooding, Pollution and Water Scarcity. doi:https://doi.org/10.1080/15715124.2012.688749.
- Tirupathi, C., Shashidhara, T., and Srinivasan, R., 2018. Analysis of rainfall extremes and water yield of Krishna river basin under future climate scenarios. Journal of Hydrology: Regional Studies, 19, 287–306. doi:https://doi.org/10.1016/j.ejrh.2018.10.004
- Trenberth, K.E., 2011. Changes in precipitation with climate change. Climate Research, 47 (1), 123–138. doi:https://doi.org/10.3354/cr00953.
- Trenberth, K.E., Fasullo, J.T., and Shepherd, T.G., 2015. Attribution of climate extreme events. Nature Climate Change, 5 (8), 725–730. doi:https://doi.org/10.1038/nclimate2657.
- Venkata Rao, G., et al., 2020. Spatio-temporal analysis of rainfall extremes in the flood-prone Nagavaliand Vamsadhara Basins in eastern India. Weather and Climate Extremes, 29, 100265. doi:https://doi.org/10.1016/j.wace.2020.100265
- Villarini, G., et al., 2011. On the frequency of heavy rainfall for the Midwest of the United States. Journal of Hydrology, 400 (1–2), 103–120. doi:https://doi.org/10.1016/j.jhydrol.2011.01.027.
- Wilhelmi, O.V. and Wilhite, D.A., 2002. Assessing vulnerability to agricultural drought: a Nebraska case study. Natural Hazards, 25 (1), 37–58. doi:https://doi.org/10.1023/A:1013388814894.
- Wu, H., Li, X., and Qian, H., 2018. Detection of anomalies and changes of rainfall in the Yellow River Basin, China, through two graphical methods. Water, 10 (1), 15. doi:https://doi.org/10.3390/w10010015.
- Wu, H. and Qian, H. 2016. Innovative trend analysis of annual and seasonal rainfalland extreme values in Shaanxi, China, since the 1950s. International Journal of Climatology, Published online in Wiley Online Library (wileyonlinelibrary.com). doi:https://doi.org/10.1002/joc.4866.
- Yaduvanshi, A., et al., 2020. Observed changes in extreme rain indices in semi arid and humid regions of Godavari basin, India: risk sand opportunities. Natural Hazards, 103 (1), 685–711. doi:https://doi.org/10.1007/s11069-020-04006-8.
- Yahiaoui, A., 2012. Torrential floods mapping of vulnerable areas in Northern Algeria (Case of the Mekerrawadi, Wilaya of SidiBelAbbès). Doctoral Thesis in Hydraulics. National Polytechnic School, Algiers (Algeria).
- Yosef, Y., Saaroni, H., and Alpert, P., 2009. Trends in daily rainfall intensity over Israel 1950/1-2003/4. The Open Atmospheric Science Journal, 3 (1), 196–203. doi:https://doi.org/10.2174/1874282300903010196.
- Zahiri, E.P., et al., 2016. Mesoscale extreme rainfall events in West Africa: the cases of Niamey (Niger) and the Upper Ouémé Valley (Benin). Weather and Climate Extremes, 13, 15–34. doi:https://doi.org/10.1016/j.wace.2016.05.001
- Zhang, Y., et al., 2021. Projection of changes in flash flood occurrence under climate change attourist attractions. Journal of Hydrology, 595, 126039. doi:https://doi.org/10.1016/j.jhydrol.2021.126039