?Mathematical formulae have been encoded as MathML and are displayed in this HTML version using MathJax in order to improve their display. Uncheck the box to turn MathJax off. This feature requires Javascript. Click on a formula to zoom.
ABSTRACT
Evaporation is important basic information for irrigation decision making in water resources management. Developing countries usually use a small pan to observe surface evaporation, but the relationship between evaporation in different small pans is not sufficiently clear. In this paper, we use an extreme learning machine (ELM) model to predict and convert E20 (diameter 0.20 m) and E601 (diameter 0.62 m) pan data for 38 meteorological stations in southern China. Firstly, we obtained the best combination of meteorological parameters for forecasting E20 and E601, respectively, and we also found that the accuracy of the model can be significantly improved by adding pan data. Secondly, we found that during the conversion between E20 and E601, the model performance when using E601 data to predict the E20 evaporation is better than that when using E20 data to predict the E601 evaporation. Finally, the geographical factors were analysed, and the model performance was found to be relatively poor in the coastal area and the North–South junction.
Editor A. Fiori Associate editor N. Malamos
1 Introduction
Evapotranspiration (ET) is a process that includes evaporation of surface water into the atmosphere and stomatal transpiration from plant leaves (Feng et al. Citation2017, Shiri Citation2019a). ET can be described mathematically by the summation of equations that represent physical and biological processes. Evaporation is entirely a physical process for which there are various established methods of estimation, such as water and energy balance, mass transfer, Penmann-Monteith equations, and pan evaporation observations. A class A evaporation pan is commonly used because it measures evaporation only; it is not influenced by transpiration and it allows accurate comparison of evaporation between different areas. However, the cost of class A pan installation is too high for most developing countries, such as China. A small evaporation pan with a diameter of 20 cm was used extensively in China from about 1960, but since the beginning of the 21st century it has been replaced by an evaporation pan 60 cm in diameter (Wang et al. Citation2017a). Many studies have shown that data from evaporation pans with diameters of 60 cm and 20 cm can be converted into equivalent Class A evaporation data. Evaporation can also be calculated from easily accessible meteorological parameter data. The relationship between meteorological factors and evaporation is nonlinear, and various empirical and semi-empirical models have been developed to represent it (Liu and Sun Citation2016, Antonopoulos and Antonopoulos Citation2017, Dewes et al. Citation2017). The calculation of Epan (pan evaporation) is highly dependent on correlations between meteorological factors such as relative humidity (RH), wind speed (WS), atmospheric temperature, and atmospheric vapour pressure (Lu et al. Citation2018).
Various experimental models have been developed in recent years to estimate Epan. Empirical methods use regression analysis to relate evaporation measured using an evaporation pan, observed evaporation from a lake, or values measured by a lysimeter to meteorological factors. In practice, most such models have limited use (Singh and Xu Citation1997, Xu and Singh Citation1998). Evaporation models based on mass transfer have been compared in terms of the relationships between various meteorological inputs and time scales. Evaporation models based on temperature (Xu and Singh Citation2000) and solar radiation (Xu and Singh Citation2001) have been developed and validated. Donohue et al. (Citation2010) compared five mathematical models that predicted evaporation using pan evaporation data in Austria and found that the Penman equation performed better than other models in representing the kinetics of potential evaporation. Gundalia and Dholakia (Citation2013) validated the performance of six daily temperature and solar radiation-based experimental models that predicted Epan. Feng et al. (Citation2018) recently validated the radiation-based PenPan model and the Stephens and Stewart (SS) model used to calculate Epan in various climatic regions in China. They found that the SS model was preferable in mountain plateaus and mild continental regions only if total solar radiation and atmospheric temperature data were available.
The calculation of Epan is complex and requires nonlinear regression calculations for many inputs meteorological variables (Flammini et al. Citation2018). The creation of a precise empirical model to represent the complex processes is no small undertaking. The value of Epan can be measured directly by an evapotranspirometer. However, in many cases it is impractical or even impossible to use this instrument. Artificial intelligence models have been developed to quantify Epan, as have models that discover direct connections between one or more meteorological factors and Epan (Allawi and El-Shafie Citation2016, Keshtegar and Kisi Citation2017, Wang et al. Citation2017a, Eray et al. Citation2018, Ghorbani et al. Citation2018, Lu et al. Citation2018, Rezaie-Balf et al. Citation2018). Each of these studies showed that Epan could be predicted accurately from data for meteorological factors such as minimum and maximum temperatures, wind speed, relative moisture, and solar radiation.
Keskin and Terzi (Citation2006) created an artificial neural network (ANN) model to predict Epan from Lake Eğirdir. The values of Epan predicted by the model were more accurate than those predicted by a Penman model when compared with measured values. Allawi and El-Shafie (Citation2016)developed a radial-based function neural network (RBFNN) as well as an adaptive neuro-fuzzy inference system (ANFIS) to predict daily evaporation from the Layang reservoir in Malaysia. The results showed that both models were accurate. Rezaie-Balf et al. Citation2018 created a novel artificial intelligence (AI) model to predict monthly evaporation in Turkey, which coupled ensemble empirical mode decomposition (EEMD), a support vector machine (EEMD-SVM), and a model tree (EEMD-MT). Keshtegar and Kisi (Citation2017)used an improved response surface method (HRSF) to model monthly Epan in Turkey. ANN models have been used to estimate Epan of a water body in investigating self-sustainability (Jain and Roy Citation2017). Lu et al. (Citation2018) compared the daily Epan predictions of three tree-based data mining methods for the Poyang Lake basin. They found that the Gradient Boosting Decision Tree (GBDT)model predicted Epan more accurately than the Random Forest (RF) and M5tree (M5T)models did. Malik et al. (Citation2018) used an RBFNN model, a self-organizing map neural network (SOMNN) model, and a multiple linear regression (MLR) model to predict daily Epan in Pantnagar, India, using combinations of selected meteorological factors as input. The most accurate predictions were given by the RBFNN model with six meteorological factors. Shiri et al. (Citation2019b) compared Epan predictions given by ANFIS and ANN models for four locations in the United States and developed a model using auxiliary data without local meteorological data. Majhi et al. investigated a deep data mining approach – a deep neural network (DNN) – to predict daily Epan in India. They found that the model they developed was more accurate than a multilayer perceptron (MLP) model and other experimental models. The ability of these machine learning models to predict nonlinear relationships between dependent variables and independent variables significantly increased the prediction accuracy of Epan in areas for which there is sparse data.
Recent attention has been given to the use of extreme learning machines (ELMs) in predicting Epan (Deo et al. Citation2016, Feng et al. Citation2018). An ELM is a single-layer feedforward neural network algorithm that can solve neural network problems, such as back-propagation based on gradient descent, and thus reduce network training time (Wang and Han Citation2014, Tavares et al. Citation2015). Deo et al. (Citation2016) used three AI models to predict monthly evaporation: an ELM, a relevance vector machine (RVM), and multivariate adaptive regression splines (MARS).They obtained high R2 values for the verification of RVM, ELM and MARS (0.974, 0.977 and 0.979, respectively). Feng et al. (Citation2018) compared three AI models in predicting monthly Epan in China: an ELM, a particle swarm optimization neural network (PSO-ANN), and a genetic algorithm artificial neural network (GA-ANN). They demonstrated that the ELM model was most accurate, with Nash-Sutcliffe efficiency (NSE) varying from 0.909 to 0.936. Huang et al. (Citation2015) reviewed the use of ELM and current research into it. Feng et al. (Citation2016) compared an ELM model, a back-propagation neural network combined with the genetic algorithm (GANN), and a wavelet neural network (WNN) model in predicting Epan and found that the ELM model and the GANN model were more accurate than the WNN model. Many studies have shown that an ELM model produces more accurate predictions of Epan than other models do. Although the use of AI is a relatively new technique for estimating Epan, ELM models have been rapidly adopted and have proved to be effective and satisfactory in predicting Epan.
Both E601 (E601 evaporators) and D20(small-diameter (20 cm) evaporators) evaporation pans are used in most regions of China. Before the 1970s, meteorological and hydrological stations obtained evaporation data mainly by observing small-diameter (20 cm) evaporators. Since the 1970s, a few stations have used small evaporators and E601 evaporators in parallel for observation during non-icing periods. In 1995, the China Meteorological Administration decided to standardize evaporation observations in conformity with the requirements of the World Meteorological Organization (WMO). The conversion factor for an E601 evaporator relative to a 20 m2 evaporation tank is much greater than the conversion factor for a small evaporator relative to a 20 m2 evaporation tank; that is, the evaporation capacity of an E601 is much higher than that of an E20. The E601 provides data values that are close to observed evaporation values for small- and medium-sized water bodies such as lakes and reservoirs, and it is constructed from rust-resistant materials. The China Meteorological Administration has therefore decided to replace the smaller evaporators used for water surface evaporation observation with E601 evaporators at national benchmark and basic observation stations and to cancel both E601 observation and small-evaporator water surface observations in other locations. For example, since 1985, all basic weather stations in Jiangsu Province have installed E601 evaporators to replace other evaporators.
However, time series data for the two types of evaporator data are not equivalent between stations, which is problematic for applications that use the data. Chu et al. Citation2018), using Nanjing Station as an example, calculated the conversion factors for small evaporator data to E601 evaporating pan data for 60 sites in Jiangsu Province, where evaporation data had been collected since 1953. The E601 evaporator was added in 1986. Zheng et al. (Citation2011) performed similar work for data from the Mengzi Station. Fu et al. Citation2014) calculated the conversion factors for many small evaporating pans to a 20 m2 evaporator in Shandong in order to predict free water surface evaporation. They found that the E601 evaporators had a relatively constant conversion factor but that there were significant differences in conversion factors between evaporating pans of different sizes. Zuo et al. (Citation2016) conducted a pan evaporation experiment with an E601, a Class A pan, and a D20 pan in Northwest China to determine the effects of pan type on evaporation.
A small evaporator can be used to make both water surface evaporation observations and ice surface evaporation observations. The observation data of the small evaporator is the evaporation observation data of the water surface. Many sites that used small evaporators have produced long time series data, so the small evaporator data is extremely important historical observation data that is of great value for climate research in China. ELM has become important in Epan prediction; it is a rapid and accurate method of calculation but it has been rarely used for southern China. Another consideration is that most of the input parameters of the pan evaporation models reviewed were meteorological factors only.
In this study, we included the measured pan evaporation data as input together with the meteorological factors and selected several different combinations of input parameters. We used an ELM model and converted the E601 data and E20 data from 38 weather stations in southern China to a single format (E601 or E20) for the experiments in our study. The main objectives of the study were: (1) to estimate the E20 and E601 data based on the ELM model in South China, and make recommendations regarding the best implementation sites and the best parameter combinations in South China; (2) verify that the accuracy of the ELM model can be improved by adding evaporation pan data based on meteorological data; and (3) explore the influence of geographical location on Epan estimation.
2 Materials and methods
2.1 Study area
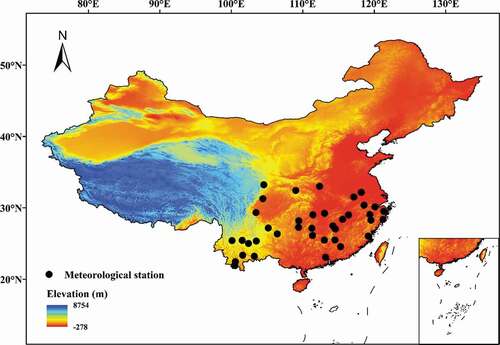
South China is the area south of the Qinling–Huaihe line. To the west is the Qinghai–Tibet Plateau, and to the east and south are the Yellow Sea, the East China Sea, and the South China Sea. The length of the continental coastline accounts for more than 2/3 of the coastline of the entire country. The terrain is high in the west and low in the east, and the landform features plain, basin, and plateau. It is crisscrossed by mountain ranges. There are many rivers and lakes and water networks in the plain. The climate is humid, sub-tropical, and tropical monsoon. The sub-tropical monsoon climate is characterized by high temperature and plentiful rain in summer and mild temperature and high humidity in winter. The tropical monsoon climate is characterized by high temperatures throughout the year and division into dry and wet seasons. The average temperature in January is above 0°C (this is a big difference between South China and North China), annual rainfall is over 800 mm, and the rainy season and the hot season fall in the same period. Natural disasters occur year round and include landslides and debris flows, high temperatures in summer and autumn, frequent floods, typhoons, cold waves in winter, and summer drought in the middle and lower reaches of the Yangtze River. South China features dense river networks, developed shipping, large volumes of water, a long flood season, small sediment content, no icing period, rich water energy resources, and high shipping value. We selected 38 sites for our analysis, as shown in .
Figure 1. Geographical distribution of the meteorological stations used in this study
2.2 Data collection
The E20 pan (evaporation pan with diameter 0.20 m) has been widely used to measure Epan in China since the 1950s. Since 2001, it has been replaced by the E601 pan (diameter 0.62 m). Of the 824 meteorological stations in China, some have no Epan measured data, and some have no long-term time series Epan data. Taking into account data availability, computing costs and availability of climate data, we selected data for daily minimum atmospheric temperature (Tmin), maximum atmospheric temperature (Tmax), RH, total solar radiation (Rs), WS, E20, and E601 from 38 meteorological stations for the period 1985–2001. We use E601 to refer to the E601 evaporation pan itself and E601 to refer to the E601 pan data; similarly with E20 and E20. The data used in this study were provided by the sharing network of China Meteorological Data, and the monitoring stations are well distributed across South China. We did not use data from stations with much missing data or short data time series and we selected 38 stations; the basic geographic and meteorological information for these stations is shown in .
Table 1. Basic geographic and meteorological information for the 38 stations
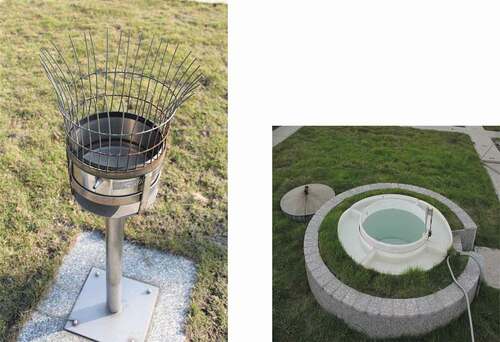
shows the E20 and E601 evaporators. The E20 is smaller in size and contains less water, resulting in a higher ratio of heat transfer between the pan and the surrounding environment, which makes E20 data less reliable than E601 data. We investigated predictions made using the data of each of these two evaporators as well as data conversion between them.
Figure 2. E20 pan (left) and E601 pan (right)
2.3 Theories and method
ELM is a recently developed set of soft computing techniques that are intended to overcome the barriers between traditional machine learning and biological learning mechanisms (Huang et al. Citation2015). The use of extreme indicates a powerful technology with a learning ability similar to that of a human brain. An ANN needs to adjust hidden neurons during the learning stage, whether it is a single or a multiple hidden layer feedforward network, whereas ELM does not. ELM has produced good results in feature learning, clustering, regression, and classification applications (Liang et al. Citation2006, Huang et al. Citation2014, Huang Citation2014, Bai et al. Citation2015). ELM is a single-layer feedforward network with fast learning and good generalization ability (Huang et al. Citation2006).
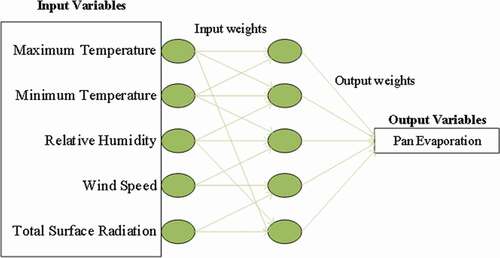
shows a generalized model of ELM. In this study, maximum atmospheric temperature, minimum atmospheric temperature, relative humidity, wind speed, and total solar radiation are input variables, and Epan is the output variable. Input and output variables are connected by hidden nodes, with input and output weights that are randomly generated. We used 75% of the available datasets for training and 25% for testing.
Figure 3. The structure of the extreme learning machine
We used the coefficient of determination (R2), mean absolute error (MAE) and mean absolute percentage error (MAPE) to evaluate the model:
where Ep0, Eps, p0,
ps, and n are, respectively, measured Epan, estimated Epan, average measured Epan, average estimated Epan, and the number of measurements. A high value of R2 (i.e. close to 1) indicates a good regression fit and thus a better algorithm performance. In contrast, algorithm performance is negatively correlated with MAE and MAPE.
3 Results and discussion
3.1 Direct conversion between E20 and E601 by K
K is the ratio of evaporation determined by E601 to evaporation determined by E20. K is obtained by comparing the E601 evaporation data measured at 38 stations with the corresponding E20 evaporation data. E20 evaporation at selected stations can then be converted to E601 evaporation by multiplication by K. The values of statistical indicators for the predicted values are shown in . For training, average R2 = 0.755, average MAE = 0.647, and average MAPE = 0.356 for the 38 stations. For testing, average R2 = 0.752, average MAE = 0.651, and average MAPE = 0.353. Eight sites were selected for validation, and the predicted values of E601 obtained by using K and the E20 data and the measured E601 values are shown for comparison in .
Table 2. Statistical indicators for E601 prediction using K and E20 data
Figure 4. Predicted evaporation values vs. evaporation values measured during the test period after inputting K for Wudu, Dali, Jishou and Yongzhou stations for comparison
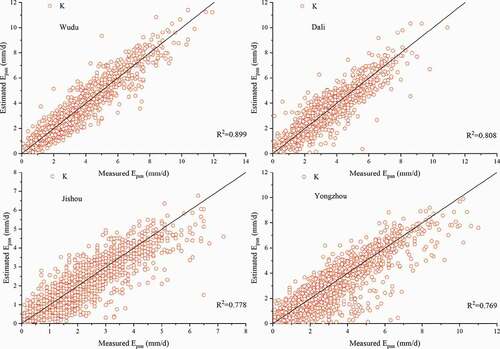
Figure 5. Predicted evaporation values vs. evaporation values measured during the test period after inputting K for Nanchang, Boyang, Bijie and Lishui stations for comparison
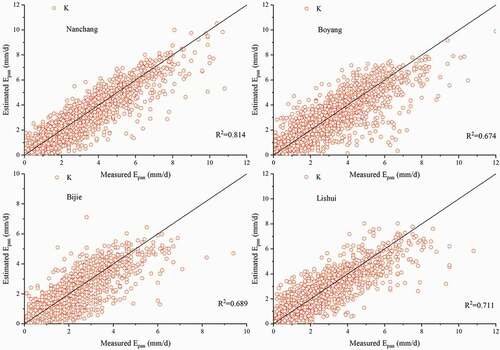
show that for some stations, such as Wudu and Yuanmou, this prediction method performed relatively well (R2 = 0.893 and 0.870, respectively) when only K was used for prediction. Thus if there is a lack of meteorological parameters for the area around a station, this method can be used to predict evaporation. However, for the majority of sites, the prediction performance of K is not ideal, although it does produce some usable results; we therefore judged it to be inadequate for meeting practical requirements. We therefore introduced meteorological parameters together with evaporation data to predict E20 evaporation and E601 evaporation using the ELM model.
3.2 Prediction of E20 evaporation and model stability using meteorological data
3.2.1 Prediction of E20 evaporation using meteorological data
Epan for the study area was predicted using the meteorological parameters Tmax, Tmin, WS, RH, Rs, and E601. Individual parameters were combined in seven different ways for the experiment. shows the values of the statistical indicators for the four stations and the predicted values of Epan for training and testing for the seven parameter combinations. The optimal results for each parameter combination are shown in bold type, and the worst results are italicized and underlined (this convention is used in other tables also throughout this paper). shows that the prediction accuracy of each model varies with the parameter combination. The average values of the statistical indicators for predicted E20 for the 38 stations using different parameter combinations are shown in .
Table 3. Performance of the ELM model in predicting E20 evaporation using meteorological data and E601 data using different combinations of parameters (bold shows the best performing combination)
Table 4. The average values of statistical indicators for predictions of E20 evaporation for 38 stations using different combinations of parameters (bold shows the best performing combination)
For the values of the statistical indicators for all 38 stations in training and testing, see the Appendix (). Using testing as an example, it can be seen that when only E601 is used as the input parameter, average R2 = 0.752, average MAE = 1.011, and average MAPE = 0.497. In comparison with the parameter combination Tmax·Tmin (average R2 = 0.745, average MAE = 1.025, average MAPE = 0.468), average R2 is 0.94% greater, average MAE is 1.37% less, and average MAPE is 6.2% greater. Although the accuracy is not as great as it could be, the unique benefit of using only E601 as input is that it requires the least data and it is suitable for use for areas in which meteorological data are unavailable. For the combination Tmax·Tmin, model performance is greatly improved by incorporating E601 (average R2 = 0.874, average MAE = 0.707, average MAPE = 0.320), as shown by R2 increasing by 17.3% and MAE and MAPE decreasing by 45% and 46.3%, respectively. These results indicate that the incorporation of E601 can greatly increase the accuracy of the model Epan prediction. The parameter combination Tmax·Tmin·WS·RH (average R2 = 0.897, average MAE = 0.626, average MAPE = 0.273) was also improved by incorporating E601 (average R2 = 0.923, average MAE = 0.546, average MAPE = 0.24). A comparison between Tmax·Tmin·WS·RH·Rs (R2 = 0.925, average MAE = 0.512, average MAPE = 0.24) and Tmax·Tmin·WS·RH·Rs·E601 (average R2 = 0.943, average MAE = 0.464, average MAPE = 0.216) shows that the incorporation of E601 increased the accuracy of the prediction, but the difference was not significant. In summary, the incorporation of pan evaporation values with meteorological factors significantly improves model performance; however, the increase in accuracy becomes less significant as the number of meteorological parameters increases.
Using the same combinations of input parameters, the prediction of Epan becomes more accurate as more parameters are input. Hangzhou, Qujing, and Fuzhou stations were selected to compare model performance when the parameter combinations Tmax·Tmin, Tmax·Tmin·WS·RH, Tmax·Tmin·WS·RH·E601, and Tmax·Tmin·WS·RH·Rs·E601 were used as input in testing. The results show that as the number of input parameters increased, R2 increased and MAE and MAPE decreased, indicating improved model performance, supporting our contention that an increased number of input parameters increases accuracy.
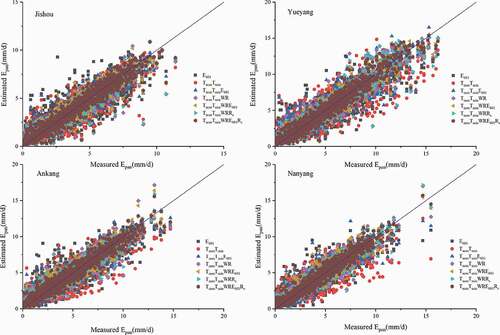
We selected four diverse stations in South China, having different longitudes and latitudes, climate, and sunshine duration, to represent all stations. Comparing the accuracy of predictions from all the selected combinations of seven parameters in testing better indicates the performance of the model for each parameter combination. The result is shown in .
Figure 6. Predicted and measured evaporation values for Jishou, Yueyang, Ankang and Nanyang sites using different combinations of input parameters during testing
3.2.2 Analysis of model stability (prediction of E20)
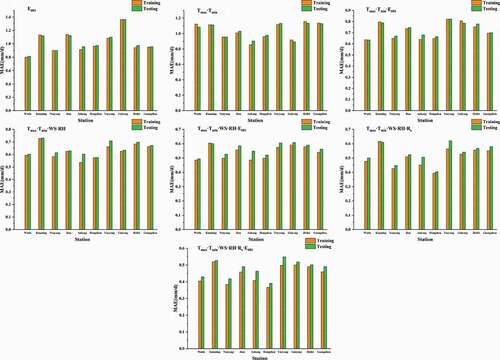
shows changes in MAE for E20 evaporation predicted by the model during training and testing for the 10 selected sites(Wudu, Kunming, Nanyang, Jian, Ankang, Hangzhou, Yueyang, Guiyang, Hefei, and Guangzhou sites). The Kunming station shows slightly more closely clustered predictions than other stations in training, which suggests that the algorithm is more stable in this case. When the input parameter combination was Tmax·Tmin, the model performed badly for all stations. When there were at most three input parameters, differences in MAE were small for most stations during testing and validation. However, when there were combinations of more than three input parameters, MAE during training and testing showed more variation for most stations, which indicates that an increased number of parameters leads to model overfitting. MAE for all stations reached a maximum value when the combination Tmax·Tmin was part of the input parameter set, and the rate of increase in MAE was very small when E601, K, Tmax, and Tmin only were separately input, which indicates that model overfitting was relatively slight in these cases. When the combination Tmax·Tmin·WS·RH·Rs·E601 was input, MAE reached a minimum for all models, which indicates that the accuracy of the prediction of Epan had increased, but the average increase in MAE was also greatest, which indicates that model overfitting was greatest in this case. We concluded from these results that an increase in the number of input parameters will increase the accuracy of model prediction but decrease model stability. Overall, we found that ELM performed satisfactorily for southern China regardless of accuracy or stability.
Figure 7. MAE values for comparison between testing and training for 10 sites (E20 prediction)
3.3 Prediction of E601 evaporation and model stability based on meteorological data
3.3.1 Prediction of E601 evaporation using meteorological data
Daily E601 evaporation in the study area was predicted using the meteorological data Tmax, Tmin, WS, RH, Rs, and E601. The six selected parameters were variously combined in seven ways and input into the ELM model for training. shows the statistical indicators for daily Epan prediction in training and testing using data from four stations. The optimal results for each combination of parameters are bolded, and the worst results are italicized and underlined. It can be seen from the table that the prediction accuracy of each model varies according to the parameter combination. The average values of the statistical indicators for predictions of E601 for the different combinations of parameters for the 38 stations are shown in .
Table 5. Performance of the ELM in predicting E601 evaporation using meteorological data and E20 data using different combinations of parameters (bold shows the best performing combination)
Table 6. The average values of statistical indicators for prediction of E601 evaporation for 38 stations using different combinations of parameters (bold shows the best performing combination)
For the values of the statistical indicators for all 38 stations in training and testing, see the Appendix (). Taking testing as an example, the predictions were much more accurate when only E20 was used as input than when the input parameter combination was Tmax·Tmin; average R2 for the 38 stations was 0.747, average MAE was 0.649, and average MAPE was 0.443. Therefore, the use of E20 only is suitable for stations that lack meteorological data; only one parameter is needed, and the predictions are reasonably accurate. When E20 was added to the combination Tmax·Tmin, model accuracy and stability were improved qualitatively, similar to the E20 evaporation prediction (average R2 = 0.762, average MAE = 0.623, average MAPE = 0.425); R2 increased by 40.3%, MAE decreased by 30.8% and MAPE decreased by 34.5%.
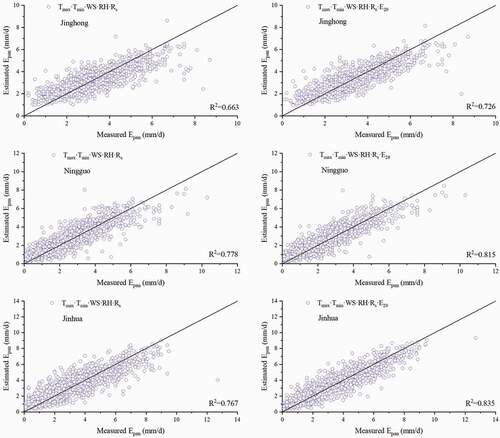
Jinghong, Ningguo, and Jinhua stations were selected for a comparison of model performance between the combinations Tmax·Tmin and Tmax·Tmin·E20; Tmax·Tmin·WS·RH and Tmax·Tmin·WS·RH·E20; and Tmax·Tmin·WS·RH·Rs and Tmax·Tmin·WS·RH·Rs·E20 (). The results show that adding evaporation data to combinations of meteorological parameters significantly increased the accuracy of model predictions but that the improvement in performance lessened as the number of meteorological parameters increased. We also found that model performance gradually improved as additional parameters were added to a particular combination, which is consistent with the results observed when E20 was added to a particular parameter combination. We therefore recommend that the six-parameter combination Tmax·Tmin·WS·RH·Rs·E20 be used as model input for areas for which there is sufficient meteorological data. We found no difference in model performance between Tmax·Tmin·WS·RH·E20 and Tmax·Tmin·WS·RH·Rs·E20, both of which gave the best predictions. Therefore, Rs had no obvious effect on model performance when there were more meteorological parameters.
Figure 8. Model performance for Jinghong, Ningguo and Jinhua sites in predicting E601 using Tmax·Tmin and Tmax·Tmin·E20 for comparison
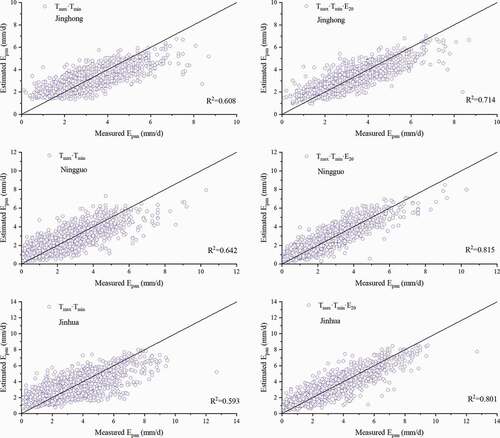
Figure 9. Model performance for Jinghong, Ningguo and Jinhua sites in predicting E601 using Tmax·Tmin·WS·RH and Tmax·Tmin·WS·RH·E20 for comparison
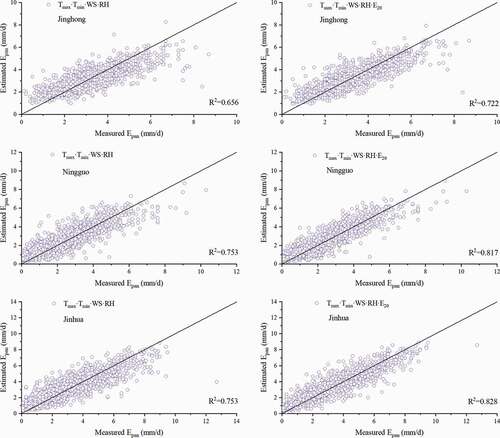
Figure 10. Model performance for Jinghong, Ningguo and Jinhua sites in predicting E601 using Tmax·Tmin·WS·RH·Rs and Tmax·Tmin·WS·RH·Rs·E20 for comparison
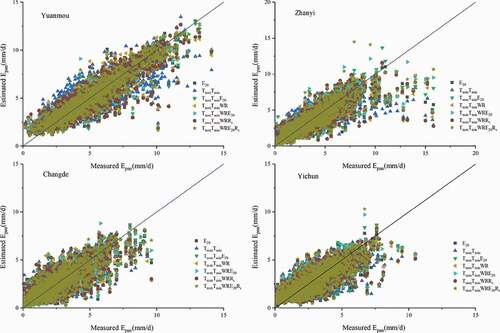
show the model performance with various parameter combinations for comparison of prediction accuracy among all of the parameter combinations used for the eight widely distributed sites during testing.
Figure 11. Predicted and measured evaporation values for Chenzhou, Yongzhou, Jian and Mengzi sites using different combinations of input parameters during testing
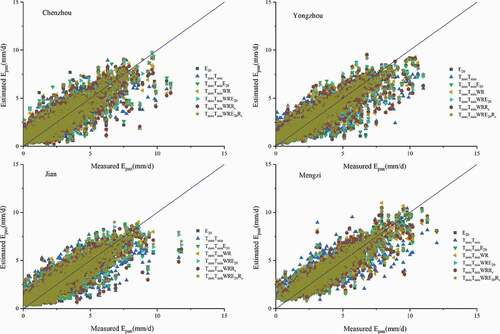
Figure 12. Predicted and measured evaporation values for Yuanmou, Zhanyi, Changde and Yichun sites using different combinations of input parameters during testing
3.3.2 Analysis of model stability (prediction of E601)
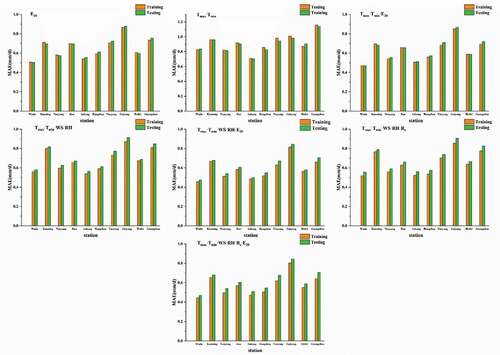
shows changes in MAE for E601 evaporation predicted by the model during training and testing for the 10 selected sites (Wudu, Kunming, Nanyang, Jian, Ankang, Hangzhou, Yueyang, Guiyang, Hefei, and Guangzhou). The model was predictively most stable during the training stage for the Wudu station, indicated by it having the lowest MAE value in most cases. The model performed badly for all stations with only Tmax·Tmin as input. When there were at most three input parameters, there was little difference in MAE between testing and validation. However, when the input data was a combination of more than three parameters, MAE for most stations fell within a particular range, which indicates that an increase in the number of input parameters led to model overfitting. MAE reached a peak value for all stations when Tmax·Tmin was the input data. The rate of increase was very small when only E20, K, or Tmax·Tmin were input, which indicates that model overfitting was at a minimum in these cases. MAE reached a minimum value when the input combination was Tmax·Tmin·WS·RH·Rs·E20, which indicates that the prediction of Epan was most accurate for this input combination. The average increase in MAE was also greatest for this combination, which indicates that model overfitting was greatest in this case. We concluded from these results that the increased number of input parameters improved model prediction accuracy but decreased model stability; this matches our conclusion for the model prediction of E20.
Figure 13. MAE values for comparison between testing and training for 10 sites (E601 prediction)
3.4 Conversion between E20 and E601
shows R2 for E20 and E601 for the three-parameter input combinations for 38 stations. The R2 values with better statistical indicators are shown in bold. Taking Wudu station as an example, with the input parameter combination Tmax·Tmin, R2 was 0.935 when E601 was added to the input parameters to predict E20 evaporation and 0.906 when E20 was added to the input parameters to predict E601 evaporation. For the 38 stations as a whole, average R2 was 0.875 when E601 was used to predict E20 evaporation and 0.762 when E20 data was used to predict E601, showing a difference in performance of 14.8%.
Table 7. R2 for conversion between E20 data and E601 data using combinations of three parameters (bold indicates better prediction)
Again taking Wudu station as an example, with the input parameter combination Tmax·Tmin·Rs, R2 = 0.953 when E601 was added to the input parameters to predict E20 and R2 = 0.910 when E20 was added to the input parameters to predict E601. Taking the 38 stations as a whole, average R2 was 0.908 when E601 was used to predict E20 evaporation and 0.767 when E20 was used to predict E601, with a performance difference of 19.2%.
Again using Wudu station as an example, with the input parameter combination Tmax·Tmin·WS·RH, R2 was 0.960 when E601 was added to the input parameters to predict E20 evaporation and 0.906 when E20 was added to the input parameters to predict E601 evaporation. Taking the 38 stations as a whole, average R2 was 0.913 when E601 data was used to predict E20 evaporation and 0.776 when E20 data was used to predict E601 evaporation, with a performance difference of 17.7%.
The preceding analysis, together with all values shown in the table, shows that for any particular combination of input parameters, the prediction of E20 when E601 is added as an input parameter is better than the prediction of E601 when E20 is added as an input parameter.
3.5 Spatial distribution of errors
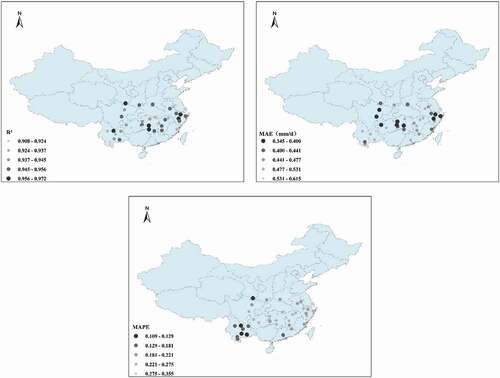
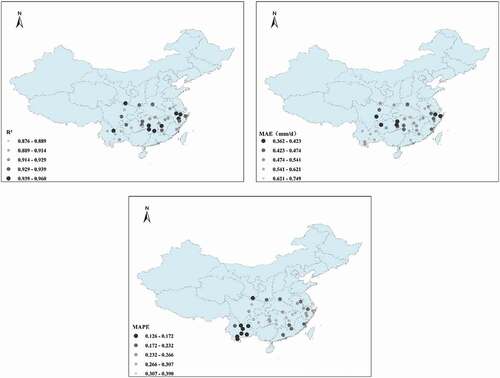
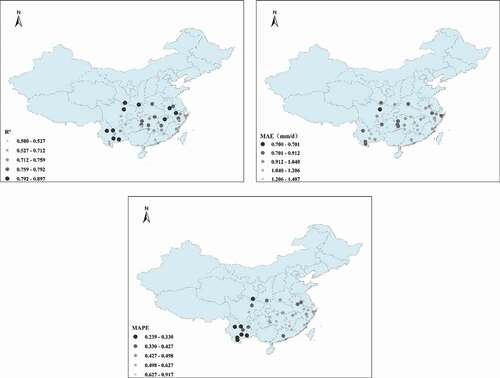
Taking the E20 predictions in testing as an example, the spatial distribution of model results with the input combination Tmax·Tmin·WS·RH·Rs·E601 is shown in . The model performed well at most stations in predicting Epan, with R2 > 0.908, MAE < 0.615, and MAPE < 0.336. There were some spatial differences in the accuracy of model predictions, with better performance for Anhui and Yunnan regions.
Figure 14. Spatial performance of the model using the input parameter combination Tmax·Tmin·WS·RH·Rs·E601.
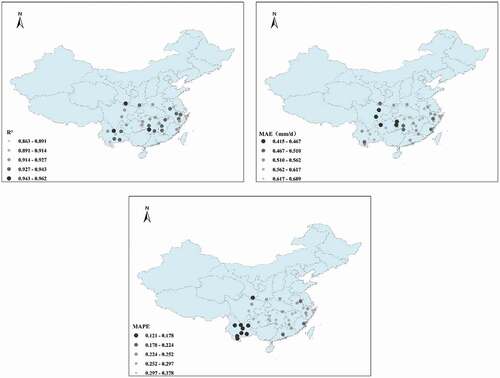
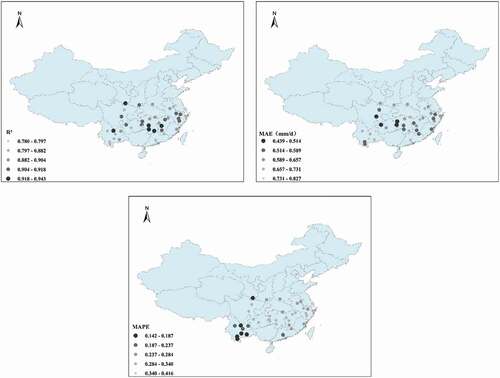
shows the model performance in training for the input combination Tmax·Tmin·WS·RH·E601. It can be seen that the model performed well in predicting Epan for most stations, with R2 > 0.863, MAE < 0.689, and MAPE < 0.361. The model shows good prediction accuracy for Hunan and Yunnan regions. Model performance was slightly worse than the case of the combination of all input parameters, indicating that removing Rs from the model input did not significantly decrease the prediction accuracy of the model.
Figure 15. Spatial performance of the model using the input parameter combination Tmax·Tmin·WS·RH·E601.
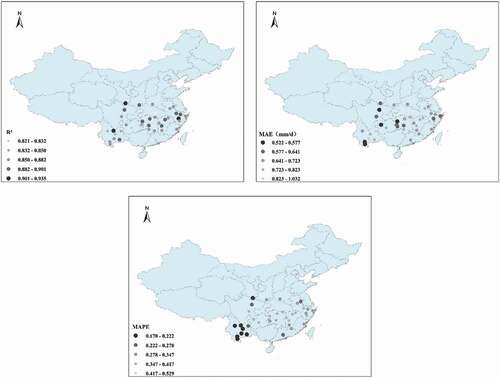
shows the model performance in training with the input parameter combination Tmax·Tmin·WS·RH·Rs. It can be seen that the model shows good prediction accuracy for Epan for most stations, with R2 > 0.876, MAE < 0.749, and MAPE < 0.39. Model performance is relatively good for the central region but relatively poor for Guangzhou, Fuzhou, and other coastal areas.
Figure 16. Spatial performance of the model using the input parameter combination Tmax·Tmin·WS·RH·Rs.
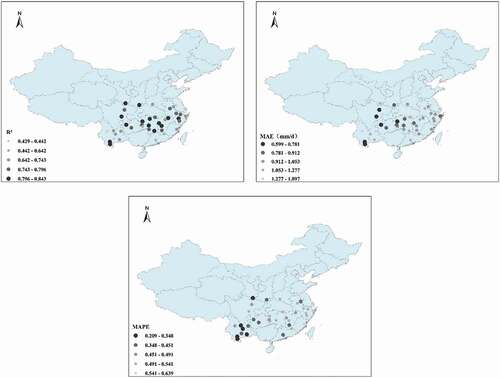
shows the model performance in training for the input parameter combination Tmax·Tmin·WS·RH. It can be seen that the model has good predictive accuracy for Epan for most stations, with R2 > 0.797, MAE < 0.827, and MAPE < 0.39. The model performance was relatively good for the central region and relatively poor for the North–South division at Nanyang and Ankang. The model performance was slightly worse when compared with the same input parameter combination with the incorporation of E601, indicating that incorporation of E601 improved model performance.
Figure 17. Spatial performance of the model using the input parameter combination Tmax·Tmin·WS·RH
shows the model performance for the input parameter combination Tmax·Tmin·E601. It can be seen that the model has good predictive accuracy for Epan for most sites, with R2 > 0.821, MAE < 1.032, and MAPE < 0.538. Model performance was slightly worse than for the input parameter combination Tmax·Tmin·WS·RH·E601, indicating that the removal of RH and WS did not significantly reduce the accuracy of the model. We concluded that Tmax, Tmin, and E601 are the key input parameters of the model.
Figure 18. Spatial performance of the model using the input parameter combination Tmax·Tmin·E601
shows the model trained with Tmax·Tmin as input. All three statistical indexes show that the model is a poor predictor of Epan for most sites, with the lowest value of R2 being 0.429, MAE = 1.897, and MAPE = 0.642. The performance for coastal areas was particularly poor.
Figure 19. Spatial performance of the model using the input parameter combination Tmax·Tmin
shows the model in training with E601 as the only input. The three statistical indicators show that the model prediction of Epan was relatively good for most sites, with R2 > 0.527 (up to 0.897), MAE < 1.407, and MAPE < 0.968. Although there was only one input parameter, model prediction accuracy was relatively good, which makes the model very suitable for regions or stations where meteorological data are scarce or sparse. The model performed relatively well for Yunnan and relatively badly for Guangzhou, Fuzhou, Zhejiang, and other coastal areas.
Figure 20. Spatial performance of the model using the input parameter E601
4 Discussion
We evaluated the ability of the ELM to predict E20 and E601 evaporation and compared the performance of the model using atmospheric and evaporation data for different sites in South China. The atmospheric parameters Tmax, Tmin, WS, RH, and RS were obtained from conventionally recorded meteorological data, and E20 data and E601 data time series were obtained from each station. The results show that satisfactory model predictive accuracy was obtained for all sites in the study. However, when predicting E20 or E601 evaporation, the accuracy of the model was very poor when Tmax and Tmin were used as input parameters in training or testing. Predictive accuracy was improved when E20 or E601 was the only input, or when only a minimum set of parameters was needed or available, which was the case for areas or stations with limited meteorological data collection. The prediction of E20 or E610 was much more accurate when E610 or E20 data were incorporated with the input parameter combination Tmax·Tmin. A great advantage of these three-parameter input combinations is that the required parameter data are small in number and easy to obtain. We therefore recommend that for most sites only the above three parameters be used. When predicting E20 or E601, the model performs best with the most input data, which means that the model becomes more accurate in Epan estimation as the number of input parameters increases. When E20 is predicted using the input parameter combination Tmax·Tmin·WS·RH·Rs·E601, model performance is significantly improved over the input parameter combinations Tmax·Tmin·WS·RH·E601 and Tmax·Tmin·WS·RH·Rs. However, when E601 is predicted using the input parameter combination Tmax·Tmin·WS·RH·Rs·E20, in comparison with Tmax·Tmin·WS·RH·E20 or Tmax·Tmin·WS·RH·Rs, average R2 increased by 0.26%, average MAE decreased by 0.33% and average MAPE decreased by 0.50%. The difference is very small; in relative terms, average R2 increased by 7.60%, average MAE decreased by 11.17% and average MAPE decreased by 13.43%. The best input parameter combinations were Tmax·Tmin·WS·RH·Rs·E601 for predicting E20 and Tmax·Tmin·WS·RH·E20 for predicting E601.
Previous studies mostly used meteorological parameters as input parameters. In this study, we incorporated evaporation pan data with meteorological parameters. In comparison with previous studies (Feng et al. Citation2018, Sebbar et al. Citation2019, Wu et al. Citation2020), the addition of evaporation data to meteorological data significantly improved model predictive accuracy. This is consistent with the research conclusion of Roozbeh et al. (Citation2018). They added solar radiation, precipitation, and evaporation information to predict Epan, which significantly improved the accuracy of the model. This occurred because there is a close correlation between this meteorological information and evaporation data (Keshtegar and Kisi Citation2017, Kisi and Heddam Citation2019, Qasem et al. Citation2019).
Accuracy using five meteorological variables (R2 = 0.931) to predict E20 was very high. Adding E601 data improved model performance only slightly (R2 = 0.950). In contrast, when E601 is predicted for the first time, the prediction performance of E601 is much lower (R2 = 0.749). At this time, when E20 data is added, the prediction performance of E601 will increase to R2 = 0.805, with a relatively large increase. Thus when there are fewer meteorological parameters, model predictive accuracy will increase more when evaporation data are added. Because there is a certain correlation between each pair of input factors, the collinearity between them increases with an increase in the number of factors. The model with complete input data performed best when predicting E20 or E601, which indicates that each climate variable has an increasing effect on the accuracy of Epan prediction. As the number of input parameters increased, the model became more accurate in predicting Epan, which agrees well with the results of previous studies (Wang et al. Citation2017b). Roozbeh et al. (Citation2018), Qasem et al. (Citation2019), and Kisi and Heddam (Citation2019) suggest that adding rainfall and sunshine duration as parameters greatly increases prediction accuracy for Epan because they are closely related, which is an issue for further investigation in follow-up research.
Furthermore, in the conversion between E20 and E601, it is found that the model performs significantly worse when E20 data is used to predict E601 evaporation than when E601 data is used to predict E20 evaporation, which is because the positions of E20 and E601 are different. Due to the small volume of the small evaporator, the metal wall is exposed to the air, and its evaporation capacity is quite different from the actual evaporation capacity, which cannot represent the actual evaporation capacity. Therefore, it is greatly affected by meteorological conditions (Liu and Wang Citation2013). E601 is buried underground and greatly affected by ground heat flux (Cui Citation2007). Also, because its construction principle and installation position are closer to the natural state, the measured evaporation is closer to the actual evaporation (Song and Wang Citation2010). Therefore, since the influence of geothermal flux is not considered, the performance of E601 prediction using five meteorological variables and E20 is much worse. Additionally, different seasons also have an impact on Epan prediction (Wang et al. Citation2019), so further research is needed to analyse the model performance in different seasons.
The spatial distribution of errors suggests that geographical location also affects model predictive accuracy, which is consistent with previous studies (Wang et al. Citation2019). We found that the model was not very stable and performed relatively poorly for stations where South China and North China meet (the Qinling–Huaihe line). This is due to the large difference in climate and the corresponding increased uncertainty in factors in this area, which affects the performance of the model. The model also performed poorly for coastal areas due to the sea breeze and other marine factors. In contrast, the model performs better for areas like Yunnan, Hunan, and Jiangxi. More site data can be incorporated into subsequent studies to increase the applicability of the model.
5 Conclusion
We used an ELM model to predict E20 and E601 evaporation using meteorological data for 38 meteorological observation stations in South China to identify the effects of evaporation data on model performance. The results show that the ELM model performed well in predicting E20 and E601. The best parameter combination for E20 prediction was Tmax·Tmin·WS·RH·Rs·E601, and the best parameter combination for E601 prediction was Tmax·Tmin·WS·RH·Rs·E20. For areas where data is relatively scarce, we recommend using Tmin·Tmax·E20 or Tmin·Tmax·E601 as the input combination.
The model performs better in converting between E20 and E601 when E601 data is used to predict E20 evaporation than when E20 data is used to predict E601 evaporation; the difference in R2 was between 14.8% and 19.2%. Incorporating evaporation pan data into the meteorological data significantly improved model predictive accuracy, increasing R2 by between 2.16% and 40.33%.
Geographical location also has an impact on model performance. The model performs worse for the area at the boundary between South China and North China (the Qinling–Huaihe line) and for the coastal area, and better for Yunnan, Hunan, and Jiangxi. In conclusion, we strongly recommend the use of the ELM to predict E601 and E20 in South China using meteorological parameters and evaporation data.
Disclosure statement
No potential conflict of interest was reported by the authors.
Additional information
Funding
References
- Allawi, M.F. and El-Shafie, A., 2016. Utilizing RBF-NN and ANFIS methods for multi-lead ahead prediction model of evaporation from reservoir. Water Resources Management, 30 (13), 4773–4788. doi:https://doi.org/10.1007/s11269-016-1452-1
- Antonopoulos, V.Z. and Antonopoulos, A.V., 2017. Daily reference evapotranspiration estimates by artificial neural networks technique and empirical equations using limited input climate variables. Computers and Electronics in Agriculture, 132, 86–96. doi:https://doi.org/10.1016/j.compag.2016.11.011
- Bai, Z., Kasun, L.L.C., and Huang, G.B., 2015. Generic object recognition with local receptive fields based extreme learning machine. Procedia Computer Science, 53, 391–399. doi:https://doi.org/10.1016/j.procs.2015.07.316
- Chu, R.H., et al., 2018. Comparative analysis of small and E-601 pan evaporation and its conversion coefficient—Taking Jiangsu province as an example. Journal of the Meteorological Sciences, 38 (2), 247–257. doi:https://doi.org/10.3969/2016jms.0080
- Cui, F.M. 2007 Comparative analysis of observation between E601B and small evaporator Journal of Meteorological Research and Application, 28 (A02), 174–176. doi: https://doi.org/10.3969/j.issn.1673-8411.2007.z2.066
- Deo, R.C., Samui, P., and Kim, D., 2016. Estimation of monthly evaporative loss using relevance vector machine, extreme learning machine and multivariate adaptive regression spline models. Stochastic Environmental Research and Risk Assessment, 30 (6), 1769–1784. doi:https://doi.org/10.1007/s00477-015-1153-y
- Dewes, C.F., et al., 2017. Drought risk assessment under climate change is sensitive to methodological choices for the estimation of evaporative demand. PloS One, 12 (3), e0174045. doi:https://doi.org/10.1371/journal.pone.0174045
- Donohue, R.J., Mcvicar, T.R., and Roderick, M.L., 2010. Assessing the ability of potential evaporation formulations to capture the dynamics in evaporative demand within a changing climate. Journal of Hydrology, 386 (1), 186–197. doi:https://doi.org/10.1016/j.jhydrol.2010.03.020
- Eray, O., Mert, C., and Kisi, O., 2018. Comparison of multi-gene genetic programming and dynamic evolving neural-fuzzy inference system in modeling pan evaporation. Hydrology Research, 49 (4), 1221–1233. doi:https://doi.org/10.2166/nh.2017.076
- Feng, Y., et al., 2016. Comparison of ELM, GANN, WNN and empirical models for estimating reference evapotranspiration in humid region of Southwest China. Journal of Hydrology, 536, 376–383. doi:https://doi.org/10.1016/j.jhydrol.2016.02.053
- Feng, Y., et al., 2017. Modeling reference evapotranspiration using extreme learning machine and generalized regression neural network only with temperature data. Computers and Electronics in Agriculture, 136, 71–78. doi:https://doi.org/10.1016/j.compag.2017.01.027
- Feng, Y., et al., 2018. National-Scale assessment of pan evaporation models across different climatic zones of China. Journal of Hydrology, 564, 314–328. doi:https://doi.org/10.1016/j.jhydrol.2018.07.013
- Flammini, A., et al., 2018. Experimental analyses of the evaporation dynamics in bare soils under natural conditions. Water Resources Management, 32 (3), 1153c1166. doi:https://doi.org/10.1007/s11269-017-1860-x
- Fu, G.B., et al., 2014. Investigating the conversion coefficients for free water surface evaporation of different evaporation pans. Hydrological Processes, 18 (12), 2247–2262. doi:https://doi.org/10.1002/hyp.5526
- Ghorbani, M.A., et al., 2018. Pan evaporation prediction using a hybrid multilayer perceptron-firefly algorithm (MLP-FFA) model: case study in North Iran. Theoretical and Applied Climatology, 133 (3–4), 1119–1131. doi:https://doi.org/10.1007/s00704-017-2244-0
- Gundalia, M.J. and Dholakia, M.B., 2013. Estimation of pan evaporation using mean air temperature and radiation for monsoon season in Junagadh region. Journal of Engineering Research and Applications, 3 (6), 64–70. https://doaj.org/toc/2248-9622.
- Huang, G., et al., 2014. Semi-Supervised and unsupervised extreme learning machines. IEEE Transactions on Cybernetics, 44 (12), 2405–2417. doi:https://doi.org/10.1109/TCYB.2014.2307349
- Huang, G.B., 2014. An insight into extreme learning machines: random neurons, random features and kernels. Cognitive Computation, 6 (3), 376–390. doi:https://doi.org/10.1007/s12559-014-9255-2
- Huang, G.B., et al., 2015. Local receptive fields based extreme learning machine. IEEE Computational Intelligence Magazine, 10 (2), 18–29. doi:https://doi.org/10.1109/mci.2015.2405316
- Huang, G.B., Zhu, Q.Y., and Siew, C.K., 2006. Extreme learning machine: theory and applications. Neurocomputing, 70 (1), 489–501. doi:https://doi.org/10.1016/j.neucom.2005.12.126
- Jain, A. and Roy, T., 2017. Evaporation modelling using neural networks for assessing the self-sustainability of a water body. Lakes & Reservoirs: Research & Management, 22 (2), 123–133. doi:https://doi.org/10.1111/lre.12175
- Keshtegar, B. and Kisi, O., 2017. Modified response-surface method: new approach for modeling pan evaporation. Journal of Hydrologic Engineering, 22 (10), 04017045. doi:https://doi.org/10.1061/(ASCE)HE.1943-5584.0001541
- Keskin, M.E. and Terzi, Ö., 2006. Artificial neural network models of daily pan evaporation. Journal of Hydrologic Engineering, 11 (1), 65–70. doi:https://doi.org/10.1061/(ASCE)1084-0699(2006)11:1(65)
- Kisi, O. and Heddam, S., 2019. Evaporation modelling by heuristic regression approaches using only temperature data. Hydrological Sciences Journal, 64 (6), 653–672. doi:https://doi.org/10.1080/02626667.2019.1599487
- Liang, N.Y., et al., 2006. A fast and accurate on-line sequential learning algorithm for feed forward networks. IEEE Transactions on Neural Networks, 17 (6), 1411–1423. doi:https://doi.org/10.1109/TNN.2006.880583
- Liu, H.X., and Wang, F. 2013 Contrast Analysis of E-601B Versus Small-Sized Evaporation Pans Meteorological Science and Technology, 2013 (05), 852–856. doi: https://doi.org/10.3969/j.issn.1671-6345.2013.05.011
- Liu, W. and Sun, F., 2016. Assessing estimates of evaporative demand in climate models using observed pan evaporation over China. Journal of Geophysical Research Atmospheres, 121 (14), 8329–8349. doi:https://doi.org/10.1002/2016JD025166
- Lu, X., et al., 2018. Daily pan evaporation modeling from local and cross-station data using three tree-based machine learning models. Journal of Hydrology, 566, 668–684. doi:https://doi.org/10.1016/j.jhydrol.2018.09.055
- Malik, A., Kumar, A., and Kisi, O., 2018. Daily pan evaporation estimation using heuristic methods with gamma test. Journal of Irrigation and Drainage Engineering, 144 (9), 04018023. doi:https://doi.org/10.1061/(ASCE)IR.1943-4774.0001336
- Qasem, S.N., et al., 2019. Modeling monthly pan evaporation using wavelet support vector regression and wavelet artificial neural networks in arid and humid climates. Engineering Applications of Computational Fluid Mechanics, 13 (1), 177–187. doi:https://doi.org/10.1080/19942060.2018.1564702
- Rezaie-Balf, M., Kisi, O., and Chua, L.H., 2018. Application of ensemble empirical mode decomposition based on machine learning methodologies in forecasting monthly pan evaporation. Hydrology Research, 50 (2), 498–516. doi:https://doi.org/10.2166/nh.2018.050
- Roozbeh, M., et al., 2018. Coupling a firefly algorithm with support vector regression to predict evaporation in northern Iran. Engineering Applications of Computational Fluid Mechanics, 12 (1), 584–597. doi:https://doi.org/10.1080/19942060.2018.1482476
- Sebbar, A., Heddam, S., and Djemili, L., 2019. Predicting daily pan evaporation (Epan) from dam reservoirs in the mediterranean regions of Algeria: OPELM vs OSELM. Environmental Processes, 6 (1), 309–319. doi:https://doi.org/10.1007/s40710-019-00353-2
- Shiri, J., 2019a. Evaluation of a neuro-fuzzy technique in estimating pan evaporation values in low-altitude locations. Meteorlogical Applications, 26 (3), 204–212. doi:https://doi.org/10.1002/met.1753
- Shiri, J., et al., 2019b. Data splitting strategies for improving data driven models for reference evapotranspiration estimation among similar stations. Computers and Electronics in Agriculture, 162, 70–81. doi:https://doi.org/10.1016/j.compag.2019.03.030
- Singh, V.P. and Xu, C.Y., 1997. Evaluation and generalization of 13 mass-transfer equations for determining free water evaporation. Hydrological Processes, 11 (3), 311–323. doi:https://doi.org/10.1002/(sici)1099-1085(19970315)11:3<311::aid-hyp446>3.0.co;2-y
- Song, S.L., and Wang, B.L. 2010 Principle and Performance Comparison of Different Evaporation Sensors Meteorological Science and Technology, 38 (001), 111–113. doi: https://doi.org/10.3969/j.issn.1671-6345.2010.01.020
- Tavares, L.D., Saldanha, R.R., and Vieira, D.A.G., 2015. Extreme learning machine with parallel layer perceptrons. Neurocomputing, 166, 164–171. doi:https://doi.org/10.1016/j.neucom.2015.04.018
- Wang, K., et al., 2019. Pan coefficient sensitivity to environment variables across China. Journal of Hydrology, 572, 582–591. doi:https://doi.org/10.1016/j.jhydrol.2019.03.039
- Wang, L.C., et al., 2017a. Pan evaporation modeling using four different heuristic approaches. Computers and Electronics in Agriculture, 140, 203–213. doi:https://doi.org/10.1016/j.compag.2017.05.036
- Wang, L.C., et al., 2017b. Pan evaporation modeling using six different heuristic computing methods in different climates of China. Journal of Hydrology, 544, 407–427. doi:https://doi.org/10.1016/j.jhydrol.2016.11.059
- Wang, X. and Han, M., 2014. Online sequential extreme learning machine with kernels for nonstationary time series prediction. Neurocomputing, 145, 90–97. doi:https://doi.org/10.1016/j.neucom.2014.05.068
- Wu, L.F., et al., 2020. Hybrid extreme learning machine with meta-heuristic algorithms for monthly pan evaporation prediction. Computers and Electronics in Agriculture, 168, 105115. doi:https://doi.org/10.1016/j.compag.2019.105115
- Xu, C. and Singh, V.P., 2000. Evaluation and generalization of radiation-based methods for calculating evaporation. Hydrological Processes, 14 (2), 339–349. doi:https://doi.org/10.1002/(SICI)1099-1085(20000215)14:2<339::AID-HYP928>3.0.CO;2-O
- Xu, C. and Singh, V.P., 2001. Evaluation and generalization of temperature-based methods for calculating evaporation. Hydrological Processes, 15 (2), 305–319. doi:https://doi.org/10.1002/hyp.119
- Xu, C.Y. and Singh, V.P., 1998. Dependence of evaporation on meteorological variables at different time-scales and intercomparison of estimation methods. Hydrological Processes, 12 (3), 429–442. doi:https://doi.org/10.1002/(SICI)1099-1085(19980315)12:3<429::AID-HYP581>3.0.CO;2-A
- Zheng, J., Wang, J.H., and Li, H.W., 2011. Analysis of conversion coefficient of evaporation in Mengzi, Yunnan province. Journal of Meteorology and Environment, 27 (1), 45–47. doi:https://doi.org/10.3969/j.issn.1673-503X.2011.01.009
- Zuo, H.C., et al., 2016. Observational study on complementary relationship between pan evaporation and actual evapotranspiration and its variation with pan type. Agricultural and Forest Meteorology, 222 (2016), 1–9. doi:https://doi.org/10.1016/j.agrformet.2016.03.002
Appendix
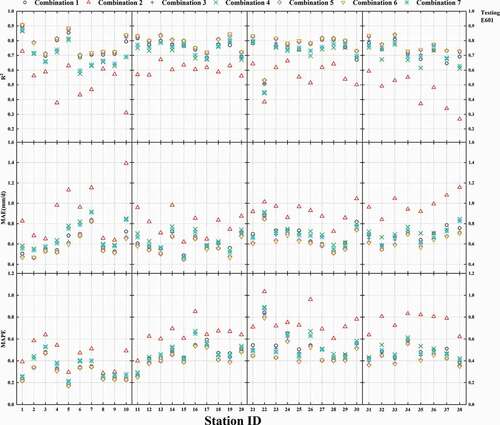
Figure A1. Use of the ELM model with different combinations of input parameters for 38 sites to calculate the statistical indexes for E20 (training)
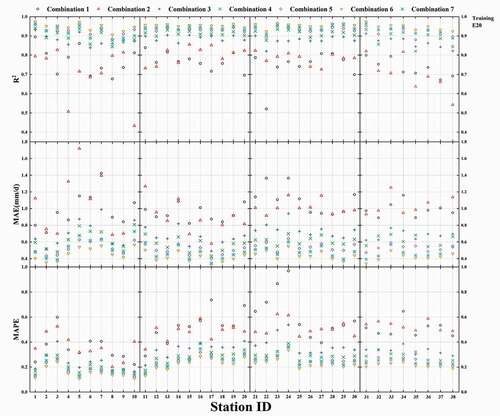
Figure A2. Use of the ELM model with different combinations of input parameters for 38 sites to calculate the statistical indexes for E20 (testing)
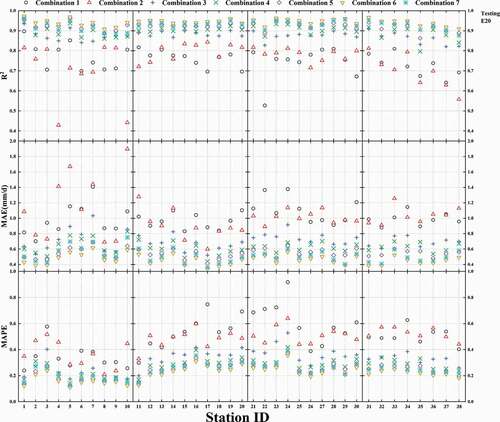
Figure A3. Use of the ELM model with different combinations of input parameters for 38 sites to calculate the statistical indexes for E601 (training)
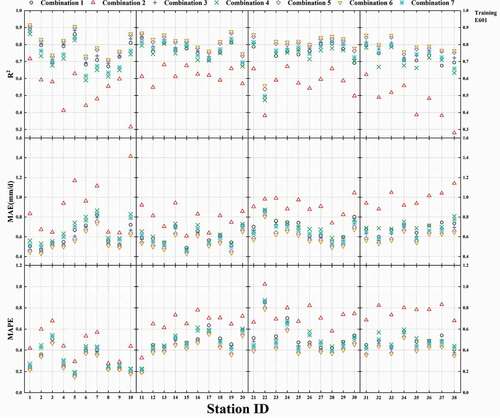
Figure A4. Use of the ELM model with different combinations of input parameters for 38 sites to calculate the statistical indexes for E601 (testing)