
 ?Mathematical formulae have been encoded as MathML and are displayed in this HTML version using MathJax in order to improve their display. Uncheck the box to turn MathJax off. This feature requires Javascript. Click on a formula to zoom.
ABSTRACT
The North Atlantic Oscillation (NAO) teleconnection is often cited as the leading mode of climate variability in Great Britain. The NAO has been found to produce significant rainfall deviations that vary in space and time. This study sought to analyse the effect of the NAO at the catchment scale across a large number of catchments in Great Britain across a long study period (1900–2015). We first quantify the effect of the NAO on rainfall and streamflow at a monthly scale, revealing distinctive spatio-temporal patterns under positive and negative phases of the NAO. Through a comparison of correlation analyses we also explore whether catchment characteristics moderate the propagation of NAO–rainfall deviations to streamflow, and classify catchments based on their resilience and susceptibility to NAO–rainfall deviations. In summary, our analyses combined contribute to an improved understanding of the hydrometeorological impact of the NAO in British catchments.
Editor
S. Archfield
Associate Editor(not assigned)
Introduction
The North Atlantic Oscillation (NAO) characterizes some of the variability in the speed and latitude of the North Atlantic Jet Stream (Woollings et al. Citation2014) and has long been understood as the primary atmospheric–oceanic circulation (teleconnection) affecting climate in Great Britain (Hurrell and Van Loon Citation1997, Rodwell et al. Citation1999, Folland et al. Citation2009, Rust et al. Citation2018). The NAO is commonly defined by the sea level pressure variation between the Icelandic low-pressure action point and the Azores anticyclone. Depending on conditions at these locations the NAO fluctuates between positive (NAO+) and negative (NAO−) phases, quantified by the North Atlantic Oscillation Index (NAOI). An NAO+ phase represents a stronger than usual difference between the Icelandic Low and Azores High, whilst an NAO− phase represents a weaker than usual difference (Hurrell et al. Citation2003).
Variability in the NAO can be explored across different temporal scales – multi-annual or sub-annual (daily/monthly/seasonal). Studies have examined the influence of sub-annual variations in the NAO on precipitation patterns in Great Britain, finding good correlations between the two (Wilby et al. Citation1997, Fowler and Kilsby Citation2002, West et al. Citation2019a). Spatial patterns in the strength and direction of correlations vary seasonally. In the winter months rainfall in the northwestern regions of Great Britain is strongly positively correlated with the NAO, while rainfall in the southern and eastern regions is generally negatively correlated (Simpson and Jones Citation2014, Rust et al. Citation2018). Therefore, NAO+ phases typically result in higher rainfall in the northwest, whilst NAO− phases result in drier conditions (West et al. Citation2019a). Whilst the winter months are marked by this northwest/southeast NAO rainfall signature, in summer the rainfall response is more spatially consistent (West et al. Citation2019a). Correlations are also typically negative between the NAOI and summer rainfall. This indicates that NAO+/− phases typically result in drier/wetter conditions, respectively, across the country (Folland et al. Citation2009, Hall and Hanna Citation2018); the inverse response is seen in winter rainfall in the northwestern regions.
As the NAO influences rainfall, it stands to reason that there may also be a relationship between NAO phase and streamflow, as the changing rainfall distributions propagate through catchments (Kingston et al. Citation2006). Investigating such climate–rainfall–streamflow relationships is necessary to improve our understanding of hydrological responses and how these might change in the future (Laize and Hannah Citation2010, Lavers et al. Citation2010).
Studies have found NAO–flow relationships across the North Atlantic region. In North America, Kingston et al. (Citation2007) and Berton et al. (Citation2017) report significant correlations between the NAO and discharge in New England (alongside the Atlantic Multi-Decadal Oscillation). Significant NAO–flow relationships have also been identified in Europe. Generally, positive winter correlations are found in northern Europe, in particular in the northwestern UK and Scandinavia, and negative correlations are found in southern areas across the southeast of the UK, France and the Mediterranean basin (Kingston et al. Citation2009, Wrzesinski and Paluszkiewicz Citation2011, Burt and Howden Citation2013, Rust et al. Citation2021a). NAO signals have also been identified in groundwater hydrographs (Lavers et al. Citation2015). For example, Rust et al. (Citation2019) report an average of 21.7% of groundwater storage variability across various aquifers in Britain is relatable to seven-year NAO cycles, with stronger relationships found in chalk and sandstone borehole locations in southern England where the NAO periodicity is linked with up to 40% of the groundwater variability. Wilby and Johnson (Citation2020) also report associations between the NAO and water temperatures, which vary in space and time across England.
However, there is also evidence that NAO–rainfall patterns do not propagate into discharge because the characteristics of the catchment’s moderate the rainfall-flow transfer, making them less susceptible to NAO-driven rainfall variability. For example, Rust et al. (Citation2021a) note that their identified seven-year NAO–flow relationship was found to be influenced by the response time of subsurface hydrological pathways. Phillips et al. (Citation2003) investigated the relationship between atmospheric–oceanic circulations and discharge in two British catchments: the chalk-dominated Itchen in southern England and the impermeable Ewe in Scotland. The strongest significant NAO–flow relationships were found in the Ewe catchment, especially in winter. Phillips et al. (Citation2003) proposed this was due to its location in the northwest and the dominance of surface runoff pathways. In contrast, the signal of the NAO in the Itchen was limited to the winter months, indicating that for the rest of the year its permeable bedrock and higher storage capacity mean that the catchment is less susceptible to NAO-related rainfall variability due to a more sustained baseflow contribution.
Catchments that lack moderating characteristics, such as permeable bedrock, are more susceptible to NAO-driven rainfall variability, which can be further amplified by topography. Burt and Howden (Citation2013) refer to the “double orographic enhancement” effect, where the NAO significantly increases the natural orographic enhancement of rainfall in upland areas of Britain. These enhanced NAO–rainfall signatures cascade down to streamflow; significant positive correlations were found across 86 flow gauge stations between the NAOI and seasonal river flow totals in winter, spring and autumn (Burt and Howden Citation2013). The most significant correlations were found in upland areas in northwest Scotland. These close NAO–flow relationships suggest that catchments with certain characteristics lack the ability to moderate NAO-driven rainfall variability. These characteristics include steep topography, low infiltration rates (Sibley Citation2010) and impermeable bedrock, as in the Ewe described previously (Phillips et al. Citation2003).
Given the variation in catchment characteristics across Great Britain (Chiverton et al. Citation2015), improving our understanding of the influence of the NAO on streamflow may allow for more effective water management decisions to be taken. Furthering our understanding of NAO–flow spatio-temporal relationships is also timely because:
Our ability to predict NAO variability across multiple temporal scales has notably improved in recent years (Baker et al. Citation2018; Parker et al. Citation2019, Athanasiadis et al. Citation2020, Smith et al. Citation2020).
Research continues to highlight the NAO’s role in influencing hydrometeorological extreme events (Burt and Howden Citation2013, Kingston et al. Citation2013, Rust et al. Citation2019, Tsanis and Tapoglou Citation2019). Catchments with moderating characteristics may prove to be more resilient to NAO-related hydrometeorological extremes.
Research by the UK Centre for Ecology and Hydrology (CEH) suggests that the NAOI may be a useful addition to flow forecasting models and could improve forecasting skill particularly in the north and west of Britain (UK Hydrological Outlook Citation2020). Similar evidence is developing in Irish flow modelling research (Donegan et al. Citation2021).
As far as we are aware, no study has yet explored NAO–rainfall–flow propagation in British catchments at a high spatial and temporal resolution. The recent release of historical hydrometeorological modelled datasets from CEH offers a new opportunity to undertake such an analysis, which has not previously been possible over long historical time periods for a large number of catchments. There is therefore value in using these new long-term and large-scale datasets to enhance our spatio-temporal understanding of sub-annual relationships between the NAO and streamflow in Britain, and a need to assess the extent to which catchment characteristics can moderate the effect of NAO-related rainfall deviations on discharge.
This study aims to meet this need by:
Quantifying long-term spatio-temporal relationships between the monthly NAO and rainfall and flows across 291 catchments in Great Britain.
Evaluating spatio-temporal NAO–rainfall and NAO–flow relationships and identifying the moderating effect of catchment characteristics.
Defining a classification that identifies catchments most resilient and most susceptible to NAO–rainfall deviations, to improve catchment understanding.
Methods
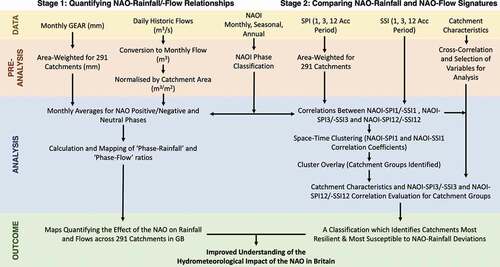
Many sub-annual NAO studies have focused on winter (e.g. Hurrell Citation1995, Kingston et al. Citation2006). However, Bower et al. (Citation2004) noted the importance of examining catchment sensitivity to climatic drivers across a whole annual cycle, and West et al. (Citation2019a) identify that the NAO rainfall spatial signature can vary markedly on a monthly basis. To avoid the recognized dilution of signatures across larger temporal scales, our study initially undertakes a monthly-scale analysis. A summary of the data and methods used in this study is shown in
Figure 1. Flowchart summarizing the key stages of the analysis.
Data and pre-analysis
NAOIs have long been used in similar research to quantify the NAO (Wilby et al. Citation1997, Folland et al. Citation2009, Hall and Hanna Citation2018, Rust et al. Citation2018); however, there is no fixed approach to defining the NAO (Hurrell and Deser Citation2009), and the choice of NAOI can have a notable influence on subsequent analyses. To avoid the known limitations of summer NAOIs calculated using measured sea level pressure data (station-based indices) (Pokorná and Huth Citation2015), an NAOI derived from a principal components (PC) analysis of the leading empirical orthogonal function of sea level pressure anomalies in the Atlantic region was used (Hurrell et al. Citation2003). PC-based indices are more accurate representations of spatial patterns of the NAO across a year (National Center for Atmospheric Research (NCAR) Citation2020). PC-based NAOIs calculated at the monthly, seasonal (December–January–February, DJF and June–July–August, JJA) and annual scales were used in this study, downloaded for the period January 1900–November 2015 from the National Center for Atmospheric Research (NCAR Citation2020).
The phase of the NAO can be defined in various ways, and classifying the monthly NAOI into positive, negative and neutral phases allows for the identification of clear NAO positive/negative signals as weaker “neutral” conditions can be removed (Berton et al. Citation2017). In this study the NAO phase was defined as half the standard deviation plus/minus the long-term mean of the NAOI (Berton et al. Citation2017). NAO+ phases were defined as having an NAOI > 0.502, and NAO− were defined as NAOI < −0.503. Months falling within this range were classified as NAO neutral months.
In Stage 1 of our analysis the NAO signal in rainfall and flows at the catchment scale was quantified. For rainfall, the monthly 1 km Gridded Estimates of Areal Rainfall (GEAR) dataset (Tanguy et al. Citation2016) from CEH was spatially averaged for each of the 291 catchments across the analysis period (average rainfall was calculated by area-weighting the 1 km gridded rainfall dataset (Equation 1):
where ri is the rainfall value of the 1 km pixel, ai is the area of the 1 km pixel that overlaps with the catchment boundary, and A is the total catchment area (ai/A is the proportion of the catchment covered by each 1 km pixel).
To represent streamflow a long-term historical dataset, also from CEH, was used. Reconstructions of daily river flows using the GR4J model for the 291 catchments across the analysis period (January 1900–November 2015) were extracted from a larger dataset (Smith et al. Citation2018). This dataset has been evaluated for high, medium and low flows and was found to produce quality representations of historical flows (Smith et al. Citation2019). The data used in this study represent the best-performing model from a 500-member ensemble (Smith et al. Citation2018). Given its long historical record this dataset has been noted as allowing for large-scale and long-term spatio-temporal investigations which have previously not been possible (Smith et al. Citation2019). The daily reconstructed flows (m3/s) were converted into monthly volumes (m3) and normalized by catchment area (m3/m2) for each month in the 116-year record. We will refer to this value, representing monthly runoff volume per unit area, as the “monthly flow index.”
In Stage 2, standardized indices for both precipitation and flows were used alongside the NAOI. Standardized indices were chosen for this stage of the analysis as they are scaled in relation to relative wetness/dryness (or high flows/low flows) over a specified accumulation period, and have been used in previous studies exploring the teleconnections between atmospheric–oceanic circulations and hydrometeorological signatures (Irannezhad et al. Citation2015, Kingston et al. Citation2015, West et al. Citation2019a). To represent precipitation, we use the CEH 5 km gridded Standardized Precipitation Index (SPI) dataset. The SPI dataset is normally distributed and has a standard period of 1961–2010 (Tanguy et al. Citation2017). Area-weighted SPI values, with one-month, three-month and 12-month accumulation periods, were initially calculated for each of the 291 catchments (following EquationEquation (1)(1)
(1) and substituting the 1 km gridded rainfall values for the 5 km gridded SPI). For flows, a similar Standardized Streamflow Index (SSI) dataset (Barker et al. Citation2018) was used. This SSI data was calculated using the reconstructed flow dataset described above (Smith et al. Citation2018), fitting a Tweedie distribution for a standard period of 1961–2010 (aligning with the SPI) (Barker et al. Citation2018). As with the SPI data, accumulation periods of one month, three months and 12-months were used. The range of datasets used, and the pre-analysis work, are summarized in .
Table 1. Datasets used in this study and associated pre-analysis work
The first two research aims identified above lend themselves to two distinct analytical stages. The combined outputs of these stages allow for a comprehensive assessment of NAO–rainfall–flow propagation at a monthly scale across a large number of catchments, and an improved understanding of the hydrometeorological impact of the NAO across Great Britain.
Stage 1: quantifying NAO–rainfall and NAO–flow relationships
The first stage of the analysis sought to quantify NAO–rainfall and NAO–flow relationships across the 291 catchments using the monthly GEAR rainfall and monthly flow index (m3/m2) datasets described above:
The area-weighted rainfall for each month and each catchment was averaged under NAO positive, negative and neutral conditions.
The average rainfall depth under NAO+ conditions was then divided by the average rainfall depth under NAO− conditions for the respective catchments and months.
This “phase–rainfall” ratio represents the change in rainfall depth between NAO+ and NAO− phases. A value close to 1 indicates that the catchment-averaged rainfall does not vary between phases, whereas increasing deviations on either side of 1 indicate successively larger rainfall differences between the two phases. A phase–rainfall ratio of 2 would mean that rainfall doubles in NAO+ relative to NAO− phases, and conversely a ratio of 0.5 would mean NAO+ rainfall is half that of NAO− conditions.
A similar “phase–flow” ratio was constructed on the basis of the ratio of the catchment area normalized flow (i.e. the monthly flow index defined above) between NAO+ and NAO− phases.
These phase ratios quantify the relative influence of the NAO on rainfall and flows for each month and across all 291 catchments, allowing for the identification of spatio-temporal NAO–rainfall and NAO–flow signatures.
Stage 2: comparing NAO–rainfall and NAO–flow signatures
Stage 2 of the analysis sought to compare rainfall and flow responses to the NAO to assess whether catchment characteristics moderate the propagation of NAO–rainfall deviations through to streamflow, and to explore how this varies in space and time. Spearman rank correlation tests were undertaken between the monthly NAOI and catchment-weighted SPI1 (SPI with a one-month accumulation period) and NAOI and SSI1.
These two sets of monthly correlations for the 291 catchments were used as separate inputs to a space–time clustering algorithm (Esri Citation2020). This analysis grouped together catchments with similar monthly NAOI–SPI1/NAOI–SSI1 correlation coefficients across the year. The clustering used a k-means algorithm, with spatially random starting seeds. The similarity in correlation coefficient values across catchments was assessed using the Euclidean distance between the time series values (the square root of the sum of squared differences in coefficient values across time) (Esri Citation2020). Rather than specify a fixed number of clusters to classify the catchments, the algorithm determined an optimal number of clusters. To do this, 90 space–time clustering solutions were produced, each containing between two and 10 catchment clusters. These clustering solutions were then evaluated using the pseudo-F statistic. This value is a measure of within-cluster similarity and between-cluster difference – in other words, how distinct each cluster is from another. The clustering solution with the highest pseudo-F statistic was identified as the optimal clustering output (Esri Citation2020). For both sets of correlation time series, the algorithm determined the optimal number of clusters to be four.
The outputs of these analyses were two datasets that presented clusters of catchments with similar NAOI–SPI1/NAOI–SSI1 correlations across the year. These datasets were spatially overlaid to identify unique combinations of clusters from the two space–time clustering analyses. This resulted in a final classification where “catchment groups” could be identified based on similar NAO–rainfall (represented by the NAOI–SPI1 correlation cluster membership) and NAO–flow (represented by the NAOI–SSI1 correlation cluster membership) responses.
The local catchment characteristics of each catchment group (the unique combination of SPI and SSI clustering results) were then explored. Catchment characteristics influence the hydrological processes within each catchment, and the efficiency of the rainfall–streamflow transfer – for example, impermeable geology increasing the speed of runoff resulting in shorter flow response times. Box plots presenting the range of various catchment characteristics (including altitude, landcover, geology and the baseflow index (BFI)) were produced for each catchment group. We acknowledge that in this study we have only looked at catchment size, landcover, topography and geology and have not accounted for the potential compounding effects of inter-basin transfers, flood attenuation measures or other human alterations of the catchment system.
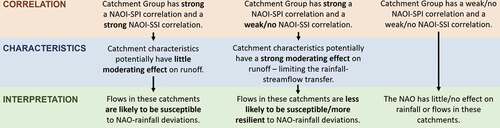
It stands to reason that in catchments with similar NAOI–SPI and NAOI–SSI correlations the characteristics potentially have little moderating effect on runoff – therefore flows in these catchments are likely to be susceptible to NAO–rainfall deviations. Meanwhile, in catchments where NAOI–SPI correlations are not replicated between NAOI and SSI, the characteristics have a potentially greater effect on moderating runoff and slowing the flow response time – these catchments are therefore likely to be less susceptible/more resilient to NAO–rainfall deviations ().
Figure 2. Interpretation of the correlation results in relation to the effect of local catchment characteristics.
The final stage of the analysis sought to establish whether the spatio-temporal patterns in NAO response identified at the monthly scale were present at other (sub-)annual time scales. To explore relationships at the seasonal (three-monthly) time scale, Spearman correlations were run between the winter NAOI (DJF) and February SPI3/SSI3 and between the summer NAOI (JJA) and August SPI3/SSI3. At the annual scale a final set of correlations were run between the annual NAOI and SPI12/SSI12 for December. These additional sets of correlations were plotted for the catchment groups identified earlier, allowing an evaluation of consistency in NAO rainfall and flow responses across multiple time scales.
Results
Stage 1: quantifying NAO–rainfall and NAO–flow relationships
present the monthly phase–rainfall and phase–flow ratios, which quantify the influence of NAO+ and NAO− phases. The results show clear monthly and seasonal differences in the strength and distribution of the NAO’s hydrometeorological signature. In both figures, values greater than 1 indicate that average monthly rainfall/flows are higher under NAO+ than NAO−, while values less than 1 indicate average rainfall/flows are lower under NAO+. Catchments where the NAO± change is minimal (i.e. within 25% – 0.75–1.25) are shaded yellow.
Figure 3. Monthly phase–rainfall ratios showing change in catchment area-weighted rainfall between NAO+ and NAO− phases.
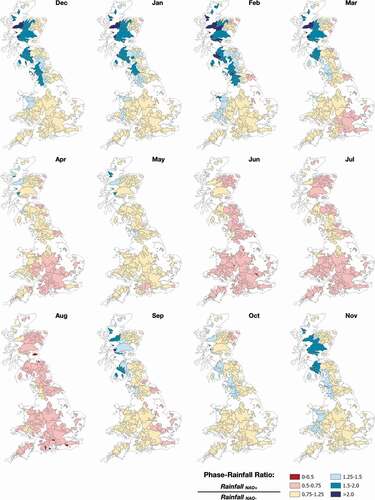
Figure 4. Monthly phase–flow ratios showing change in runoff per unit area (m3/m2) (Monthly Flow Index) between NAO+ and NAO− phases.
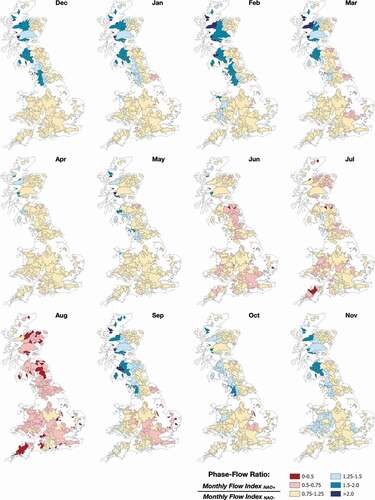
During the winter months a general northwest and southeast pattern can be observed in the rainfall and flow response to NAO+ and NAO− phases. Catchments in the northwest see a significant uplift in rainfall under NAO+ phases which cascades down to streamflow in catchments. During winter some northwest catchments see flows 1.5–2.0 times higher during NAO+ phases, while flows in the majority of the southern/eastern catchments experience change within 25% between the two NAO phases.
In spring and early summer, the rainfall and flow signatures start to differ, and the distinct winter spatial pattern generally becomes more homogeneous. Throughout summer, an NAO+ phase results in consistent reductions in rainfall (25–50%) compared to an NAO− phase. Whilst this is reflected in some catchments, many are within 25% deviation, and catchments where flows are reduced by 25–50% (0.5–0.75) in June and July are dispersed throughout the country. However, in August the majority of the 291 catchments see a 25–50% reduction, with some catchments where flows are more than halved (0–0.5) under an NAO+ phase compared to NAO−.
Stage 2: comparing NAO–rainfall and NAO–flow patterns
presents two sets of time-series clusters, representing monthly correlations between the NAOI and SPI1, and between NAOI and SSI1. As in the phase–rainfall analysis above, the correlations between NAOI and SPI1 show a clear spatio-temporal response to the NAO in rainfall patterns. Across all months there is a clustering of values northwest/southeast across the country, with the greatest between-cluster differences observed in the winter months (represented by the average value plot for the NAOI–SPI1 correlations). In winter a similar space–time signal can be observed in the NAOI–SSI1 correlations. In summer the between-cluster differences are minimal for the NAOI–SSI1 correlations, resulting in a less spatially distinctive space–time clustering, in particular in the central and southern region.
Figure 5. Space–time clusters for the NAOI–SPI1 and NAOI–SSI1 correlation analyses. The cluster colour on each map is the colour of the line in the respective graph. The plots represent the average value per cluster for each calendar month.
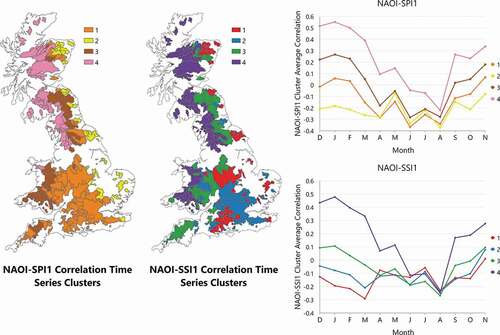
The two cluster datasets mapped in were combined to identify unique combinations of clusters from the two space–time clustering analyses (). In total eight combinations (out of a possible 16) were found, which we refer to as “catchment groups.” Catchment groups represent a collection of catchments with similar NAOI–SPI and NAOI–SSI correlation time series. These groupings are mapped in , alongside box plots presenting the range of the monthly NAOI–SPI1 and NAOI–SSI1 correlations for each group.
Table 2. Cluster combinations identified in the catchment group analysis
Figure 6. Catchment groupings identified in . Box plots represent the range of NAOI–SPI1/–SSI1 correlations for each grouping. There is no association between the symbology of the catchment groups and box plots. Low correlations (−0.2 to +0.2) are greyed out.
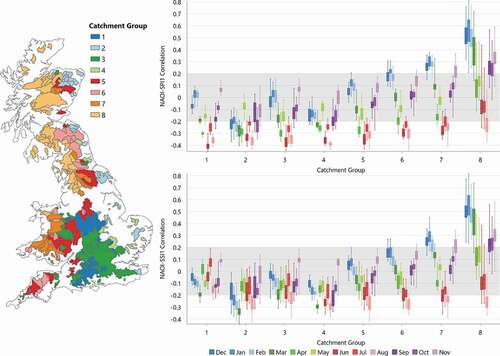
Within each group, similar winter NAO–rainfall and NAO–flow responses can be observed. For example, the largest catchment group (Group 8) is concentrated along the northwestern coastline. As previously described, these areas see significant increases/decreases in winter flows under NAO± conditions, which tend to mirror the NAO–rainfall signatures. However, notable differences across other catchment groups (in particular, Groups 1–5) can be seen in the summer months. For example, catchments within Group 1, concentrated in central/southern England, have negative correlations between NAOI and SPI1, which are not replicated in the NAOI–SSI1 correlations.
Seasonal and annual correlation analyses
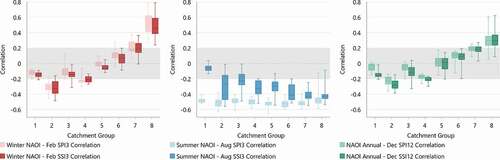
To evaluate the consistency of the monthly NAO–rainfall and NAO–flow responses at seasonal and annual scales, further sets of correlations were calculated and evaluated for the catchment groups (). Winter correlations between the three-month NAOI (DJF) and February SPI3/SSI3 show a very similar response to the monthly NAO–SPI/–SSI correlations (), with the most notable positive correlations being observed in Group 8 in the northwest. In the summer months, moderately stronger and relatively consistent NAOI–SPI3 negative correlations are observed across Groups 1–7. At the annual scale the NAO–rainfall and NAO–flow correlations show a similar pattern to that observed in winter – catchments in Group 8 continue to show positive correlations with the NAOI, while catchments for the majority of the country, in Groups 1–6, show weak annual correlations for both SPI12 and SSI12.
Figure 7. Seasonal and annual correlations for the eight catchment groups between the three-monthly/annual NAOI and SPI/SSI with longer accumulation periods.
Discussion
Monthly NAO–rainfall and NAO–flow relationships
The first aim of this study was to quantify the sub-annual spatio-temporal relationships between the NAO, rainfall and streamflow in Great Britain. This was analysed through the calculation and mapping of two ratios (phase–rainfall and phase–flow), representing the change in average monthly rainfall or flows between NAO+ and NAO− phases, respectively.
The magnitude of the NAOI is notably strong in the winter months, and these strong NAO+ and NAO− phases result in characteristic hydrometeorological patterns in Great Britain (Wilby et al. Citation1997, Fowler and Kilsby Citation2002, Folland et al. Citation2009, West et al. Citation2019a). Winter months are characterized by a northwest/southeast divide in the relationship between NAO and rainfall/streamflow, which we quantify using our phase–rainfall and phase–flow ratios. Catchments in the northwest see significant uplift in rainfall under NAO+ conditions (relative to NAO− conditions) which propagates through to higher streamflow. In some catchments, flows are as much as doubled when the NAO is positive compared to when it is negative. Less discernible differences between the two NAO phases are observed in both rainfall and flows in the southeast.
Whilst the magnitude of the NAOI is weaker in the summer months compared to winter (Folland et al. Citation2009), our phase–rainfall and phase–flow ratios show that the NAO also has a quantifiable effect on rainfall and streamflow in the summer months. However, the NAO± wet/dry response is the opposite of that in winter. NAO+ conditions can result in lower summer flows, with the strongest NAO+ summer flow signature being observed in August. During August, under average NAO+ conditions, a large number of catchments see a flow reduction of 25–50% compared to when the NAO is negative, and in some catchments, flows are more than halved.
The moderating effect of catchment characteristics
The second aim of this study was to compare correlations between the NAOI and rainfall (quantified by the SPI) and NAOI and streamflow (quantified by the SSI). We also explored whether catchment characteristics moderate the propagation of NAO–rainfall deviations through the hydrological cycle to influence discharge. The transfer of rainfall to streamflow is influenced by a number of different variables in British catchments (Chiverton et al. Citation2015, Barker et al. Citation2016, Rust et al. Citation2021a) and explores a range of catchment characteristic datasets for the catchment groups identified in and .
Figure 8. The baseflow index (BFI) and a range of local characteristics of the catchment groupings in . Colours for the characteristics are not associated with the BFI or the map of catchment groups. Catchment characteristics with variable units and values are plotted using a z-score standardization.
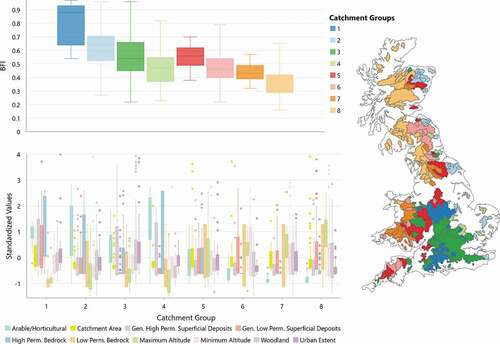
Catchments in the northwestern regions, as discussed earlier, are highly responsive to winter NAO-driven rainfall (generally in Groups 7 and 8). This is partly associated with their geographic location in relation to the influence of the NAO in the North Atlantic region. The phase of the NAO has been found to drive the location of storm tracks across the Atlantic (Visbeck et al. Citation2001; Brayshaw et al. Citation2010). Given their location along the northwestern coastline these catchments are likely to have strong NAO–rainfall relationships, as have been noted in previous studies (e.g. Rust et al. Citation2018, West et al. Citation2019a). In terms of their physical characteristics these catchments have low-medium BFI values. This is likely a result of their relatively high low-permeability bedrock coverage, restricting slower groundwater flow pathways and catchment storage capacity. Notably, these catchments are also high altitude () which is significant given that the NAO has been found to amplify the natural orographic enhancement of rainfall in upland regions of Great Britain (Burt and Howden Citation2013). These factors suggest that in the winter months these catchments do not have the characteristics necessary to moderate NAO–rainfall deviations, therefore the NAO–rainfall and NAO–flow patterns are similar ().
In contrast to Group 8, catchments in Group 1, which are located in central/southern England, have very weak NAO–rainfall and NAO–flow correlations. During the summer months moderate and consistent negative correlations between NAOI and SPI1 are present. This is also observed in the GEAR rainfall analysis, where much of the country sees a 25–50% reduction in rainfall under NAO+ phases relative to NAO−, a pattern also observed in other studies (Folland et al. Citation2009, West et al. Citation2019a). However, these negative NAOI–SPI1 correlations are not replicated in flows. Summer NAOI–SSI1 correlations for Group 1 are very weak. These catchments have high/very high BFI values, are low-lying and have high coverage of highly permeable superficial deposits and bedrock geologies. We suggest as a result of these local characteristics they are able to moderate the propagation of NAO–rainfall deviations through the catchment. For example, a 25–50% decrease in rainfall under NAO+ conditions described above is not transferred to a similar reduction in discharge.
Comparison across temporal scales
While catchments in the north and west typically show strong SSI1 relationships with short SPI accumulation periods, catchments in the central and southern regions (generally Catchment Groups 1, 3 and 4) have been found to have the strongest SPI–SSI1 correlations when SPI accumulation periods greater than one month have been used (Barker et al. Citation2016, West et al. Citation2019b). This raises the question as to whether the catchments identified as being able to moderate monthly NAO rainfall deviations (especially in the summer months) remain able to do so at longer seasonal/annual scales.
In winter the similarity in the seasonal and monthly analyses () suggests that these catchments in the northwest remain unable to moderate to winter NAO rainfall deviations across temporal scales. In the summer, the majority of catchments in the central and southern regions were identified as being able to moderate monthly NAO–rainfall deviations due to their characteristics (notably, NAO+ low-rainfall summers). These catchments show similar moderating ability at the seasonal scale, as the three-month NAOI (JJA) negative correlations with August SPI3 are not replicated in the NAOI–SSI3 correlations. In other words, the moderating characteristics of these catchment groups (such as their altitude, elevation and geologies; ) result in limited propagation of summer NAO rainfall signatures at both the monthly and three-monthly time scales.
The annual scale correlations between the annual NAOI and SPI12/SSI12 showed similar patterns to those observed in the winter months. This reinforces the importance of looking across a full annual cycle when exploring climate signatures in rainfall and flow datasets discussed in the introduction (Bower et al. Citation2004), as the summer patterns in rainfall, which are variably replicated in flows, are not fully represented at this temporal scale. This observation also reinforces the growing evidence base of distinct NAO summer signatures in Great Britain (Folland et al. Citation2009, Hall and Hanna Citation2018, West et al. Citation2019a). provides a summary of the multi-scale correlation analyses for the catchment groups.
Table 3. Summary of the multi-scale correlation analyses for the eight catchment groups (groups are mapped in , and characteristics are inferred from )
It should be noted that spatio-temporal variability in NAO rainfall signatures has been observed in other studies (Rust et al. Citation2021b, West et al. Citation2021) and deviations in rainfall across Great Britain and Europe have also been attributed to other atmospheric circulations, such as the East Atlantic Pattern and Scandinavian Pattern (Comas-Bru and McDermott Citation2014, Mellado-Cano et al. Citation2019). There is therefore scope to apply the long-term historical flow datasets used in this study to further understand NAO signature variability and the impact of other circulations on regional hydrology in Great Britain.
Conclusion
This study sought to firstly explore sub-annual NAO hydrometeorological signatures in 291 catchments across Great Britain. Through comparative analyses based on historical rainfall and flow datasets, we identify distinctive spatio-temporal flow responses of the NAO at the monthly scale across a long time period (1900–2015). In particular we note the spatial divide in NAO–flow response in winter compared with the more spatially consistent summer patterns.
Secondly, we sought to understand the extent to which local catchment characteristics might be able to moderate sub-annual NAO–rainfall–flow propagation. Through comparative analysis of rainfall and flow datasets we present a new understanding of the spatio-temporally variable nature of the propagation of NAO variability to flows as a result of the moderating effect of catchment characteristics. For example, catchments in the northwestern regions of Britain, due their location, topography and geology, typically show strong relationships between NAOI and rainfall, which persist during winter as correlations between NAOI and flows. The similarity of the two responses leads to the conclusion that these catchments have a limited ability to moderate NAO–rainfall deviations in winter. Meanwhile, during summer, we note that NAO rainfall signatures are present, for example the 25–50% reduction in rainfall under NAO+ phases relative to NAO− phases. However, for a large number of catchments in the central and southern regions of Britain, these signatures are not replicated in flows. These catchments are relatively flat and low-lying and have highly permeable geologies. We therefore conclude that these catchment characteristics moderate the propagation of NAO–rainfall deviations during the summer. As far as we are aware, this study represents the first spatially and temporally large-scale analysis of the sub-annual influence of the NAO on streamflow in Britain and presents new evidence as to the variable nature of the propagation of NAO variability to flows as a result of moderating catchment characteristics.
Disclosure statement
No potential conflict of interest was reported by the authors.
References
- Athanasiadis, P.J., et al., 2020. Decadal predictability of North Atlantic blocking and the NAO. Npj Climate and Atmospheric Science, 3 (20). doi:https://doi.org/10.1038/s41612-020-0120-6
- Baker, L.H., Shaffrey, L.C., and Scaife, A.A., 2018. Improved seasonal prediction of UK regional precipitation using atmospheric circulation. International Journal of Climatology, 38, 437–453. doi:https://doi.org/10.1002/joc.5382
- Barker, L.J., et al., 2016. From meteorological to hydrological drought using standardised indices. Hydrology and Earth System Sciences, 20 (6), 2483–2505. doi:https://doi.org/10.5194/hess-20-2483-2016
- Barker, L.J., et al., 2018. Historic Standardised Streamflow Index (SSI) using Tweedie distribution with standard period 1961-2010 for 303 UK catchments (1891-2015). NERC Environmental Information Data Centre. doi:https://doi.org/10.5285/58ef13a9-539f-46e5-88ad-c89274191ff9
- Berton, R., Driscoll, C.T., and Adamowski, J.F., 2017. The near-term prediction of drought and flooding conditions in the northeastern United States based on extreme phases of AMO and NAO. Journal of Hydrology, 552, 130–141. doi:https://doi.org/10.1016/j.jhydrol.2017.07.041
- Bower, D., Hannah, D.M., and McGregor, G.R., 2004. Techniques for assessing the climate sensitivity of river flow regimes. Hydrological Processes, 18 (13), 2515–2543. doi:https://doi.org/10.1002/hyp.1479
- Brayshaw, D.J., Hoskins, B., and Black, E., 2010. Some physical drivers of changes in the winter storm tracks over the North Atlantic and Mediterranean during the Holocene. Philosophical Transactions of the Royal Society of London A: Mathematical, Physical and Engineering Sciences, 366 (1931), 5185–5223.
- Burt, T. and Howden, N., 2013. North Atlantic Oscillation amplifies orographic precipitation and river flow in upland Britain. Water Resources Research, 49 (6), 3504–3515. doi:https://doi.org/10.1002/wrcr.20297
- Chiverton, A., et al., 2015. Which catchment characteristics control the temporal dependence structure of daily river flows. Hydrological Processes, 29 (6), 1353–1369. doi:https://doi.org/10.1002/hyp.10252
- Comas-Bru, L. and McDermott, F., 2014. Impacts of the EA and SCA patterns on the European 20th century NAO-winter climate relationship. Quarterly Journal of the Royal Meteorological Society, 140 (679), 354–363. doi:https://doi.org/10.1002/qj.2158
- Donegan, S., et al., 2021. Conditioning ensemble streamflow prediction with the North Atlantic Oscillation improves skill at longer lead times. Hydrology & Earth System Sciences, 25 (25), 4159–4183. doi:https://doi.org/10.5194/hess-25-4159-2021
- Esri, 2020. Space–time cluster analysis [online]. Available at: https://pro.arcgis.com/en/pro-app/tool-reference/spatial-statistics/space-time-analysis.htm [ Accessed 6 August 2020].
- Folland, C.K., et al., 2009. The summer North Atlantic Oscillation: past, present and future. Journal of Climate, 22 (5), 1082–1103. doi:https://doi.org/10.1175/2008JCLI2459.1
- Fowler, H.J. and Kilsby, C.G., 2002. Precipitation and the North Atlantic Oscillation: a study of climate variability in Northern England. International Journal of Climatology, 22 (7), 843–866. doi:https://doi.org/10.1002/joc.765
- Hall, R.J. and Hanna, E., 2018. North Atlantic circulation indices: links with summer and winter temperature and precipitation and implications for seasonal forecasting. International Journal of Climatology, 38 (S1), 660–677. doi:https://doi.org/10.1002/joc.5398
- Hurrell, J.W., 1995. Decadal trends in the North Atlantic Oscillation: regional temperatures and precipitation. Science, 269 (5224), 676–679. doi:https://doi.org/10.1126/science.269.5224.676
- Hurrell, J.W. and Deser, C., 2009. North Atlantic climate variability: the role of the North Atlantic Oscillation. Journal of Marine Systems, 78 (1), 28–41. doi:https://doi.org/10.1016/j.jmarsys.2008.11.026
- Hurrell, J.W., et al., 2003. An overview of the North Atlantic Oscillation. In, and J.W. Hurrell, et al., eds. The North Atlantic Oscillation: climate significance and environmental impact. 134. Washington: AGU Geophysical Monograph Series, .
- Hurrell, J.W. and Van Loon, H., 1997. Decadal variations in climate associated with the North Atlantic Oscillation. Climatic Change, 36 (3/4), 301–326. doi:https://doi.org/10.1023/A:1005314315270
- Irannezhad, M., et al., 2015. Variability in dryness and wetness in central Finland and the role of teleconnection patterns. Theoretical and Applied Climatology, 122 (3–4), 471–486. doi:https://doi.org/10.1007/s00704-014-1305-x
- Kingston, D.G., et al., 2007. Large-scale climatic controls on New England river flow. Journal of Hydrometeorology, 8 (3), 367–379. doi:https://doi.org/10.1175/JHM584.1
- Kingston, D.G., et al., 2009. Climate-river flow relationships across montane and lowland environments in Northern Europe. Hydrological Processes, 23 (7), 985–996. doi:https://doi.org/10.1002/hyp.7202
- Kingston, D.G., et al., 2013. Ocean-atmosphere forcing of summer streamflow drought in Great Britain. Journal of Hydrometeorology, 14 (1), 331–344. doi:https://doi.org/10.1175/JHM-D-11-0100.1
- Kingston, D.G., et al., 2015. European-Scale drought: understanding connections between atmospheric circulation and meteorological drought indices. Journal of Climate, 28 (2), 505–516. doi:https://doi.org/10.1175/JCLI-D-14-00001.1
- Kingston, D.G., Lawler, D.M., and McGregor, G.R., 2006. Linkages between atmospheric circulation, climate and streamflow in the North Atlantic: research prospects. Progress in Physical Geography: Earth and Environment, 30 (2), 143–174. doi:https://doi.org/10.1191/0309133306pp471ra
- Laize, C.L.R. and Hannah, D.M., 2010. Modification of climate-river flow associations by basin properties. Journal of Hydrology, 389 (1–2), 186–204. doi:https://doi.org/10.1016/j.jhydrol.2010.05.048
- Lavers, D., Hannah, D.M., and Bradley, C., 2015. Connecting large-scale atmospheric circulation, river flow and groundwater levels in a chalk catchment in Southern England. Journal of Hydrology, 523, 179–189. doi:https://doi.org/10.1016/j.jhydrol.2015.01.060
- Lavers, D., Prudhomme, C., and Hannah, D.M., 2010. Large-scale climate, precipitation and British river flows: identifying hydrological connections and dynamics. Journal of Hydrology, 395 (3–4), 242–255. doi:https://doi.org/10.1016/j.jhydrol.2010.10.036
- Mellado-Cano, J., et al., 2019. Examining the North Atlantic Oscillation, East Atlantic Pattern jet variability since 1685. Journal of Climate, 32 (19), 6285–6298. doi:https://doi.org/10.1175/JCLI-D-19-0135.1
- National Center for Atmospheric Research (NCAR), 2020. Hurrell North Atlantic Oscillation (NAO) Index (PC-Based) [online]. Available from: https://climatedataguide.ucar.edu/climate-data/hurrell-north-atlantic-oscillation-nao-index-pc-based, [ Accessed 30 June 2020].
- Parker, T., et al., 2019. Seasonal predictability of the winter North Atlantic Oscillation from a Jet Stream perspective. Geophysical Research Letters, 46 (16), 10159–100167. doi:https://doi.org/10.1029/2019GL084402
- Phillips, I.D., et al., 2003. Regional climate and atmospheric circulation controls on the discharge of two British rivers 1984-97. Theoretical and Applied Climatology, 76 (3–4), 141–164. doi:https://doi.org/10.1007/s00704-003-0021-8
- Pokorná, L. and Huth, R., 2015. Climate impacts of the NAO are sensitive to how the NAO is defined. Theoretical and Applied Climatology, 119 (3–4), 639–652. doi:https://doi.org/10.1007/s00704-014-1116-0
- Rodwell, M.J., Rowell, D.P., and Folland, C.K., 1999. Oceanic forcing of the wintertime North Atlantic Oscillation and European climate. Nature, 398 (6725), 320–323. doi:https://doi.org/10.1038/18648
- Rust, W., et al., 2018. A conceptual model for climatic teleconnection signal control on groundwater variability in Europe. Earth-Science Reviews, 177, 164–174. doi:https://doi.org/10.1016/j.earscirev.2017.09.017
- Rust, W., et al., 2019. Understanding the potential of climate teleconnectionsto project future groundwater drought. Hydrology and Earth System Sciences, 23 (8), 3233–3245. doi:https://doi.org/10.5194/hess-23-3233-2019
- Rust, W., et al., 2021a. Exploring the role of hydrological pathways in modulating North Atlantic Oscillation (NAO) teleconnection periodicities from UK rainfall to streamflow. Hydrology and Earth System Sciences, 25 (4), 2223–2237. doi:https://doi.org/10.5194/hess-25-2223-2021
- Rust, W., et al., 2021b. Non-stationary control of the NAO on European rainfall and its implications for water resources management. Hydrological Processes, 35 (3), e14099. doi:https://doi.org/10.1002/hyp.14099
- Sibley, A., 2010. Analysis of extreme rainfall and flooding in Cumbria 18-20 November 2009. Weather, 65 (11), 287–292. doi:https://doi.org/10.1002/wea.672
- Simpson, I.R. and Jones, P.D., 2014. Analysis of UK precipitation extremes derived from Met Office Gridded Data. International Journal of Climatology, 34 (7), 2438–2449. doi:https://doi.org/10.1002/joc.3850
- Smith, K.A., et al., 2018. Historic reconstructions of daily river flow for 303 UK catchments (1891-2015). NERC Environmental Information Data Centre. doi:https://doi.org/10.5285/f710bed1-e564-47bf-b82c-4c2a2fe2810e
- Smith, K.A., et al., 2019. A multi-objective ensemble approach to hydrological modelling in the UK: an application to historic drought reconstruction. Hydrology and Earth System Sciences, 23 (8), 3247–3268. doi:https://doi.org/10.5194/hess-23-3247-2019
- Smith, D.M., et al., 2020. North Atlantic climate far more predictable than models imply. Nature, 583 (7818), 796–800. doi:https://doi.org/10.1038/s41586-020-2525-0
- Tanguy, M., et al., 2016. Gridded estimates of daily and monthly areal rainfall for the United Kingdom (1890–2015) [CEH GEAR]. NERC Environmental Information Data Centre. doi:https://doi.org/10.5285/33604ea0-c238-4488-813d-0ad9ab7c51ca.
- Tanguy, M., et al., 2017. Historic gridded standardized precipitation index for the United Kingdom 1862–2015 (generated using gamma distribution with standard period 1961–2010) v4. NERC Environmental Information Data Centre. doi:https://doi.org/10.5285/233090b2-1d14-4eb9-9f9c-3923ea2350ff.
- Tsanis, I. and Tapoglou, E., 2019. Winter North Atlantic Oscillation impact on European precipitation and drought under climate change. Theoretical and Applied Climatology, 135 (1–2), 323–330. doi:https://doi.org/10.1007/s00704-018-2379-7
- UK Hydrological Outlook, 2020. UK hydrological outlook December 2020 [online]. Available from: http://www.hydoutuk.net/files/2816/0743/4122/2020_12_HO_Complete.pdf [ Accessed 14 December 2020].
- Visbeck, M.H., et al., 2001. The North Atlantic Oscillation: past, present and future. Proceedings of the National Academy of Sciences of the United States of America, 98 (23), 12876–12877. doi:https://doi.org/10.1073/pnas.231391598
- West, H., Quinn, N., and Horswell, M., 2019a. Regional rainfall response to the North Atlantic Oscillation (NAO) across Great Britain. Hydrology Research, 50 (6), 1549–1563. doi:https://doi.org/10.2166/nh.2019.015
- West, H., Quinn, N., and Horswell, M., 2019b. Spatial variations in the relationship between precipitation and streamflow in Great Britain. International Union of Geodesy and Geophysics General Assembly. 10 July 2019. Montreal, Canada.
- West, H., Quinn, N., and Horswell, M., 2021. Spatio-temporal variability in North Atlantic Oscillation monthly rainfall signatures in Great Britain. Atmosphere, 12 (6), 763. doi:https://doi.org/10.3390/atmos12060763
- Wilby, R.L. and Johnson, M.F., 2020. Climate variability and implications for keeping rivers cool in England. Climate Risk Management, 30, 100259. doi:https://doi.org/10.1016/j.crm.2020.100259
- Wilby, R.L., O’Hare, G., and Barnsley, N., 1997. The North Atlantic Oscillation and British Isles climate variability. Weather, 52 (9), 266–276. doi:https://doi.org/10.1002/j.1477-8696.1997.tb06323.x
- Woollings, T., Czuchnicki, C., and Franzke, C., 2014. Twentieth century North Atlantic jet variability. Quarterly Journal of the Royal Meteorological Society, 140 (680), 783–791. doi:https://doi.org/10.1002/qj.2197
- Wrzesinski, D. and Paluszkiewicz, R., 2011. Spatial differences in the impact of the North Atlantic Oscillation on the flow of rivers in Europe. Hydrology Research, 42 (1), 30–39. doi:https://doi.org/10.2166/nh.2010.077