
ABSTRACT
Psychological frameworks are rarely used to understand irrigation adoption behaviour in developing countries. A Bayesian belief network (BBN) model was developed that integrated socio-economic characteristics and psychological factors to understand farmer behaviours with respect to irrigation practices in four districts of Maharashtra, India. Strong norms, risk perceptions of water scarcity, and attitude play roles in the adoption of irrigation technology and practices. Critically, it was found that no one factor can explain adoption behaviour; rather, an ensemble of factors is needed to understand farmer behaviour. A farmer who is highly educated, middle-aged, and moderately wealthy with a significant level of family help and an open well as their main water source, while receiving low promotional information related to water scarcity and irrigation adoption, is most likely to adopt irrigation technology. The application of the BBN in this study enables stakeholders and policymakers to better understand the linkages between different factors and behaviour.
Editor S. Archfield; Guest Editor M. Haeffner
1 Introduction
Cotton plays a crucial role in India’s agriculture and textile industries. Over 45 million people are employed in the textile industry, excluding farmers, making it the second largest provider of employment in the country, behind only agriculture (CCI Citation2012). The state of Maharashtra accounts for the largest area of cotton cultivation in India and is the second largest producer of cotton (Landry and Sood Citation2012). However, some districts in Maharashtra are known for the struggles of their farmers, leading to high rates of suicide and debt accretion (Mitra and Shroff Citation2007, Behere and Behere Citation2008).
Cotton in India is dependent upon unpredictable monsoons for its water supply, leading to variability and thus difficulty in planning for and sustaining crop success, which, combined with increasing water demand, only worsens the hydrological situation in India (Bhuiyan et al. Citation2009, Landry and Sood Citation2012, Cole et al. Citation2013). Cotton is the primary crop grown in the Maharashtra with most farmers also growing a combination of staple crops including pulses (84% of farmers also grow pulses), soybeans (49%), wheat (15%), and other vegetables (9%). The region is dominated by monsoonal storms that occur in the summer, with the rest of the year being very dry. Thus, water storage during the monsoon season can be very important. Typically, the monsoon can sustain farmers during the growth season, but this is not always the case, especially with a changing climate.
Irrigation provides a potential solution to at least the problem of water scarcity. Farmers that have the capacity to store water and irrigate or, better yet, use micro-irrigation (drip irrigation and sprinkler irrigation over flood or furrow irrigation) tend to have more success from year to year and, perhaps more importantly, less dramatic variability (Rajak et al. Citation2006, Ramesh et al. Citation2006, Namara et al. Citation2007). Not having access to irrigation also directly limits a farmer’s sense of control over his farming success and welfare, which are tied to cases of depression (Mirowsky and Ross Citation1990, Dessart et al. Citation2019). Farmers have pointed to increasing debt, government apathy, environmental problems, poor prices, and poor irrigation as the main reasons for their poor mental health (Dongre and Deshmukh Citation2012), which may be responsible for high rates of suicide in the study area. Yet over 70% of Central India’s cotton is rainfed, with no irrigation supplement (Landry and Sood Citation2012).
Of these farmers who are able to irrigate, there are few technologies employed: flood or furrow irrigation, drip irrigation, and, rarely, sprinkler irrigation. The source of irrigation water for farmers is primarily open wells (wells roughly 5–20 m in diameter blasted 20–60 m deep with dynamite through the volcanic bedrock that underlies the surface) and earthen check dams for those lucky enough to have surface water channels nearby. The soil depth in the area can be on the order of centimetres before it reaches hard bedrock, of which fracture connections and local secondary porosity are not understood. Both the open wells and check dams fill up directly from precipitation in the summer monsoon season and dry up usually by late fall. Thus, the water storage in the area is only as reliable as that year’s monsoon for most farmers.
There have been reports detailing limitations in regard to infrastructure, finance, and policy that keep farmers from implementing irrigation systems for themselves. The government has taken steps to improve conditions for farmers such as loan waivers, price guarantees, reservoir construction, and seed subsidies, although to controversial levels of success (Mujumdar and Kapila Citation2006, Gruére and Sengupta Citation2011). However, it is rare to find studies that evaluate the social or behavioural factors that may relate to irrigation usage despite the importance these factors play in water management (Namara et al. Citation2007, Lawal Citation2017, Pande et al. Citation2020). The importance of behaviour from a socio-hydrological perspective has been demonstrated with agent-based modelling but little is even known about the behaviour of farmers in the area (Wens et al. Citation2019, Pouladi et al. Citation2020, Tamburino et al. Citation2020).
Psychological frameworks have been used more to analyse farmer adoption of sustainable practices of water-related behaviour and adoption of water technologies in low-middle income countries (Nauges and Berg Citation2009, Gamma et al. Citation2017, Daniel et al. Citation2019, Dessart et al. Citation2019). One of the psychological frameworks is the Risk, Attitude, Norms, Abilities, and Self-regulation (RANAS) model (H.-J. Mosler Citation2012). It can be used to model the hypothetical causal relationship between socio-economic characteristics (SECs), psychological factors, and behaviour. RANAS makes the case that there are direct behavioural factors, or psychosocial factors, and indirect factors, or SECs, that influence the behaviour of an individual (Daniel et al. Citation2020).
This paper presents a novel approach, integrating a psychological framework to understand farmers’ behaviour related to irrigation technology in the state of Maharashtra, India. SECs and behavioural factors and their relationships with one another are analysed through the lens of the RANAS model. Even though RANAS was introduced initially in the water, sanitation, and hygiene (WASH) domain, it is now used in many fields outside WASH, e.g. water conservation practices (Bluemling et al. Citation2010), groundwater conservation (Klessens et al. Citation2022), and Ebola prevention behaviours (Gamma et al. Citation2017). Reviews by Biesheuvel et al. (Citation2021) and Sok et al. (Citation2021) indicate that previous studies on farmers’ behaviour or agricultural practices are mainly based on the theory of planned behaviour (TPB). Other examples of psychological theories that are being used in the agricultural domain are the reasoned action approach (Vaz et al. Citation2020), the value–belief–norm model (Zhang et al. Citation2021), and the integration of TPB–norm activation theory–network contact frequency (Coulibaly et al. Citation2021). This paper introduces the application of the RANAS model in the context of agricultural or farmers’ water use behaviour.
Bayesian belief network (BBN) is used to model the behaviour based on hypothesized causal links between socio-economic conditions, psychological factors, and behaviour. The results can be used by relevant stakeholders to improve irrigation practices (e.g. by implementing interventions that nudge farmers to adopt drip irrigation), which will then improve farmers’ well-being and reduce the cases of suicide and mental health problems in the study area.
2 Methodology
2.1 Data collection
The data collection was conducted from July to August of 2019 in the regions of Vidarbha and Marathwada in the state of Maharashtra, India (). This study is part of a research collaboration between Solidaridad Network Asia Limited (SNAL), Rijksdienst voor Ondernemend Nederland (RVO), and Delft University of Technology to improve the welfare of cotton farmers in the two regions. Four districts in these two regions were selected: Nagpur and Wardha districts in Vidarbha and Amaravati and Yavatmal districts in Marathwada. The four areas were identified as the areas where farmers’ income often falls below the poverty lines, and where challenging environmental conditions exist, e.g. low precipitation, so that effective agriculture water interventions inspired by the lessons learned can be designed. A total of 345 households were randomly interviewed. The surveys were conducted in a semi-structured fashion inside farmers’ homes or inside communal buildings within the villages. Field coordinators asked the questions to the farmers in Marathi, the state language. Questionnaires were translated into Marathi and then retranslated back to English to review and verify the meaning. All questions were reviewed in a trial with field coordinators to ensure their successful implementation in the field.
Figure 1. Map of study area.
Within villages, field coordinators utilized their contacts to organize local farmers for the visits. Farmers were interviewed on a voluntary basis and screened on the prerequisite that they grew cotton. The survey included questions to be used for the psychological evaluation as well as for the collection of generic and quantitative data. The questionnaire covered: (1) SECs, e.g. education level, age, housing material, etc.; (2) farming practices, e.g. irrigation methods and questions related to crops and cotton; (3) questions related to financial conditions, e.g. loans, income, crop insurance, etc., and (4) questions related to the RANAS psychological theory (). Behavioural questions were scored using a five-item Likert scale. Socio-economic questions were scored on a nominal scale, and farming practices and financial questions were scored using a combination of nominal and numerical scales.
Table 1. Descriptive statistics of psychological factors
2.2 Socio-economic characteristics
We used seven SECs that related to farming behaviour based on previous studies in the agricultural and water domain: (1) age, (2) education, (3) water source, (4) number of dependents (defined as those who live with the respondent and are financially dependent on them), (5) number of family members who help with farming, (6) wealth level, and (7) promotion activities (Kebede et al. Citation1990, Marenya and Barrett Citation2007, Nauges and Berg Citation2009, Opryszko et al. Citation2010, H. J. Mosler et al. Citation2013, Gamma et al. Citation2017, Daniel et al. Citation2019). As with the methodology, the selection of SECs is based on previous water-related behaviour studies. For example, we used a variable related to promotional activities because it was found to be associated with household water treatment behaviour (Daniel et al. Citation2019).
Wealth level and promotion were collected at a sub-factor level, so principal component analysis (PCA) was performed to create a single factor (i.e. the principal component) to represent the characteristic. A wealth index was created using a PCA of area owned, total annual income, and number of livestock owned. The impact of obtaining income information strengthened the wealth index, and area was also a good fit as it is often tied directly to wealth with the ability to grow more crops. Data were collected on roof and home construction material, but the uncertainty around assets as a good metric for a wealth index combined with the low variability in responses from the farmers led to these measurements being excluded from the PCA (Vyas and Kumaranayake Citation2006). IBM SPSS software was used for the PCA. The SEC variables were measured on a categorical scale, e.g. “none or primary,” “secondary,” and “graduate or above” in SEC variable education.
A promotional index was created using PCA from questions regarding frequency of promotional influence, helpfulness of promotional material, and source of promotional material. The PCA result was discretized into a promotional index factor by dividing the range into three equidistant categories (low, medium, high). Each of the characteristics were classified also into three groups, with the exception being water source since there were more than three categories recorded and it could not be simplified. Number of family members who help and number of dependents were categorized as low (N < 2), medium (1 < N < 4) and high (N > 3); education was divided into none or primary, secondary, or graduate or above; age was divided into less than 35, between 35 and 50, and greater than 50 years of age.
2.3 RANAS psychological factors
RANAS consists of five psychological factors: risk, attitude, norms, abilities, and self-regulation. The method incorporates the relationships between SECs with these factors to evaluate behavioural patterns. The various factors can be understood as the following:
Risk factors indicate the interviewee’s perception of risk of water scarcity as it pertains to crop failure;
Attitude factors indicate the interviewee’s perception of the situation regarding their beliefs about the costs and benefits of the behaviour in consideration (irrigation usage);
Norm factors indicate the perceived normality of the behaviour;
Ability factors represent the interviewee’s perception of their own ability to execute the considered behaviour;
Self-regulation factors indicate the interviewee’s perceived ability to continue a behaviour and maintain it.
RANAS requires data to be collected at the sub-factor level, so PCA was again used to simplify the BBN structure and create a single factor to correspond with each of the five RANAS factors. The scale used in the questionnaire followed the RANAS guidelines, i.e. using a five-point Likert scale (H. Mosler and Contzen Citation2016). For example, with the question on perceived vulnerability, the answer scale ranged from “completely confident” (score = 1) to “not confident at all” (5).
The method of Daniel et al. (Citation2019) was followed to analyse the RANAS data through the use of PCA and a BBN. The first component resulting from the PCA was used to represent each psychological factor. The components were then divided into three classes: low, moderate, and high. This division was done by splitting the range into equal thirds. These classified factors were then used in the BBN analysis. The sub-factors and associated questions used for the PCA and the resulting RANAS component can be found in . The psychological factor, self-regulation, did not use PCA as only one question was used for its representation. A classification of self-regulation was used that separated scores greater than 3 as high, lower than 3 as low, and equal to 3 as moderate.
2.4 Outcome variable: adoption of irrigation
Two outcome variables were used to represent adoption behaviour. These variables were derived from the question “What kind of irrigation technology do you use?” If the answer was “Drip” or “Sprinkler,” the farmer was said to use micro-irrigation. If the answer was “Furrow” or “Flood,” the farmer was said to use irrigation but not micro-irrigation. Lastly, if the farmer answered “None, no irrigation,” then the farmer was said to use neither irrigation nor micro-irrigation.
2.5 BBN model
BBN consists of directed acyclic graphs (DAGs) that represent the dependencies within the network based upon conditional probability tables (CPTs), which indicate the strength of the influence between “parent” and “child” nodes (Cain Citation2001). Previous studies found that SECs influence water-related behaviour via psychological factors, meaning that SECs and psychological factors should not be placed at the “same level” (Daniel et al. Citation2020). This indicates the need for a hierarchical three-level structure of SECs, psychological factors, and water-related behaviour. BBN can perform this task and also has some advantages compared to other methods, e.g. it is able to illustrate and simulate scenario analyses to understand the hypothetical causal relationship between variables (Cain Citation2001).
When constructing the BBN, three aspects were considered: model complexity, statistical relationships between SECs and RANAS factors, and model performance (Marcot et al. Citation2006, Kjærulff and Madsen Citation2008, Kuhnert and Hayes Citation2009). One-to-one (nonparametric chi-squared) tests were performed between each household’s SECs and all psychological principal factors to assess potential causal links. To limit model complexity, only the most statistically significant relationships were kept when linking nodes. However, statistically significant relationships may not be equivalent to causal links. To test this, the impact of each uncertain linkage on the model’s performance was evaluated. If a particular link showed no demonstrable change in model performance when the state of the socio-economic node was altered, then the link was removed from the final model. It should also be clearly stated that only indirect links between SECs and behaviour tests (irrigation usage) were used to more accurately and simply represent the model. The BBN structure was created based on statistical relationships between each SEC and RANAS variable. For example, we found a statistically significant relationship between variable “education” and “risk” and, thus, we linked them in the BBN structure.
GeNIe Modeller 2.4 (www.bayesfusion.com) was used to build the model as it provides a simple and intuitive graphic user interface (GUI) with sufficient algorithmic performance (Druzdzel and Sowinski Citation1995). The software uses the EM (expectation maximization) algorithm to estimate and populate the CPTs in the BBN (Druzdzel and Sowinski Citation1995). The leave one out (LOO) validation method, which is an extreme case of K-fold cross-validation, was used to test the robustness of the estimated model; i.e. the network is trained on n − 1 records and tested on the remaining record. This process is repeated n times and is seen as the most advisable validation method due to its robustness and efficiency in evaluation (Druzdzel and Sowinski Citation1995, Kocaguneli and Menzies Citation2013).
A parameter sensitivity analysis was performed using Genie’s built-in algorithms to evaluate the impact that small changes on each node would have on behaviour. The BBN was also tested with a scenario analysis using the BBN’s predictive capabilities (Bayesian inference). The influence of each node was tested by altering the state of each node to 100% for the various states and observing the change in behaviour (e.g. the probability of the age node can be updated to 100% “Older than 50” and then the change in irrigation or micro-irrigation adoption rate can be checked to see the role that age plays in this behaviour, at least indirectly). This analysis gives an assessment of each node’s influence on behaviour.
3 Results
3.1 Descriptive survey results
The survey showed that two-thirds of the respondents used irrigation in some way and that about 44% used micro-irrigation. Open wells were the dominant water source among farmers in the area, with 59% relying upon them and about a quarter of all users having no access to irrigation. Seventy percent of respondents had a secondary level of education (completing up to 10th or 12th grade) and 73% of respondents had 2–4 dependents. The mean age of interviewees was 46 years old (standard deviation (STD) = 12.9 years) with a maximum age of 94 and a minimum age of 19. The most common water source for respondents was an open well, although these wells are certainly not always holding usable amounts of water. Nearly 30% of farmers had no water source besides whatever rain fell on their land, which was the second-most popular response regarding water source. The mean income from crops earned by respondents was 220,900 Rupees per year with a mean area of land owned of 2.9 ha – the mean area used to grow cotton was 4.7 acres or 1.9 ha.
3.2 BBN structure and model
3.2.1 Layout of the model
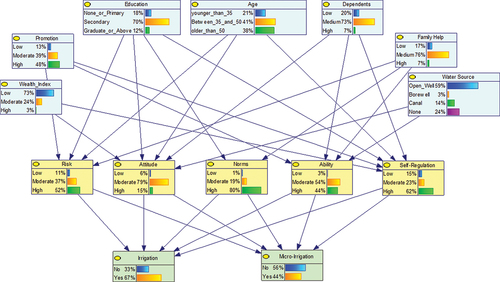
shows the layout of the BBN after creating linkages according to the chi-squared tests. The number of dependents is shown to have a potential causal link, but when evaluated for any changes in behaviour, it proves to be irrelevant. Therefore, for all statistical analyses such as the sensitivity analyses, it is excluded.
Figure 2. The Bayesian belief network model showing relationships among all nodes. The bars in each node show the probability that a node is in a certain state, i.e. existing condition.
3.2.2 Model validation
The accuracy of the irrigation model was 69% and the accuracy of the micro-irrigation model was 55%. The success in predicting “No” for micro-irrigation and irrigation, in general, was 78% and 20%, respectively. It had success rates of 39% and 84%, respectively, when predicting a “Yes” for micro-irrigation and irrigation.
3.2.3 Sensitivity analysis
shows the maximum values of the derivatives of the posterior probability distributions of each output node, taken in relation to a change by 1% of a single entry of the respective node. For example, there was one entry in the CPT of promotion such that when it changed by 1%, the probability of micro-irrigation increased by 3.3% (derivate of posterior probability). All other entries for promotion changed the probability of the output node, micro-irrigation, by less than that.
Table 2. Sensitivity analysis of individual nodes on both output nodes
It is shown that among SECs, age and promotion had the smallest impact on irrigation usage, whereas water source and wealth index had the largest impact. Among psychological factors, norms had the greatest impact, while risk and self-regulation had the smallest.
When it comes to micro-irrigation usage, promotion had the strongest impact, but it should be noted that this is relatively similar to the impact that wealth and water source had on irrigation. The other socio-economic factors had a lesser impact, with age again being the smallest. Among psychological factors, norms had the largest impact on micro-irrigation and self-regulation had the smallest.
3.2.4 Effect of updating a single node on output node (Bayesian inferences)
The effect on the output node of altering the state of a single node is shown in . For instance, when the state of age is changed to 100% = “Young” (age < 35), the probability of using irrigation increases to 68%, up 2% from the default survey state of 66%. None of the socio-economic factors increased the probability of irrigation usage by more than four points, and only the type of water source had any type of negative impact on probability, with two options, canal and no water source, decreasing the probability of irrigation only to 65%. Overall, education had the greatest impact among socio-economic nodes. Among psychological factors, attitude had the greatest impact by far on irrigation usage probability. That node had both the largest decrease and the largest increase in probability, with a range of 41%.
Table 3. Predictive inference that measures the effect of each state in each node on both outcome nodes
In general, the impact of updating a single node on the probability of micro-irrigation was less than that for irrigation. None of the socio-economic nodes had much impact on the output node, with the greatest range in probability change at 3%, tied among three nodes. Among psychological nodes, attitude again has the largest impact with a range of 21%, followed by risk, with a range of 16%. For both irrigation and micro-irrigation probabilities, the abilities node is found to have the least impact among psychological factors.
3.2.5 Optimal scenario analysis to increase the probability of irrigation practices
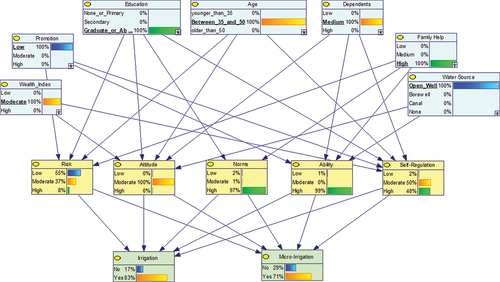
Irrigation and micro-irrigation usage can be indirectly influenced by different SECs, so various combinations of these parameters were investigated to find the combination that yields the highest probability of irrigation and/or micro-irrigation. The optimal case that described the target group most likely to irrigate was also the same combination of characteristics that optimized micro-irrigation probability (). The combination of characteristics that led to the optimal scenario was highly educated, middle-aged, and moderately wealthy with a high amount of family help and an open well as their main water source, while receiving low promotional information and activities related to water scarcity and irrigation adoption. Setting the nodes of each of these factors to 100%, the state listed resulted in a probability of irrigation and micro-irrigation of 83% and 71%, respectively, an increase of 16% and 27% compared to the baseline condition ().
Figure 3. Best scenario in socio-economic factors on the outcome nodes.
Alteration of psychological factors was also investigated. When all factors were set to 100%, it was found that the proportion who irrigate and who use micro-irrigation is equally 100%, validating the model in an alternative way. The factors risk and attitude were adjusted as well, as they have the best-fitting questions and are hypothesized to have the greatest impact. When all psychological factors are set at 100% high (except for risk, which was set to 100% low), the percentage of those who irrigate drops to 70% and the percentage of those who use micro-irrigation drops to 59%. When the same test is applied to attitude, the result is even more dramatic. When attitude it set to 100% low, the proportion of people who do not use irrigation or micro-irrigation drops to 0%.
4 Discussion
The model performance was adequate but not strong (62%). The model performance was best when trying to find a “No” for micro-irrigation (78%) and a “Yes” for irrigation (84%). Our model performance is lower than that of previous studies that use the same approach but a different topic, i.e. 84% for Daniel et al. (Citation2019) and 79% for Daniel et al. (Citation2020). This could be because there are other SECs that are better suited to explain the variation of psychological factors. Another possible reason for the model’s performance is the fact that these two categories each had the majority of respondents – two-thirds of survey respondents used irrigation and 56% had micro-irrigation. Having more respondents for a category like this can make the model more familiar with the dominant behaviour and reduce the model’s accuracy (Daniel et al. Citation2019).
It was expected that norms would be the node most sensitive to impact irrigation and micro-irrigation usage. Other studies have also found that social norms are one of the critical psychological factors that influence farmers’ behaviour (Maertens Citation2017, Qiu et al. Citation2021, Zhang et al. Citation2021). A response by an interviewee regarding strong norms may not only indicate that many farmers around them use irrigation but may also be a consequence of that village being located in a region with better access to water – a geographical determinant. The social aspect of norms can also be highly encouraging for a farmer concerned with taking up the decision to invest in micro-irrigation technology while unsure of its payoff, and this rationale is commonly found through other social surveys (Jones et al. Citation2008, H.-J. Mosler Citation2012, Castilla-Rho et al. Citation2017). Wealth and water source similarly were sensitive SECs for irrigation. Regarding micro-irrigation, promotion was the most sensitive SEC, which also fits expectations.
When adjusting for both micro-irrigation and irrigation usage outcomes, it was found that updating the values of the single nodes of risk and attitude had the greatest impact. In particular, with respect to irrigation, attitude has a very strong effect, as also indicated in another study of farmers’ behaviour in Brazil which found that attitude is an important psychological factor (Vaz et al. Citation2020), suggesting that if farmers favour one irrigation technology or practice over the others, they are more likely to use or adopt it.
None of the SECs had a larger influence on either irrigation or micro-irrigation than the psychological factors did. There are some possible reasons for this. First, Lilje and Mosler (Citation2017) argue that psychological factors are more powerful in explaining behaviour than SEC. Second, considering the BBN model layer, one can expect that the influence of the nodes in the outer layer, i.e. SEC, is smaller than that of the nodes in the intermediate layer, i.e. psychological factors, because the psychological factors directly influence the output node, i.e. irrigation and micro-irrigation (Daniel et al. Citation2020a). Finally, it is also possible that the selected SECs cannot fully explain the psychological factors, as mentioned previously, which then affects SECs’ ability to explain the behaviour via the psychological factors. However, in this paper, we highlight that no single SEC node has a dominant impact on the irrigation and micro-irrigation practices; rather, it is a combination of SECs that matters most.
4.1 Implications
This study introduces the application of the RANAS model to explain farmers’ behaviour, and thus should inspire future applications of RANAS in the agricultural water domain. Previous studies in the agricultural domain often only use psychological factors (e.g. Vaz et al. Citation2020, Biesheuvel et al. Citation2021, Coulibaly et al. Citation2021, Sok et al. Citation2021, Zhang et al. Citation2021). Despite the low influence of SECs in explaining the behaviour in our study, we still encourage future studies to include SECs or combine them with psychological factors as behavioural determinants. This is especially critical if we consider that SECs are the root cause of human behaviour (Braveman and Gottlieb Citation2002). Furthermore, future studies can consider applying the concept of system thinking in explaining farmers’ behaviour, as used in this study (Schiere et al. Citation2004, Fairweather Citation2010).
The output of the BBN model optimal case implies the expected influence of education (highly educated), water source (open well), and family help (high). It is expected that those who are well-educated are more capable and more willing to engage in better water management practices, and it is also expected that those with an open well (touted as the most reliable water source by farmers except for rainfall) would be most likely to use irrigation. Increasing the number of family members helping assists the farmer by supplying extra cheap labour. This increases their capacity and decreases their expenses, making it more likely that they can take up the extra initial costs of irrigation systems. We found that moderate wealth and low promotion increase the likelihood of irrigation and micro-irrigation, as opposed to high wealth and promotion. It is expected and commonly found that high levels of wealth are most likely to be associated with new adoption of technologies or improved practices (Kebede et al. Citation1990, Awotide et al. Citation2006, Marenya and Barrett Citation2007). However, our results may imply that high-income farmers were satisfied with their current irrigation methods and agricultural product and thus more reluctant to change their irrigation methods. On the other hand, middle-income farmers want to improve their agricultural product by adopting new irrigation technologies, and they can cover the related expenses.
Moreover, high promotion may create a saturation level in the community about the irrigation message such that they are more resistant to adopt the new irrigation methods. However, types of promotional activities, communication channels, and agents of promotion, i.e. who conducts the promotional activities, may influence people’s behaviour (H. Mosler and Contzen Citation2016). From the sub-factor for willingness-to-pay (mean = 3.01/5), it can also be seen that the farmers are not willing to spend a lot, although they are willing to pay some. Low promotion is surprising because it would have been expected that more information from reputable sources should increase the farmers’ willingness and ability to adopt irrigation. It is conversely proposed that perhaps the spread of information regarding water scarcity and conservation practices has endorsed a fatalist perspective that discourages farmers from putting in more work to try and control and improve their circumstances (Hoekstra Citation2000). The increase of exposure to media that refers to their home region as the “Suicide Capital of India” may also induce increased hopelessness (Mitra and Shroff Citation2007, Press Trust of India Citation2019, Kakodkar Citation2020). Many farmers, mid-interview, would bring up their inevitable lack of resiliency likely leading to their own suicide and would heavily discourage their children from becoming farmers themselves. This is also seen in the average age of farmers (i.e. 46) being relatively high.
Investigation of the direct alteration of psychological factors and their impact on behaviours can add further information. As a first test, when all factors are set to 100% high, this results in 100% adoption of irrigation and micro-irrigation, as intended, which gives confidence to the expected results. Keeping all factors at 100% high and shifting risk to 100% low reduces the adoption rates, which indicates that perception of risk has a significant impact. However, the rate is not as significant as those shown by self-regulation and attitude. When self-regulation is set to 100% low, irrigation retains its 100% probability, but use of micro-irrigation decreases to 1%. This implies that adoption of irrigation is not very sensitive to those who self-regulate well, but those who perhaps take extra steps by using micro-irrigation systems also are those who self-regulate well. Lastly, the adjustment of the attitude factor to 100% low brings the probability of adoption of both irrigation and micro-irrigation to 0%. The attitude factor represents the farmers’ attitude relating to irrigation, so this is verifying that those who see irrigation in the worst light are the least likely to use it. Simulations using psychological factors help us to understand the “causal” mechanism behind how people adopt irrigation technologies.
Project officers can target critical psychological factors, such as attitude in our case, in their promotional activities. Strategies to target critical psychological factors can be found in the RANAS guidelines, e.g. explaining the benefits of adopting irrigation technology or letting farmers to try a technology so that they can develop a positive feeling towards it (Mosler and Contzen Citation2016). It is important to note that psychological factors that determine human behaviour are context specific (Daniel Citation2021). For example, attitude is the most important psychological factor in our study, but it may have different strengths of influence in different contexts or locations. Therefore, it is important to understand critical SECs and psychological factors so that appropriate interventions can be implemented (H. Mosler and Contzen Citation2016).
Interpretation of the sensitivity analysis and of the optimal cases can help create a picture of who is most likely to adopt irrigation and what the motivating psychological factors behind it are. In the sensitivity analysis updating a single node, it was found that promotion has the largest sensitivity for overall behaviour. The lowest sensitivities are regarding age, dependents, and education. This implies that across the spectrum of these parameters, there is no strong correlation between adoption and any of them. What the optimal case of SECs showed is that low promotion and moderate wealth combined with open-well users produced the most likely outcome. What this means is that proposed interventions should not be too expensive and that promotional messages should be more selective and positively focused. Perhaps farmers do not need constant reminders of the peril they face, and fewer, more constructive promotional exchanges could be more positive. While abilities and norms did not have a large impact in the single-node updating analysis, in the optimal case they were shown to have a 99% and 97% probability, respectively, of being high, meaning they are a likely prerequisite for successful adoption. While norms had a very high probability of being high for current conditions, abilities had a higher probability for people in the moderate category. Improving abilities through positive promotional material could improve both the psychological factor and also the indirect socio-economic factor that contributes to better adoption.
This study has some limitations that restrict the study’s interpretation. First, the study was conducted only in four out of 36 districts in the state of Maharashtra, which limits the generalizability of this study to the whole country or even the state. One should therefore view this study as a case study that is representative of typical hotspots in the regions of Vidharba and Marathwada and a starting point that can trigger a more comprehensive study in the regions. Second, there are other SECs beyond the seven that we used here, such as accessibility, that may relate to farming behaviour. Future studies should incorporate such additional characteristics into their analysis.
5 Conclusion
The adoption of types of irrigation technologies considering farmers’ socio-economic and psychological factors in India has not been analysed before. In this paper, the RANAS method was used to understand the causal linkages between SECs, behavioural factors, and behaviour – irrigation and micro-irrigation – through the use of BBN, which allowed a more intuitive interpretation of the statistical relations. One of the most important findings of this analysis was the complexity of the relationships between these variables and that simply targeting or studying one variable will inevitably lead to a lack of understanding and perhaps a misinterpretation of the situation. When it comes to development interventions, these psychological factors are often overlooked, but can be the main drivers of change.
It was found that moderate wealth leads to greater adoption, perhaps due to the need to have some capital but a preference for not overly expensive options – something that may push farmers deeper into debt. The type and quantity of promotional material also play a strong role. In an area where the situation may be so publicly desolate, the quality and tone of the messages need to be considered carefully to encourage behaviour. Further studies should build on these concepts to better understand the complex behavioural dynamics that will help a region’s development accelerate and not stall or backfire.
Acknowledgements
The authors are grateful for the support of Solidaridad Network Asia Limited (SNAL) and Rijksdienst voor Ondernemend Nederland (RVO). The invaluable support of our SNAL colleagues, i.e. Ashray Tyagi, Anukool Nagi and Prashant Pastore, is gratefully acknowledged. The authors declare no conflict of interest between the donors and research activities detailed in this manuscript.
Disclosure statement
No potential conflict of interest was reported by the authors.
References
- Awotide, B.A., et al., 2006. Wealth status and agricultural technology adoption among smallholder rice farmers in Nigeria. ResearchGate, 11, (2005 October) 163–168.
- Behere, P. and Behere, A., 2008. Farmers’ suicide in Vidarbha region of Maharashtra state: a myth or reality? Indian Journal of Psychiatry, 50 (2), 124–127. doi:https://doi.org/10.4103/0019-5545.42401
- Bhuiyan, C., Flügel, W.A., and Singh, R.P., 2009. Erratic monsoon, growing water demand, and declining water table. Journal of Spatial Hydrology, 9 (1), 1–19.
- Biesheuvel, M.M., et al., 2021. Understanding farmers’ behavior and their decision-making process in the context of cattle diseases: a review of theories and approaches. Frontiers in Veterinary Science, 8. doi:https://doi.org/10.3389/fvets.2021.687699
- Bluemling, B., Yang, H., and Mosler, H.-J., 2010. Adoption of agricultural water conservation practices - A question of individual or collective behaviour? The case of the North China plain. Outlook on Agriculture, 39 (1), 7–16. doi:https://doi.org/10.5367/000000010791170022
- Braveman, P. and Gottlieb, L., 2002. The social determinants of health : it ’ s time to consider the causes of the causes. Public Health Reports, 129, 19–31. doi:https://doi.org/10.1377/hlthaff.21.2.60
- Cain, J., 2001. Planning improvements in natural resources management. Vol. 44, oxfordshire: UK Centre for Ecology & Hydrology.
- Castilla-Rho, J.C., et al., 2017. Social tipping points in global groundwater management. In: Nature Human Behaviour. Springer US, 640–649. doi:https://doi.org/10.1038/s41562-017-0181-7
- CCI. (2012) A brief report on textile industry in India. Corp. Catal. India Pvt Ltd. New Delhi. Retrieved from https://web.archive.org/web/20120522071945/http://cci.in/pdf/surveys_reports/indian-textile-industry.pdf
- Cole, S.A., et al. (2013) Marketing weather-indexed agricultural insurance to smallholder farmers in rural Gujarat, India. Retrieved from http://www.theigc.org/wp-content/uploads/2014/09/Cole-Et-Al-2013-Policy-Brief.pdf
- Coulibaly, T.P., et al., 2021. A proposed conceptual framework on the adoption of sustainable agricultural practices: the role of network contact frequency and institutional trust. Sustain, 13 (4), 1–12. doi:https://doi.org/10.3390/su13042206
- Daniel, D., et al., 2019. Understanding the effect of socio-economic characteristics and psychosocial factors on household water treatment practices in rural Nepal using Bayesian Belief Networks. International Journal of Hygiene and Environmental Health, 222 (5), 847–855. Elsevier GmbH: https://doi.org/10.1016/j.ijheh.2019.04.005.
- Daniel, D., et al., 2020a. A Bayesian Belief Network model to link sanitary inspection data to drinking water quality in a medium resource setting in rural Indonesia. In: Scientific Reports. London: Nature Publishing Group UK, 1–13. doi:https://doi.org/10.1038/s41598-020-75827-7
- Daniel, D. (2021) Factors influencing the household water treatment adoption in rural areas in developing countries. Delft University of Technology. Retrieved from https://repository.tudelft.nl/islandora/object/uuid:6f6e7a1b-65ac-4876-9531-24988a563e36?collection=research
- Daniel, D., Pande, S., and Rietveld, L., 2020b. The effect of socio-economic characteristics on the use of household water treatment via psychosocial factors: a mediation analysis. Hydrological Sciences Journal, 65 (14), 2350–2358. doi:https://doi.org/10.1080/02626667.2020.1807553
- Daniel, D., Sirait, M., and Pande, S., 2020c. A hierarchical Bayesian Belief Network model of household water treatment behaviour in a suburban area: a case study of Palu - Indonesia. PLoS One, 15(11. doi:https://doi.org/10.1371/journal.pone.0241904
- Dessart, F.J., Barreiro-Hurlé, J., and Bavel, R.V., 2019. Behavioural factors affecting the adoption of sustainable farming practices: a policy-oriented review. European Review of Agricultural Economics, 46 (3), 417–471. doi:https://doi.org/10.1093/erae/jbz019
- Dongre, A.R. and Deshmukh, P.R., 2012. Farmers’ suicides in the Vidarbha region of Maharashtra, India: a qualitative exploration of their causes. Journal of Injury and Violence Research, 4 (1), 2–7. doi:https://doi.org/10.5249/jivr.v4i1.68
- Druzdzel, M.J. and Sowinski, T. (1995) GeNIe Modeler. Pittsburgh. Retrieved from https://www.bayesfusion.com/
- Fairweather, J., 2010. Farmer models of socio-ecologic systems: application of causal mapping across multiple locations. Ecological Modelling, 221 (3), 555–562. doi:https://doi.org/10.1016/j.ecolmodel.2009.10.026
- Gamma, A.E., et al., 2017. Contextual and psychosocial factors predicting Ebola prevention behaviours using the RANAS approach to behaviour change in Guinea-Bissau. BMC Public Health, 17 (1), 446. doi:https://doi.org/10.1186/s12889-017-4360-2
- Gruére, G. and Sengupta, D., 2011. Bt cotton and farmer suicides in India: an evidence-based assessment. The Journal of Development Studies, 47 (2), 316–337. doi:https://doi.org/10.1080/00220388.2010.492863
- Hoekstra, A.Y., 2000. Appreciation of water: four perspectives. Water Policy, 1 (6), 605–622. doi:https://doi.org/10.1016/S1366-7017(99)00013-6
- Jones, J.P.G., Andriamarovololona, M.M., and Hockley, N., 2008. The importance of taboos and social norms to conservation in Madagascar. Conservation Biology, 22 (4), 976–986. doi:https://doi.org/10.1111/j.1523-1739.2008.00970.x
- Kakodkar, P. (2020) Farmer suicides in Maharashtra rise first time in 4 years. Retrieved 10 March 2020, from https://timesofindia.indiatimes.com/city/mumbai/farmer-suicides-in-maharashtra-rise-first-time-in-4-years/articleshow/73601434.cms
- Kebede, Y., Gunjal, K., and Coffin, G., 1990. Adoption of new technologies in Ethiopian agriculture: the case of Tegulet‐Bulga District, Shoa Province. Agricultural Economics, 4 (1), 27–43. doi:https://doi.org/10.1111/j.1574-0862.1990.tb00103.x
- Kjærulff, U.B. and Madsen, A.L., 2008. Bayesian networks and influence diagrams: a guide to construction and analysis. Cham, Switzerland: Springer-Verlag. doi:https://doi.org/10.1007/978-0-387-74101-7
- Klessens, T.M.A., et al., 2022. Public willingness to conserve groundwater in Vietnamese Mekong Delta: combining water resources, socio-environmental, and psychological factors. Journal of Water Resources Planning and Management, 148(3. doi:https://doi.org/10.1061/(ASCE)WR.1943-5452.0001516
- Kocaguneli, E. and Menzies, T., 2013. Software effort models should be assessed via leave-one-out validation. Journal of Systems and Software, 86 (7), 1879–1890. doi:https://doi.org/10.1016/j.jss.2013.02.053
- Kuhnert, P.M. and Hayes, K.R., 2009. How believable is your BBN? 18th World IMACS Congress MODSIM 2009 - International Congress Modeling Simulation Interfacing Modeling Simulation with Mathematics Computing Science Proceedings, 4319–4325.
- Landry, T. and Sood, D. (2012) India: cotton and products annual GAINS report.
- Lawal, I.S., 2017. Influence of socio-economic characteristics of irrigation farmers to access and utilization of agricultural knowledge and information. Library Philosophy and Practice, 2017, 1–17.
- Lilje, J. and Mosler, H.-J., 2017. Socio-psychological determinants for safe drinking water consumption behaviors: a multi-country review. Journal of Water, Sanitation and Hygiene for Development, 7 (1), 13–24. doi:https://doi.org/10.2166/washdev.2017.080
- Maertens, A., 2017. Who cares what others think (or do)? Social learning and social pressures in cotton farming in India. American Journal of Agricultural Economics, 99 (4), 988–1007. doi:https://doi.org/10.1093/ajae/aaw098
- Marcot, B.G., et al., 2006. Guidelines for developing and updating Bayesian belief networks applied to ecological modeling and conservation. Canadian Journal of Forest Research, 36 (12), 3063–3074. doi:https://doi.org/10.1139/x06-135
- Marenya, P.P. and Barrett, C.B., 2007. Household-level determinants of adoption of improved natural resources management practices among smallholder farmers in western Kenya. Food Policy, 32 (4), 515–536. doi:https://doi.org/10.1016/j.foodpol.2006.10.002
- Mirowsky, J. and Ross, C.E., 1990. Control or defense? Depression and the sense of control over good and bad outcomes. Journal of Health and Social Behavior, 31 (1), 71–86. doi:https://doi.org/10.2307/2137046
- Mitra, S. and Shroff, S., 2007. Farmers suicides in Maharashtra. JSTOR, 42 (49), 73–77.
- Mosler, H.-J., 2012. A systematic approach to behavior change interventions for the water and sanitation sector in developing countries: a conceptual model, a review, and a guideline. International Journal of Environmental Health Research, 22 (5), 431–449. doi:https://doi.org/10.1080/09603123.2011.650156
- Mosler, H. and Contzen, N., 2016. Systematic behavior change in water sanitation and hygiene A practical guide using the RANAS approach, Version 1.1. Dübendorf, Switzerland: EAWAG.
- Mosler, H.J., Kraemer, S.M., and Johnston, R.B., 2013. Achieving long-term use of solar water disinfection in Zimbabwe. Public Health, 127 (1), 92–98, Elsevier Ltd, https://doi.org/10.1016/j.puhe.2012.09.001
- Mujumdar, N.A. and Kapila, U. (2006) Indian agriculture in the New Millennium: changing perceptions and development policy, volume 2. Academic Foundation. Retrieved from https://books.google.com/books?hl=en&lr=&id=cVb0k-asSaEC&pgis=1
- Namara, R.E., Nagar, R.K., and Upadhyay, B., 2007. Economics, adoption determinants, and impacts of micro-irrigation technologies: empirical results from India. Irrigation Science, 25 (3), 283–297. doi:https://doi.org/10.1007/s00271-007-0065-0
- Nauges, C. and Berg, C.V.D., 2009. Perception of health risk and averting behavior: an analysis of household water consumption in Southwest Sri Lanka. Toulouse School of Economics Working Paper, 09–139, 1–33.
- Opryszko, M.C., et al., 2010. Water and hygiene interventions to reduce diarrhoea in rural Afghanistan: a randomized controlled study. Journal of Water and Health, 8 (4), 687–702. doi:https://doi.org/10.2166/wh.2010.121
- Pande, S., et al., 2020. A socio-hydrological perspective on the economics of water resources development and management. Oxford Research Encyclopedia Environmental Science. doi:https://doi.org/10.1093/acrefore/9780199389414.013.657
- Pouladi, P., et al., 2020. Socio-hydrological framework for investigating farmers’ activities affecting the shrinkage of Urmia Lake; hybrid data mining and agent-based modelling. Hydrological Sciences Journal, 65 (8), 1249–1261. doi:https://doi.org/10.1080/02626667.2020.1749763
- Press Trust of India. (2019) Over 12,000 Maharashtra farmers committed suicide in 3 years: government. India Today. Retrieved 10 March 2020, from https://www.indiatoday.in/india/story/maharashtra-farmer-suicide-1553467-2019-06-21
- Qiu, W., Zhong, Z., and Huang, Y., 2021. Impact of perceived social norms on farmers’ behavior of cultivated land protection: an empirical analysis based on mediating effect model. International Journal of Low-Carbon Technologies, 16 (1), 114–124. doi:https://doi.org/10.1093/ijlct/ctaa043
- Rajak, D., et al., 2006. Comparative effects of drip and furrow irrigation on the yield and water productivity of cotton (Gossypium hirsutum L.) in a saline and waterlogged vertisol. Agricultural Water Management, 83 (1–2), 30–36. doi:https://doi.org/10.1016/j.agwat.2005.11.005
- Ramesh, K., et al., 2006. Impact of irrigation regimes. Irrigation Frequencies and Coirpith Mulching on the Economic Productivity of Drip Irrigated Summer Cotton SVPR-2, 2 (6), 447–451.
- Schiere, J., et al. (2004) System thinking in agriculture: an overview. In: Emerging Challenges for farming systems - lessons from Australian and Dutch agriculture, 53–84. Retrieved from www.laventana.nl
- Sok, J., et al., 2021. Farmer behaviour as reasoned action: a critical review of research with the theory of planned behaviour. Journal of Agricultural Economics, 72 (2), 388–412. doi:https://doi.org/10.1111/1477-9552.12408
- Tamburino, L., Baldassarre, G.D., and Vico, G., 2020. Water management for irrigation, crop yield and social attitudes: a socio-agricultural agent-based model to explore a collective action problem. Hydrological Sciences Journal, 65 (11), 1815–1829. doi:https://doi.org/10.1080/02626667.2020.1769103
- Vaz, E.D., Gimenes, R.M.T., and Borges, J.A.R., 2020. Identifying socio-psychological constructs and beliefs underlying farmers’ intention to adopt on-farm silos. NJAS - Wageningen Journal of Life Sciences, 92. doi:https://doi.org/10.1016/j.njas.2020.100322
- Vyas, S. and Kumaranayake, L., 2006. Constructing socio-economic status indices: how to use principal components analysis. Health Policy and Planning, 21 (6), 459–468. doi:https://doi.org/10.1093/heapol/czl029
- Wens, M., et al., 2019. Integrating human behavior dynamics into drought risk assessment—A sociohydrologic, agent‐based approach. WIREs Water, 6(4. doi:https://doi.org/10.1002/wat2.1345
- Zhang, S., et al., 2021. Modelling farmers’ watershed ecological protection behaviour with the value-belief-norm theory: a case study of the wei river basin. International Journal of Environmental Research and Public Health, 18 (9). doi:https://doi.org/10.3390/ijerph1809502