
 ?Mathematical formulae have been encoded as MathML and are displayed in this HTML version using MathJax in order to improve their display. Uncheck the box to turn MathJax off. This feature requires Javascript. Click on a formula to zoom.
ABSTRACT
Societal awareness is a crucial factor driving floodplain dynamics. When modelling these dynamics, flood awareness decay is considered constant. However, empirical studies have shown that the intensity of an experienced event can influence awareness decay. Here we explore and model the influence of variable flood awareness decay on flood losses for two types of societies that cope with flooding by adopting structural (techno society) or nonstructural (green society) protection measures. We modified an established socio-hydrological model and performed three synthetic experiments with multiple scenarios of flood awareness decay, flood intensity, and frequency. We found that, when modelling techno societies, assuming a constant awareness decay leads to underestimating societal flood awareness after severe flood events. In contrast, overestimation of flood awareness occurs when using constant awareness decay for green societies. This might lead to overestimating the effects of human–flood dynamics, such as the levee effect and adaptation effects.
Editor S. Archfield; Associate Editor V. Samadi
1 Introduction
Understanding the co-evolution of human and water systems, through their complex two-way interactions, has been recognized as crucial for improving our knowledge of the long-term dynamics of hydrological risk (e.g. Sivapalan et al. Citation2012, Di Baldassarre et al. Citation2013a, Aerts et al. Citation2018). Over the past decade, the scientific community has investigated different approaches to analyse how human–flood dynamics induce changes in hydrological risk. Socio-hydrological models based on systems dynamics (e.g. Liu et al. Citation2007, Viglione et al. Citation2014, Di Baldassarre et al. Citation2015, Ciullo et al. Citation2017, Barendrecht et al. Citation2019) have been used to identify patterns in human–flood interplays, by representing the human system as lumped. Agent-based models coupled with hydraulic models have been used to explicitly account for the role of individuals in decision making and in perceiving flood risk (e.g. Haer et al. Citation2017, Abebe et al. Citation2019, Alonso Vicario et al. Citation2020, Michaelis et al. Citation2020). Evidence-based studies have highlighted the importance of collecting and analysing empirical data for spotting emerging patterns of socio-hydrological dynamics in river floodplain. This is the case, for example, with the work done by Ferdous et al. (Citation2019a, Citation2019b) and Penning-Rowsell et al. (Citation2013) in Bangladesh or Kreibich et al. (Citation2017) in different locations around the world.
The most commonly observed dynamics emerging from these studies are the so-called levee effect (White Citation1945, Baan and Klijn Citation2004, Di Baldassarre et al. Citation2015) and adaptation effect (Thieken et al. Citation2016, Barendrecht et al. Citation2019, Ferdous et al. Citation2019b). The levee effect describes an archetypal human–flood dynamic that might affect societies relying on structural flood protection measures. The presence of the structure might induce a false sense of safety on the society and trigger urbanization in the floodplain, thus the structural measure might potentially expose societies to increased flood risk. The adaptation effect describes an archetypal human–flood dynamic observed in societies relying on soft, non-structural, and individual flood mitigation measures that might in the long run reduce flood losses, through raising flood risk awareness and preparedness or resettling out of the floodplain.
Factors influencing the dynamics of flood risk are many and varied in nature. Scholars from diverse disciplines have joined efforts to understand their mechanisms and how they affect risk dynamics.
Risk perception has been widely recognized as central factor in shaping floodplain dynamics (Brown and Damery Citation2002, Kellens et al. Citation2011, Lechowska Citation2018). And it has been addressed both from the hydrological and social perspectives (e.g. Slovic Citation1987, Boholm Citation1998, Thieken et al. Citation2007, Bradford et al. Citation2012, Bubeck et al. Citation2012, Scolobig et al. Citation2012, Kellens et al. Citation2013, Wachinger et al. Citation2013, Lechowska Citation2018). Most of these studies analyse the relationship between three fundamental components of risk – perception; awareness; worry and preparedness (Slovic Citation1987, Raaijmakers et al. Citation2008) – and the factors that influence them.
Several studies call for the need to quantify with empirical data the spatio-temporal variability of flood risk awareness to better understand societal responses to flood hazards (Kellens et al. Citation2011, Scolobig et al. Citation2012, Franceschinis et al. Citation2021, Mondino et al. Citation2021). The general assumption that after the occurrence of a flood, and in the absence of consequent flood events, risk awareness decreases (Raaijmakers et al. Citation2008) has recently been supported by empirical data. Mondino et al. (Citation2020a) performed a cohort study in 2005 and 2018 in two villages affected by debris flows in 2000 and 2002 and found that both awareness and preparedness decreased over time. Bubeck et al. (Citation2020) interviewed individuals 9, 18 and 45 months after the 2013 flood in Germany and detected a decrease in risk perception in terms of perceived probability between the second and third wave of interviews. Findings by Bradford et al. (Citation2012) based on 1375 questionnaires distributed among 13 communities prone to flood risk across Europe reinforce the role of direct flood experience in raising the three elements of risk perception. Terpstra et al. (Citation2006) has highlighted the decay over time of the positive effect of direct flood experience on individual mitigation measures.
In socio-hydrological modelling, several studies have analysed the influence of changes in societal awareness on floodplain dynamics (e.g. Di Baldassarre et al. Citation2013b, Viglione et al. Citation2014, Barendrecht et al. Citation2019, Ridolfi et al. Citation2020a, Mazzoleni et al. Citation2021). Barendrecht et al. (Citation2019) used empirical data in a socio-hydrological model to show how a lack of data on risk awareness leads to biased parameter estimation and incorrect modelled water–society dynamics. Mazzoleni et al. (Citation2021) showed that the emergence of different human–water dynamics is driven by the accumulation and decay of both flood and drought awareness. Similarly, Ridolfi et al. (Citation2020a) found that communities characterized by different flood awareness levels experience diverse flood losses.
In most modelling exercises, flood memory is used as a proxy for risk awareness (Di Baldassarre et al. Citation2013b, Viglione et al. Citation2014). Given the fading of memory itself and the availability heuristic (Tversky and Kahneman Citation1973), after the occurrence of a flood and in the absence of consequent flood events, risk awareness is assumed to decrease and flood awareness decay is assumed to be constant over time and space (Ridolfi et al. Citation2020b).
However, as mentioned above, behavioural and empirical studies have shown that the decay of collective memory is affected by severe flood events (Fanta et al. Citation2019), and that changes in risk awareness are influenced by the experience of previous floods (Mondino et al. Citation2020b). Furthermore, studies on the effect of emotional events on memory (Dolcos and Cabeza Citation2002, Rubin Citation2014, García-Gavilanes et al. Citation2017) have shown that people not strongly affected by flood events tend to underestimate their harmful effects (Siegrist and Gutscher Citation2008).
Here we modify a well-established socio-hydrological model (Di Baldassarre et al. Citation2015) to test whether and how variable awareness decay leads to a shift in the human–floodplain dynamics. We consider that societal flood awareness decay is affected by the intensity and frequency of the experienced flood events. We analysed two types of societies: one that responds to flooding by means of structural flood protection measures, i.e. building or reinforcing existing levees; and one that responds with non-structural flood protection measures, i.e. by settling away from the floodplain. These two schematized types of societies will be referred to as the techno and green societies, respectively, as proposed in the literature (Viglione et al. Citation2014, Di Baldassarre et al. Citation2015).
We carried out three experiments to assess the impact of variable flood awareness decay on flood losses and the density of the population living in floodplain:
In the first experiment, we compared the results of the socio-hydrological model when considering constant and variable values of flood awareness decay, for three different time series of annual peaks over threshold of high water depths;
In the second experiment, we analysed the sensitivity of the socio-hydrological model to different values of flood awareness decay, for the same three time series considered in Experiment 1;
In the third experiment, we investigated the influence of flood frequency and intensity on changes in both flood awareness and flood losses, for constant and variable awareness decay.
2 Modelling human–flood dynamics
Socio-hydrological models have been developed over the last decade to represent the complex human–flood systems dynamics and to explain the observed phenomena emerging from those dynamics (Sivapalan and Blöschl Citation2015). The socio-hydrological model used in this study is based on the one proposed by Di Baldassarre et al. (Citation2015), where societies settling and developing in a river flood-prone area respond to flooding by either building or reinforcing an existing levee system (techno society) or settling away from the floodplain (green society). The feedback mechanisms between model variables are shown in the causal loop diagram in .
Figure 1. Causal loop diagram of the socio-hydrological model, where arrows are feedbacks between state variables (bold text) and fluxes, and the symbols + and – represent positive and negative feedback, respectively.
The hydrological input of this model is a time series of annual peaks over threshold of high water depth W expressed as a sequence of impulses with different magnitudes and frequency (Di Baldassarre et al. Citation2015). Flooding occurs when W exceeds the bankfull river depth. The consequent relative flood damage F is estimated using the equation proposed by Di Baldassarre et al. (Citation2015):
where H is the flood protection level, is a parameter related to the relationship between flood water levels and relative damage (Penning-Rowsell et al. Citation2006), and
is the proportion of flood level enhancement due to the levees (Heine and Pinter Citation2012).
If the society decides to build or reinforce a levee system to deal with flooding, the amount of levee heightening after the occurrence of a flood is calculated as:
where is the model parameter representing the safety factor for the levee heightening (Da Deppo et al. Citation2004).
The variation of society’s flood risk awareness A over time is calculated as the accumulation of awareness proportional to the flood losses, Lt, experienced during the flooding (Scolobig et al. Citation2012) and its decay after the occurrence of the event (Baan and Klijn Citation2004):
where is the flood awareness decay of the society, which is usually considered a constant value (Di Baldassarre et al. Citation2015) and calculated using the half-life decay coefficient equation.
where is the constant value of the flood awareness decay, while
represents the half-time, i.e. the time (in years) during which the flood memory decays to one-half of its initial value in the society.
In this study, we assumed that severe flood events can lead to lower awareness decay due to the higher psychological shock and post-event consequences when compared to less frequent and intense flood events (Dolcos and Cabeza Citation2002, Siegrist and Gutscher Citation2008, Rubin Citation2014, García-Gavilanes et al. Citation2017, Fanta et al. Citation2019, Mondino et al. Citation2020b). Thus, when considering variable flood awareness decay, , we used a linear function between relative flood damage, F, and the minimum and maximum values that the flood awareness decay can assume:
where and
are minimum and maximum values of flood awareness decay representing a longer (
= 15 years) and shorter (
= 2 years) time needed for the event to decay (Ridolfi et al. Citation2020a).
The proportion of population living in the floodplain, G, is calculated as a contribution of population growth rate, of the long-term effect of society’s flood awareness (Fanta et al. Citation2019), and of abrupt change in floodplain population density due to the flood event (e.g. human displacement):
where is the growth rate of the society (Me-Bar and Valdez Citation2004) and
is a parameter accounting for the risk-taking attitude of the society (Scolobig et al. Citation2012). Other socio-economic factors that might affect population growth are not included in this socio-hydrological model, to reduce the complexity of the model. Finally, flood losses, L, are calculated as the product of the relative flood damage, F, and the density of population living in the floodplain, G:
summarize the model state variables and model parameters.
Table 1. Summary of the state variables of the socio-hydrological model.
Table 2. Summary of the model parameters.
3 Experimental set-up
Three experiments were carried out to assess the impact of variable flood awareness decay on flood losses and the density of the population living in the floodplain. In particular, we explored the sensitivity of the model results to the selection of the minimum and maximum values of the variable awareness decay, and to the flood frequency and intensity. We considered two standard prototypes of floodplain management systems: the so-called green society (prone not to build levees) and the so-called techno society (prone to levee construction). A summary of the characteristics of each experiment is reported in .
Table 3. Summary of the different experiments proposed in this study.
3.1 Experiment 1 – Event analysis
This experiment aims to compare model results achieved using constant or variable values of flood awareness decay (see EquationEquation 5)(5)
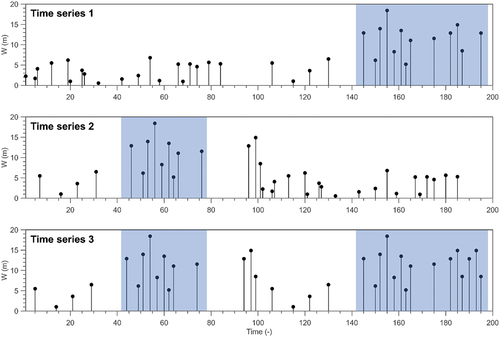
(5) for three hypothetical time series of high-water levels W. These time series are generated from the time series proposed by Di Baldassarre et al. (Citation2015) and are meant to represent different situations, in which intense flood events occur at the beginning (time series 1), at the end (time series 2), or at both beginning and end (time series 1), as represented in . The minimum and maximum values that the flood awareness decay can assume, when treated as variable, are calculated using 2 and 15 years as half-time values, as suggested by Ridolfi et al. (Citation2020a). For the constant value of the flood awareness decay, we used the average of the variable decay values, to ensure a comparable analysis of model results.
Figure 2. Time series used in Experiment 1, with periods with intense flood events indicated (shaded areas).
3.2 Experiment 2 – Minimum and maximum awareness decay
This second experiment explores the sensitivity of the socio-hydrological model to different values of flood awareness decay for the three synthetic time series considered in Experiment 1. Specifically, we performed a sensitivity analysis on the half-life parameters used for calculating both the constant value of flood awareness decay and the minimum and maximum values in variable awareness decay. An ensemble of 10 000 half-life values was generated using a Monte Carlo approach by sampling from a uniform distribution between a lower and an upper limit. In the case of constant awareness decay (see EquationEquation 4(4)
(4) ), the upper and lower limits of the uniform distribution of the half-time parameter were selected to be 2 and 15 years based on the values reported by Ridolfi et al. (Citation2020a). In the case of variable decay (see EquationEquation 5
(5)
(5) ), the minimum and maximum values of
and
were generated following a uniform distribution considering the same upper and lower limits of the half-time parameters. When generating the ensemble of 10 000 values of half-life, the value of
was constrained to always be higher than the one of
. Simulated flood awareness, flood losses, and population density in the two flood awareness decay scenarios were compared in terms of the mean and standard deviation of the model ensemble, for the two standard prototype societies.
3.3 Experiment 3 – Flood frequency and intensity
In this last experiment, we investigated the influence of flood frequency and intensity on changes in flood awareness and flood losses for constant and variable awareness decay. Because the results from Experiment 1, with only three synthetic time series, are not sufficient to draw general findings, multiple time series of high-water levels W with different numbers of events and different intensities were generated. In particular, we considered times series of annual W over 200 years duration, characterized by a number of flood events, E (i.e. W higher than 0), uniformly varying from 1 to 100 and with maximum intensity, I, from 2 m to 20 m. Each generated time series was characterized by a given value of E and I. For example, a sampled time series of W with E and I equal to 10 and 5, respectively, would correspond to 10 flood events randomly occurring within the 200 years, and with varying intensity with a maximum value of 5 m. For each couple of E and I values, a total of 5000 simulations were performed to account for the random values for the number of flood events and maximum intensity. A total of 100 values each of E and I were generated, leading to a total of 100 × 100 × 5000 model runs. Model results achieved with constant and variable awareness decay were compared by calculating the mean and standard deviation of flood awareness, flood losses, and population density for couples of E and I values.
4 Results and discussion
4.1 Experiment 1
The results of Experiment 1 () highlight the importance of considering a variable flood awareness decay when simulating human–flood dynamics and emerging phenomena. From the time series in it can be observed that variable flood awareness decay shows lower values than the constant awareness after flood events, leading to high relative damages F (e.g. at time 150 in time series 1 or at time 55 in time series 2) for the techno society. As a result, a slower reduction in flood awareness is found. For example, low awareness decay can be observed at years 150, 58, and 160 during the time series 1, 2, and 3, respectively, with a consequently slower reduction of flood awareness. On the other hand, in a green society (represented with empty dots and dashed lines in ) no high relative flood damages are experienced, so awareness decay shows high values and a consequently faster fading of flood awareness. This can be observed in time series 1 and 2, in which the green society showed awareness decay higher than the average constant values up to year 150 and before year 100, respectively.
Figure 3. Results of the socio-hydrological model in terms of relative flood damage, flood awareness decay, flood awareness, population density within the floodplain, and flood losses in the case of variable and constant awareness decay and in the case of techno (continuous line) and green (dashed line) societies.
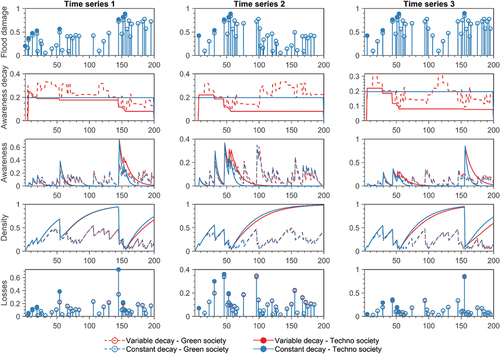
Changes in flood awareness affect population density within the floodplain and flood losses. We assume that at the beginning of each simulation the society has no awareness of past flood events. In the techno society, low values of flood awareness led to an increase in floodplain population density and the consequent increase in losses when flooding occurs. This phenomenon, known as the levee effect, tends to be less pronounced in the case of variable flood awareness decay due to the simulated higher values of flood awareness that led to lower population density and consequently lower flood losses. This dynamic can be observed at years 150 and 58 during time series 1 and 2 and at years 55 and 160 during time series 3 for the techno society. On the other hand, changes in flood awareness partially affect the green society due to the already low values of population density and flood losses, a consequence of the emerging adaptation effect (as described in Di Baldassarre et al. Citation2015).
4.2 Experiment 2
Experiment 1 shows the influence of variable flood awareness decay in shaping human–flood dynamics. However, those results are linked to a specific value of the half-life parameters. Experiment 2 explores the effect of different half-life values and consequent flood awareness decay on changes in flood awareness, flood losses, and population density for techno and green societies. The findings of Experiment 2 () show the relative change between the average value of the model output calculated with the ensemble values of variable and constant awareness decay (see Section 3.2). The results reveal similar human–flood dynamics to those observed in Experiment 1. Higher flood awareness values, on average, are obtained with variable awareness decay than with constant decay in the techno society for the three analysed time series. The opposite results are achieved when considering the green society, in which the low relative flood damage (see ) causes a faster fading of flood awareness compared to the case of constant decay. As a consequence, higher values of population density and flood losses are found when considering variable awareness decay (the positive relative change reported in ) in green society for all three time series.
Figure 4. Relative changes between the average value of flood awareness, population density, and flood losses calculated with the ensembles of variable and constant awareness decay values for the three time series used in Experiment 1.
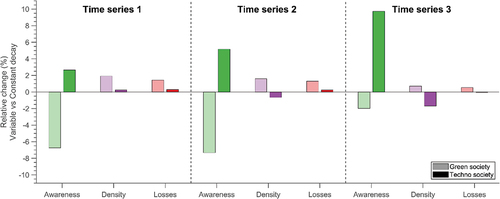
Interesting results are found when looking at changes in population density and flood losses for the techno society. While positive relative changes are obtained (i.e. higher values found for variable awareness decay than constant decay) during time series 1, the opposite results can be observed for time series 2 and 3. This demonstrates the sensitivity of the model results to the frequency and intensity of the high-water level W during each time series.
4.3 Experiment 3
The findings of Experiment 2 highlight that different flood awareness decay levels can lead to diverging results in the case of time series of high-water levels having different flood event characteristics. Thus, Experiment 3 focuses on assessing the influence of different scenarios of flood frequency and intensity on the changes in flood awareness, population density, and flood losses for constant and variable awareness decay. shows the average values of the model output after 5000 runs for each couple of number of events and flood intensity in the case of the techno society (see Section 3.3). The results demonstrate that frequent and intense flood events tend to generate higher awareness when considering variable awareness decay ()) than constant decay ()). In particular, event frequency has a higher influence on flood awareness and population density than the intensity of the events for high intensity values. On the other hand, awareness and population density are more sensitive to flood intensity than flood frequency for low intensity values.
Figure 5. Results of the socio-hydrological model in terms of flood awareness, population density, and flood losses as the average values of the 5000 runs for each pair of values for flood intensity and number of events in the case of (a) variable flood awareness decay and (b) constant flood awareness decay for a techno society.
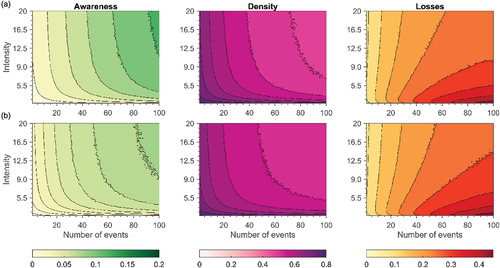
The results of this experiment stress the importance of changes in flood awareness in shaping human–flood dynamics. In fact, because of the high flood awareness values during intense and frequent events, population density shows slightly lower values than in the case of isolated and not-intense events. Interestingly, higher values of flood losses are found for low flood intensity and high number of events rather than high intensities and frequent events in both scenarios of flood awareness decay. This could be caused by the higher population density observed for low flood intensity values as flood awareness is low due to the low flood intensity.
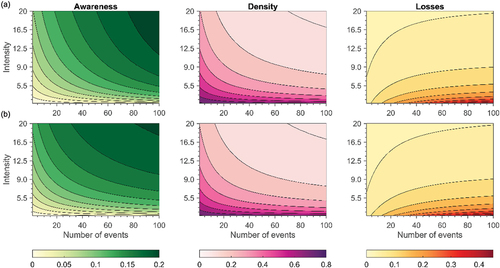
summarizes the results of Experiment 3 obtained with the green society. Similar dynamics between flood awareness, population density, and flood losses previously described for the techno society () can also be observed for the green society. In particular, higher flood awareness values are simulated for the green society for intense and frequent flood events due to the absence of a levee system protecting the society from flooding. Therefore, lower population density and flood losses are found in the green society for different flood intensity and frequency values. Flood awareness is higher in the case of variable flood awareness decay, as previously observed in Experiments 1 and 2. As in the case of the techno society, despite the frequency of the flood events, low flood intensity leads to higher population density and thus greater flood losses.
Figure 6. Results of the socio-hydrological model in terms of flood awareness, population density, and flood losses as average values for the 5000 runs for each pair of values for flood intensity and number of events in the case of (a) variable flood awareness decay and (b) constant flood awareness decay for a green society.
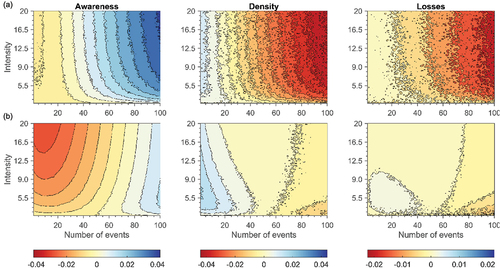
displays the differences between the model results achieved using variable and constant flood awareness decay in the case of techno society and green society. Higher positive differences in flood awareness are found in the techno society when considering variable awareness decay. This is evident for high flood frequency values (i.e. number of events). As a result, low and negative differences (i.e. lower values of flood losses obtained with variable awareness decay, ), than with constant decay, )) can be observed for population density and flood losses. This is consistent with the results shown in the previous experiments. For the green society, a small number of intense events leads to higher flood awareness when considering constant awareness decay than variable decay (negative differences in )). Population density and flood losses show small differences compared to flood awareness behaviour for the green society ()).
Figure 7. Differences in the results of the socio-hydrological model (flood awareness, population density, and flood losses) achieved using variable versus constant flood awareness decay in the case of (a) a techno society or (b) a green society.
5 Conclusions
This study explored human–flood dynamics when considering variable flood awareness decay of societies undertaking different types of measures to cope with flooding. In particular, we assume that flood awareness decay is dependent on the intensity and frequency of the relative flood damage. To test the effects of variable awareness decay on socio-hydrological dynamics in a floodplain, we modified an existing socio-hydrological model and carried out three different synthetic experiments. Multiple scenarios of minimum and maximum flood awareness decay values, flood intensity, and flood frequency were generated in the synthetic experiments. The sensitivity of model outputs (i.e. flood awareness, population density living in the floodplain areas, and flood losses) to variable and constant values of flood awareness decay was assessed.
The findings of this study reveal the importance of accounting for variable flood awareness decay when modelling the human–flood dynamics. Using a constant awareness decay, a standard assumption in current socio-hydrological modelling, leads to underestimation of flood awareness after severe flood events when modelling a society that builds levee systems to cope with floods. Societies tend to more slowly forget flood events that produced high damages, generating a consequently higher awareness over time. On the other hand, overestimation of flood awareness occurs when using constant awareness decay for societies coping with flooding by resettling away from the floodplain. Because of low flood damages, societies will forget faster the occurrence of the flood event, leading to lower awareness over time. Accumulation and decay of flood awareness are shaping the human–flood dynamics. The effect of human–flood phenomena such as the levee effect and adaptation effects could be over- or under-estimated when considering constant flood awareness decay.
The sensitivity analysis on different half-life values showed a higher flood awareness value, on average, with variable awareness decay in the techno society, which leads to lower population density when no floods occur, and thus lower flood losses. A reduction of flood awareness with the consequent increase in population density and increase in flood losses are observed in the green society: this leads to a less pronounced adaptation effect when results are compared to a green society modelled on constant awareness decay. We also show that frequent and intense flood events tend to generate higher awareness when considering variable awareness decay.
Our study emphasizes the importance of considering variable flood awareness decay for improving our understanding of human–flood dynamics and effectively improving flood risk management. Future modelling studies should be focused on implementing and testing the proposed socio-hydrological model in real-world case studies to investigate whether similar feedback mechanisms can be observed. Moreover, these modelling studies should include the geographical location of the flooding as an important indicator of different human exposure, vulnerability, and consequent flood awareness. Finally, qualitative and quantitative observations of flood awareness decay should be integrated to further validate socio-hydrological models and advance the general understanding of human–flood systems.
Disclosure statement
No potential conflict of interest was reported by the authors.
Additional information
Funding
References
- Abebe, Y.A., et al., 2019. A coupled flood-agent-institution modelling (CLAIM) framework for urban flood risk management. Environmental Modelling & Software, 111, 483–492. doi:10.1016/j.envsoft.2018.10.015
- Aerts, J.C.J.H., et al., 2018. Integrating human behaviour dynamics into flood disaster risk assessment. Nature Climate Change, 8 (3), 193–199. Nature Publishing Group. doi:10.1038/s41558-018-0085-1.
- Alonso Vicario, S., et al., 2020. Unravelling the influence of human behaviour on reducing casualties during flood evacuation. Hydrological Sciences Journal, 65 (14), 2359–2375. Taylor & Francis. doi:10.1080/02626667.2020.1810254.
- Baan, P.J. and Klijn, F., 2004. Flood risk perception and implications for flood risk management in the Netherlands. International Journal of River Basin Management, 2 (2), 113–122. Taylor & Francis Group. doi:10.1080/15715124.2004.9635226.
- Barendrecht, M.H., et al., 2019. The value of empirical data for estimating the parameters of a sociohydrological flood risk model. Water Resources Research, 55 (2), 1312–1336. John Wiley & Sons, Ltd. doi:10.1029/2018WR024128.
- Boholm, A., 1998. Comparative studies of risk perception: a review of twenty years of research. Journal of Risk Research, 1 (2), 135–163. Taylor & Francis. doi:10.1080/136698798377231.
- Bradford, R.A., et al., 2012. Risk perception–issues for flood management in Europe. Natural Hazards and Earth System Sciences, 12 (7), 2299–2309. Copernicus GmbH. doi:10.5194/nhess-12-2299-2012.
- Brown, J.D. and Damery, S.L., 2002. Managing flood risk in the UK: towards an integration of social and technical perspectives. Transactions of the Institute of British Geographers, 27 (4), 412–426. Wiley Online Library. doi:10.1111/1475-5661.00063.
- Bubeck, P., et al., 2020. Using panel data to understand the dynamics of human behavior in response to flooding. Risk Analysis, 40 (11), 2340–2359. Wiley Online Library. doi:10.1111/risa.13548.
- Bubeck, P., Botzen, W.J.W., and Aerts, J.C., 2012. A review of risk perceptions and other factors that influence flood mitigation behavior. Risk Analysis: An International Journal, 32 (9), 1481–1495. Wiley Online Library. doi:10.1111/j.1539-6924.2011.01783.x.
- Ciullo, A., et al., 2017. Socio-hydrological modelling of flood-risk dynamics: comparing the resilience of green and technological systems. Hydrological Sciences Journal, 62 (6), 880–891. Taylor & Francis. doi:10.1080/02626667.2016.1273527.
- Da Deppo, L., Datei, C., and Salandin, P., 2004. Sistemazione dei Corsi D’acqua. Padova, Italy: Libreria Int. Cortina.
- Di Baldassarre, G., et al., 2013a. Towards understanding the dynamic behaviour of floodplains as human-water systems. Hydrology and Earth System Sciences, 17 (8), 3235–3244. doi:10.5194/hess-17-3235-2013.
- Di Baldassarre, G., et al., 2013b. Socio-hydrology: conceptualising human-flood interactions. Hydrology and Earth System Sciences, 17 (8), 3295–3303. Copernicus GmbH. doi:10.5194/hess-17-3295-2013.
- Di Baldassarre, G., et al., 2015. Debates—Perspectives on socio-hydrology: capturing feedbacks between physical and social processes. Water Resources Research, 51 (6), 4770–4781. doi:10.1002/2014WR016416.
- Dolcos, F. and Cabeza, R., 2002. Event-related potentials of emotional memory: encoding pleasant, unpleasant, and neutral pictures. Cognitive, Affective, & Behavioral Neuroscience, 2 (3), 252–263. doi:10.3758/CABN.2.3.252.
- Fanta, V., Šálek, M., and Sklenicka, P., 2019. How long do floods throughout the millennium remain in the collective memory? Nature Communications, 10 (1), 1–9. Nature Publishing Group. doi:10.1038/s41467-019-09102-3.
- Ferdous, M.R., et al., 2019a. The levee effect along the Jamuna River in Bangladesh. Water International, 44 (5), 496–519. Routledge. doi:10.1080/02508060.2019.1619048.
- Ferdous, M.R., et al., 2019b. The Costs of Living with Floods in the Jamuna Floodplain in Bangladesh. Water, 11 (6), 1238. Multidisciplinary Digital Publishing Institute. doi:10.3390/w11061238.
- Franceschinis, C., et al., 2021. Heterogeneity in flood risk awareness: a longitudinal, latent class model approach. Journal of Hydrology, 599, 126255. doi:10.1016/j.jhydrol.2021.126255
- García-Gavilanes, R., et al., 2017. The memory remains: understanding collective memory in the digital age. Science Advances, 3 (4), e1602368. American Association for the Advancement of Science. doi:10.1126/sciadv.1602368.
- Haer, T., et al., 2017. Integrating household risk mitigation behavior in flood risk analysis: an agent-based model approach. Risk Analysis, 37 (10), 1977–1992. doi:10.1111/risa.12740.
- Heine, R.A. and Pinter, N., 2012. Levee effects upon flood levels: an empirical assessment. Hydrological Processes, 26 (21), 3225–3240. Wiley Online Library. doi:10.1002/hyp.8261.
- Kellens, W., et al., 2011. An analysis of the public perception of flood risk on the Belgian coast. Risk Analysis: An International Journal, 31 (7), 1055–1068. Wiley Online Library. doi:10.1111/j.1539-6924.2010.01571.x.
- Kellens, W., Terpstra, T., and De Maeyer, P., 2013. Perception and communication of flood risks: a systematic review of empirical research. Risk Analysis: An International Journal, 33 (1), 24–49. Wiley Online Library. doi:10.1111/j.1539-6924.2012.01844.x.
- Kreibich, H., et al., 2017. Adaptation to flood risk: results of international paired flood event studies. Earth’s Future, 5, 953–965. doi:10.1002/2017EF000606.
- Lechowska, E., 2018. What determines flood risk perception? A review of factors of flood risk perception and relations between its basic elements. Natural Hazards, 94 (3), 1341–1366. doi:10.1007/s11069-018-3480-z.
- Liu, J., et al., 2007. Complexity of coupled human and natural systems. science, 317 (5844), 1513–1516. American Association for the Advancement of Science. doi:10.1126/science.1144004.
- Mazzoleni, M., et al., 2021. Water management, hydrological extremes, and society: modeling interactions and phenomena. Ecology & Society, 26 (4). doi:10.5751/ES-12643-260404.
- Me-Bar, Y. and Valdez, F., Jr, 2004. Recovery time after a disaster and the ancient Maya. Journal of Archaeological Science, 31 (9), 1311–1324. Elsevier. doi:10.1016/j.jas.2004.02.012.
- Michaelis, T., Brandimarte, L., and Mazzoleni, M., 2020. Capturing flood-risk dynamics with a coupled agent-based and hydraulic modelling framework. Hydrological Sciences Journal, 65 (9), 1458–1473. Taylor & Francis. doi:10.1080/02626667.2020.1750617.
- Mondino, E., et al., 2020a. Exploring changes in hydrogeological risk awareness and preparedness over time: a case study in northeastern Italy. Hydrological Sciences Journal, 65 (7), 1049–1059. Taylor & Francis. doi:10.1080/02626667.2020.1729361.
- Mondino, E., et al., 2020b. The role of experience and different sources of knowledge in shaping flood risk awareness. Water, 12 (8), 2130. Multidisciplinary Digital Publishing Institute. doi:10.3390/w12082130.
- Mondino, E., et al., 2021. Longitudinal survey data for diversifying temporal dynamics in flood risk modelling. Natural Hazards and Earth System Sciences Discussions, 1–32. Copernicus GmbH. doi:10.5194/nhess-2021-88.
- Penning-Rowsell, E., Johnson, C., and Tunstall, S., 2006. ‘Signals’ from pre-crisis discourse: lessons from UK flooding for global environmental policy change? Global Environmental Change, 16 (4), 323–339. Elsevier. doi:10.1016/j.gloenvcha.2006.01.006.
- Penning-Rowsell, E.C., Sultana, P., and Thompson, P.M., 2013. The ‘last resort’? Population movement in response to climate-related hazards in Bangladesh. Environmental Science & Policy Global Environmental Change, Extreme Environmental Events and ‘Environmental Migration’: Exploring the Connections, 27, S44–S59. doi:10.1016/j.envsci.2012.03.009
- Raaijmakers, R., Krywkow, J., and van der Veen, A., 2008. Flood risk perceptions and spatial multi-criteria analysis: an exploratory research for hazard mitigation. Natural Hazards, 46 (3), 307–322. Springer. doi:10.1007/s11069-007-9189-z.
- Ridolfi, E., Albrecht, F., and Baldassarre, G.D., 2020a. Exploring the role of risk perception in influencing flood losses over time. Hydrological Sciences Journal, 65 (1), 12–20. Taylor & Francis. doi:10.1080/02626667.2019.1677907.
- Ridolfi, E., Mondino, E., and Di Baldassarre, G., 2020b. Hydrological risk: modeling flood memory and human proximity to rivers. Hydrology Research, 52 (1), 241–252. doi:10.2166/nh.2020.195.
- Rubin, D.C., 2014. How quickly we forget. Science, 346 (6213), 1058–1059. American Association for the Advancement of Science. doi:10.1126/science.aaa2341.
- Scolobig, A., De Marchi, B., and Borga, M., 2012. The missing link between flood risk awareness and preparedness: findings from case studies in an Alpine Region. Natural Hazards, 63 (2), 499–520. doi:10.1007/s11069-012-0161-1.
- Siegrist, M. and Gutscher, H., 2008. Natural hazards and motivation for mitigation behavior: people cannot predict the affect evoked by a severe flood. Risk Analysis, 28 (3), 771–778. doi:10.1111/j.1539-6924.2008.01049.x.
- Sivapalan, M. and Blöschl, G., 2015. Time scale interactions and the coevolution of humans and water. Water Resources Research, 51 (9), 6988–7022. doi:10.1002/2015WR017896.
- Sivapalan, M., Savenije, H.H., and Blöschl, G., 2012. Socio-hydrology: a new science of people and water. Hydrological Processes, 26 (8), 1270–1276. doi:10.1002/hyp.8426.
- Slovic, P., 1987. Perception of risk. Science, 236 (4799), 280–285. American Association for the Advancement of Science. doi:10.1126/science.3563507.
- Terpstra, T., et al., 2006. The perception of flood risk and water nuisance. Water Science and Technology, 54 (6–7), 431–439. doi:10.2166/wst.2006.573.
- Thieken, A., et al., 2007. Coping with floods: preparedness, response and recovery of flood-affected residents in Germany in 2002. Hydrological Sciences Journal, 52 (5), 1016–1037. Taylor & Francis. doi:10.1623/hysj.52.5.1016.
- Thieken, A., et al., 2016. Review of the flood risk management system in Germany after the major flood in 2013. Ecology and Society, 21 (2). The Resilience Alliance. doi:10.5751/ES-08547-210251.
- Tversky, A. and Kahneman, D., 1973. Availability: a heuristic for judging frequency and probability. Cognitive Psychology, 5 (2), 207–232. Elsevier. doi:10.1016/0010-0285(73)90033-9.
- Viglione, A., et al., 2014. Insights from socio-hydrology modelling on dealing with flood risk – roles of collective memory, risk-taking attitude and trust. Journal of Hydrology Creating Partnerships between Hydrology and Social Science: A Priority for Progress, 518, 71–82. doi:10.1016/j.jhydrol.2014.01.018.
- Wachinger, G., et al., 2013. The risk perception paradox—implications for governance and communication of natural hazards. Risk Analysis, 33 (6), 1049–1065. Wiley Online Library. doi:10.1111/j.1539-6924.2012.01942.x.
- White, G.F., 1945. Human adjustment to floods: department of geography research paper no. 29. Chicago, IL: University of Chicago.