
ABSTRACT
This article focuses on the need to improve current knowledge of sedimentation and erosion processes in small reservoirs using the example of the Pocheň reservoir (Czech Republic). We combined data from sediment cores with unmanned aerial vehicle imaging and ground-penetrating radar survey data. The results show a distinct sediment distribution, grain-size gradient, petrophysical properties, and geochemistry. Sediment thickness increases in the proximal-to-distal direction (from the inflow to the dam) with frequent erosion near the inflow, especially during floods. This contributed to the sediment relocation towards distal sites with a tendency towards downstream accretion. After reservoir flushing, sedimentation processes were replaced by drawdown-enhanced erosion. Considerable erosion occurred along a temporary drawdown channel, resulting in headward erosion and channel incision. Lateral erosion resulted in drawdown-channel widening. The most extensive lateral erosion took place in the middle part of the reservoir, where the channel created a complex multichannel-branched system.
Editor A. Castellarin; Associate Editor S. Conevski
1. Introduction
Water reservoirs of all sizes provide significant barriers in the transport of river sediments because sedimentation is a natural process in all water bodies. Silting results in decreasing reservoir capacity, which can degrade their original function and causes significant problems for reservoir management. Therefore, sedimentation is considered the principal cause of reduced reservoir life around the world (e.g. Mahmood Citation1987, Morris and Fan Citation1997). The future fate of reservoirs largely depends on the volume and properties of the received material. Small ponds and reservoirs, which are prone to quick infilling, are particularly vulnerable (Dendy Citation1974, Carvalho et al. Citation2000). There are a few million such reservoirs worldwide, according to estimates (Verstraeten and Poesen Citation2000). Small ponds and reservoirs are also numerous in the Czech Republic.
Silting of reservoirs can be accelerated by inappropriate interventions (typically in agriculture) in their catchments, causing accelerated erosion. In addition, the importance of small reservoirs is considered to be increasing because of changing climate and prolonged periods of droughts. Planning and building new reservoirs is a long-term process, so it is necessary to make the best use of the existing ones and, above all, to restore their capacity. In addition, an adverse effect of reservoir silting is the lack of sediment downstream of dams (hungry waters), which increases river erosion and affects fluvial ecosystems (Brandt Citation2000, Pique et al. Citation2017). As a result, a number of remediation operations can be considered to restore the original storage capacity of reservoirs, such as flushing, controlled sediment routing, or mechanical removal (e.g. Schüttrumpf and Detering Citation2011, Kondolf et al. Citation2014a, Guillén-Ludeña et al. Citation2018, Bladé Castellet et al. Citation2019).
Drawdown sediment flushing or sluicing has been performed in reservoirs of different sizes (Brignoli et al. Citation2017, Espa et al. Citation2019), but flushing management requires specific conditions such as high hydrological velocities, adequate reservoir size, and geometry (Frémion et al. Citation2016). Flushing operations are usually performed in mountain reservoirs (Guillén-Ludeña et al. Citation2018, Manso et al. Citation2018). However, this is often not possible for large reservoirs because they are too big and flushing may only affect a small part of the reservoir. Equally, flushing is not preferred in small reservoirs because of too low discharge. Therefore, direct excavation of sediments is preferred, which requires temporary lowering of the reservoir water levels or full emptying. After water level drawdown, erosion can take place in the reservoir, especially along the former channel (Pacina et al. Citation2020), but the erosion rate is also influenced by sediment properties, such as their grain size and composition (Randle et al. Citation2015). However, ongoing erosion of reservoir sediments can be a serious problem in reservoir drawdown for a long period of time. Potential contamination borne by the bottom sediments may represent a considerable risk for the downstream ecosystem (Frémion et al. Citation2016).
Therefore, sedimentation rates, the rates and extent of erosion during low water levels, and associated contamination risks all represent key elements in the management of small reservoirs, and understanding these elements is critical. Assessment of erosion rate and extent after reservoir drawdown together with the analysis of sediment quality can help to predict the impact of drawdown management for downstream river reach and its potential pollution. The choice of methods for the survey of reservoir sediments after drawdown is crucial also in reservoir management. Various approaches such as sediment coring or geophysical or airborne surveys provide a limited view only, which indicates a research gap. On the other hand, a combination of methods makes it possible to evaluate the data critically.
The Pocheň reservoir is a typical small reservoir in a small catchment area with mixed land use (forests, fields, and meadows), and with minimal urban area and industrial impact, making it a logical choice for this study. This reservoir was emptied for sediment management in 2017, which provided a great opportunity to study the sedimentation, erosion, and anthropogenic load associated with the emerged reservoir bottom sediments. The aim of this paper is to provide insight into the complex sedimentation and erosion processes in a small model reservoir using high-resolution stratigraphy of sediment cores combined with geophysical and unmanned aerial vehicle imaging. This approach can offer an innovative method and evaluate the suitability of different techniques to analyse sedimentation processes in small reservoirs, as well as processes related to the reservoir drawdown. This missing link could be further used to design a suitable management strategy regarding sediment removal. Another aim is to describe erosion patterns after reservoir drawdown in relation to sediment properties and their potential contamination.
2. Geographic setting and history
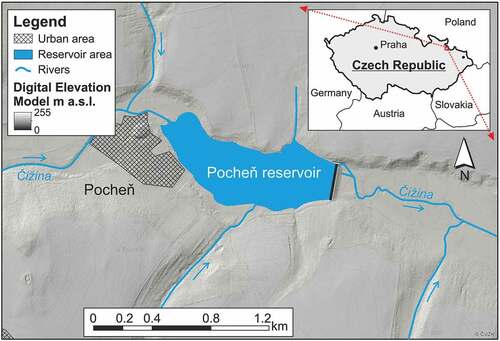
The Pocheň reservoir () is located in the northeastern part of the Czech Republic (close to Krnov City) on the Čížina River, a right-hand tributary of the Opava River, which is itself a left-hand tributary of the Odra River. The reservoir was built in 1975 to store water for agriculture, flood control, fishing and recreation. This valley-type reservoir has a total water capacity of 0.817 million m3 and a surface area of 16.6 ha. The maximum water depth is 8 m near the dam, but the average water depth is 4.9 m. The mean annual discharge of the Čížina River is 0.26 m3s−1 (10-year flood: Q10 = 26.6 m3s−1, 50-year flood: Q50 = 48.2 m3s−1 and 100-year flood: Q100 = 59.8 m3s−1). The upstream catchment area covers 64.85 km2 and accommodates only small villages and no large industrial sites. Land use in the catchment changed in the second half of the 20th century when the original mosaic of small fields was transformed into large parcels. The proportion of forests and meadows increased and arable land decreased after 1989.
Figure 1. Location of the Pocheň reservoir.
At present, the catchment is composed of a mosaic of crop fields, meadows and forests. A flash flood hit the reservoir in 1996, during which water spilled over the dam and the flood wave damaged downstream villages. Consequently, Povodí Odry, the reservoir operator, decided to repair the dam body in 1998. Because of the loss of the storage capacity, the reservoir was drained in autumn 2017. After the draining, the reservoir bottom was intentionally exposed to weather conditions to improve the properties of reservoir sediments before further manipulation. Finally, sediments were dredged in 2020 and the reservoir was filled again.
3. Methods
A combination of core drilling, ground-penetration radar (GPR) survey, and aerial imaging of the reservoir bottom was used to obtain a robust model of sedimentation and erosion processes. A total of 21 GPR sections, 21 to 209 m long, were measured, mainly perpendicular to the streamflow, using a GSSI TerraSirch 3000 (Conyers Inc., USA) GPR equipped with a 400 MHz antenna. To improve the accessibility, the survey was carried out during the winter on the frozen sediment surface; therefore, the relative permittivity (dielectric constant) was set to 4. The number of samples was set to 1024 and time increment to 0.78. The GPR raw data were filtered by move start time, dewow, background removal, energy decay gain, bandpass filter, migration, and running average using ReflexW software (Sandmeier, Germany). The time-to-depth calibration of the GPR sections was done based on correlation with the sediment cores, while the wave velocity was set to 0.055 m/ns.
The reservoir bottom was scanned in January 2018 while the reservoir was drained, using a DJI Phantom 4 Pro unmanned aerial vehicle (UAV) equipped with a 24 mm focal-length lens camera with 85% front overlap and 65% side overlap. Eight ground control points were used for the imaging flight. A high-precision global navigation satellite system (GNSS) system with real-time kinematic positioning (RTK) corrections (Trimble R4) was used for measuring ground control point (GCP). The semi-global matching (SGM) and structure from motion (SfM) methods were used for image processing. The SfM and multi-stereo view image matching method was used to photogrammetrically process the data acquired via low-altitude UAV imaging, using the AgiSoft Photoscan Professional and Trimble INPHO software.
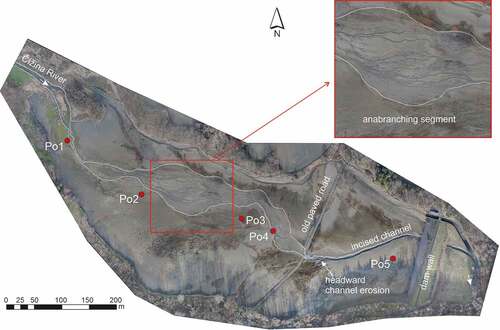
Five cores, marked Po1 to Po5, were retrieved from various parts of the Pocheň reservoir () using a percussion drill set into 1 m foil liners (Po2, 3 and 4) and a UWITEC gravity corer sampler (Austria) with a hydraulic core catcher and placed in tubes with an inner diameter of 6.3 cm (Po1 and Po5). Long cores were composite cores obtained by the reintroduction of the cores into the hole (three segments). The cores were cut lengthwise, described, and sampled at 1-cm vertical intervals. The samples were dried under ambient conditions and stored in plastic bags.
Figure 2. Unmanned aerial vehicle (UAV)-produced orthophoto image of the Pocheň reservoir showing the exposed reservoir bottom, location of the cores and erosional processes.
The samples were analysed for mass-specific low-field magnetic susceptibility (MS) using a KLY-4S Kappabridge (Agico, Czech Republic), with 300 Am−1 magnetic field intensity, 920 Hz operating frequency, and sensitivity of 3 × 10⁻⁸ SI. The grain size of selected samples (cores Po1, 2, 3 and 5) was measured with an Analysette 22 MicroTec plus laser particle sizer (Fritsch, Germany). Prior to analysis, the samples were homogenized and mixed into a paste in water. Organic residues and leaves, if present, were removed manually.
The samples were powdered to analytical fineness (< 62 µm) before subsequent analyses. Visible-light diffuse reflectance spectroscopy (Vis DRS) of the powdered samples was measured with an X-Rite SP62 (X-Rite Inc., USA) spectrophotometer with a tungsten light source, d/8 measurement geometry and 8 mm aperture. The output data were presented as sediment brightness (CIEL*) on the black-to-white axis in CIELAB colour system reflecting relative proportions of light and dark mineral constituents in samples. The CIEa* parameter on the red-to-green axis with negative values towards green and positive values towards red was presented in the same colour system.
Mass activity of the 137Cs isotope was measured on the core samples with a vertical interval of 4 cm (four pooled samples were used to increase sediment mass) using an SG1000 LAB gamma-ray spectrometer (Nucleus, USA) with an NaI (Tl) scintillation well detector RT-50 (detection limit 0.02 Bqkg−1) and 30 min measurement time. The elemental composition (lithogenic elements and heavy metals) of selected samples was measured by energy-dispersive X-ray fluorescence (EDXRF) on powdered samples using a DELTA Premium device (Innov-X, USA).
4. Results
4.1. Aerial imagery and GPR survey
The UAV survey was used to better understand the sediment distribution in the reservoir, as well as to assess the extent of the erosion on the exposed bottom. The most distinctive feature of the reservoir bottom is a temporary drawdown channel of the Čížina River (). The river tends to incise its channel into reservoir sediments. Simultaneously with this process, the temporal channel widened because of the collapse of the banks and lateral erosion of the soft, unconsolidated reservoir sediments. The most extensive lateral erosion is indicated in the middle part, where the channel created a complex multi-branched system consisting of many smaller channels. This pattern ends in the medial part where the old paved road crosses the reservoir. Beyond this place, the river flows downstream again in a single channel. There, the channel incises to the level of pre-reservoir sediments also showing a tendency towards headward erosion. To a lesser extent, erosion also occurs at sites more distant from the current thalweg. Those erosive structures widen and deepen towards the channel (analogous to rill erosion), and they are probably related to flushing episodes after heavy rains.
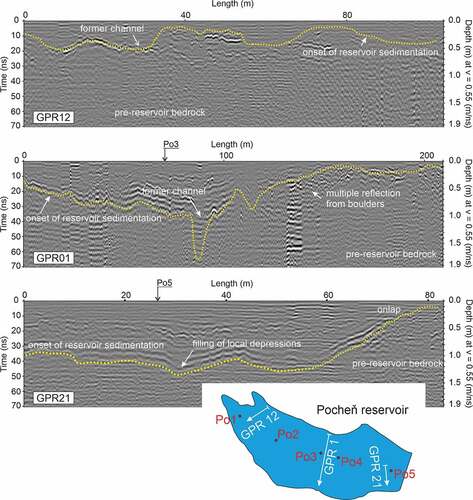
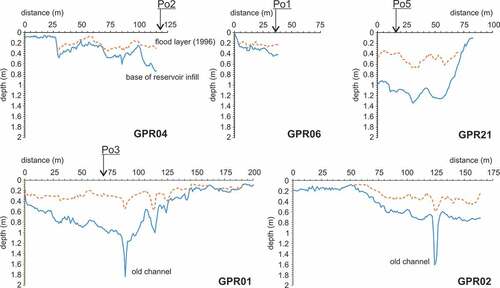
The GPR survey revealed a detailed internal structure of the subsurface (). The maximum depth of penetration within the profiles was 1.8 m. Lower parts of the profiles are characterized by low-frequency noise, usually at depths greater than 1 m, which probably reflects altered bedrock on reservoir margins, or pre-reservoir fluvial deposits, revealing multiple mounded and hyperbolic reflections due to the presence of large clasts and boulders. The onset of reservoir sedimentation, manifesting itself as a boundary between the main radar facies (see , yellow dotted line), is denoted by strong reflection in most of the profiles, and is visible in most of them. This important stratigraphic surface represents the former valley floor before the reservoir filling. Its depth position was verified by core data. On reservoir margins, the reflectors show onlap patterns leaning against the former valley floor. The internal structure of reservoir sediments consisted of several features and two main units. The first unit, developed in local depressions, tends to parallel the pre-reservoir bottom. Such local depressions are located across the whole reservoir including the former channel of the Čížina River, which was identified on several profiles. The second overlying unit is represented by horizontal to sub-horizontal reflectors. An event layer with strong reflection was identified inside this unit; it probably represents a flood event. A distinct pattern in reflection type was found related to its position within the reservoir. Typical proximal profiles, close to the inflow, display poor discontinuous reflections sometimes with mounded and hummocky geometry, while distal profiles (closer to the dam wall) show smooth and well-defined continuous reflectors.
Figure 3. Selected ground-penetration radar (GPR) profiles showing the basic radar facies and bottom morphology features.
4.2. Lithology and petrophysical proxies
Two sediment units were recognized in the cores. The first unit represents older fluvial and colluvial sediment sequences and the second unit comprises reservoir sediments deposited after reservoir filling. The onset of reservoir sedimentation was identified in four cores at depths of 0.4 m (Po1), 0.8 m (Po2), 1 m (Po3), and 1.2 m (Po4), suggesting a slight increase in sediment thickness towards the dam. The base of reservoir sediments was not captured in core Po5; based on the GPR survey, we expect a thickness of 1.5 m at this site. Distinct proximal-to-distal changes have been identified in the lithology of reservoir sediments. A small deltaic body has been recognized in the reservoir inflow, composed primarily of very coarse sands with occasional plant remains, intercalated with organic-rich layers containing abundant plant remains and woody debris. Sediments in the proximal part consist of very coarse-grained sands with abundant plant remains and leaves, sometimes intercalated with finer layers composed of silts or fine-grained sands. More fine-grained homogeneous, sometimes laminated sediments prevail in the medial part of the reservoir; they comprise sandy silts or silty sands. Homogeneous fine-grained sediments, namely silts and clayey silts, prevail in the distal parts.
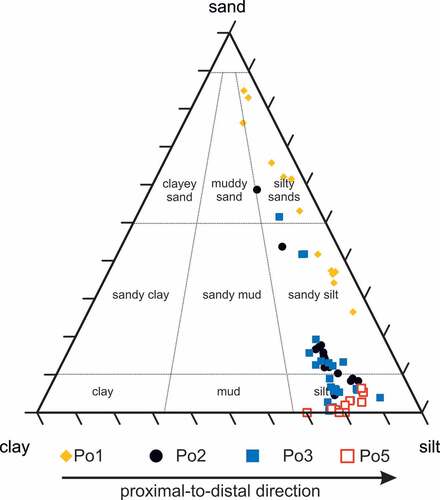
The grain-size distribution indicates strong trends in the proximal-to-distal direction. The results are expressed also in a ternary plot diagram, showing the relative proportion of clay, silt, and sand in order to demonstrate grain-size differences between cores. Most of the reservoir samples are classified as silty sands, sandy silts and silts (). Sand proportions are highly variable and range from 0.01 to 84.4%. The sand component prevails in inflow parts (Po1), having a median value of 61.8%. Significant sand proportions are also found in the medial part of the reservoir (cores Po2 and Po3), while almost zero sand proportions are typical for the reservoir’s distal part (core Po5). Silt proportions also range widely, from 11.5 to 87.1%, and increase downstream; the highest median value (79.3%) is found in core Po5. Clay content ranges from 3.31 to 29.86%; very low values are measured near the inflow (Po1), and conversely the highest values are in the distal parts of the reservoir (Po5), where the highest median value of clay also occurs (19.5%). Proximal cores reveal high downcore variability in the grain size, showing deflection in the sand and silt proportions. A very homogeneous grain-size distribution is observed in the most distal sediments of the reservoir. There are no distinct temporal trends, except a slight upward trend towards finer grain sizes in the top layers of the most distal core (Po5).
Figure 4. Ternary plot diagram showing clay, silt and sand proportions.
The 137Cs mass activity was measured in four cores (Po2 to Po5) and a distinct peak was detected in three of them (). 137Cs mass activity values vary from below the detection limit up to 82 Bqkg−1. Results show that 137Cs mass activity below detection is typical for the deepest parts of the cores, followed by one peak, characterized by a sharp increase. This peak is located at various depth intervals depending on the core position. Peak values are just at the subsurface in core Po2 (0–4 cm depths), and the depth of the peak position increases to 48–53 cm (Po3) and to 62–69 cm (Po4) under the surface. Then, values decrease upward slowly in all three cores. Minor peaks, found in cores Po3 and Po4 and located in the uppermost parts, suggest the reworking of older layers rich in 137Cs. The distal core Po5 shows different depth patterns, in which low mass activities (~ 20 Bqkg−1) of 137Cs are found through the lower part of the profile, with a subsequent peak between 13 and 20 cm below the surface.
Figure 5. Depth profiles of magnetic susceptibility, sediment brightness (CIEL*) and mass activity of 137Cs with inferred interpretation of the Chernobyl accident in 1986 (main peak).
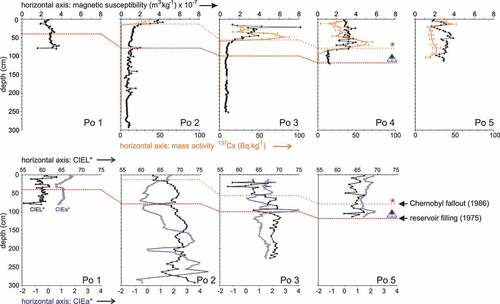
Mass-specific MS values vary widely, from 2.03 × 10⁻⁹ m3kg−1 to 8.27 × 10⁻⁷ m3kg−1 for the older, pre-reservoir unit, and from 6.42 × 10⁻⁸ m3kg−1 to 8.28 × 10⁻⁸ m3kg−1 for reservoir sediments (). MS values reveal stable and uniform depth patterns in lower parts of the cores (alluvial/colluvial sediments). This holds true after the onset of reservoir sedimentation; however, the values are up to one order higher compared to those of the older unit. A sharp increase in MS values is found in the upper parts of the cores from the medial parts, suggesting magnetic enhancement. A small deflection follows and, finally, a slight decrease is observed in the top layers. Distinct trends are found in MS logs enabling core correlation, especially in the middle part between coring sites Po2 and Po4. Core Po1 reveals a uniform log, while the MS log in core Po5 represents the upper part of the reservoir sediment profile. The depth patterns partly correlate with those in other cores.
Colour data points to colour contrast between pre-reservoir and reservoir sediments. Slightly lower values of brightness (CIEL*) are observed for reservoir sediments in some cores, revealing that reservoir sediments are generally darker compared to the older pre-reservoir unit. The exception is the proximal core Po1 containing more light-coloured reservoir sediments (higher values of CIEL*), whose lighter color is probably due to their coarse-grained nature. A short negative excursion in brightness occurs after reservoir filling. The depth distribution of brightness data is usually more heterogeneous in the reservoir sediments, resembling a more sawtooth pattern compared to more stable values in the older pre-reservoir unit (). The brightness shows a vertical distribution, which is consistent with the grain-size distribution. Some CIEL* minima correspond with layers enriched in sand, but in other layers, the opposite trend points to the positive coincidence of high CIEL* values with more fine-grained layers. CIEL* minima coincided with peaks on MS logs and conversely. Depth profiles of CIEa* (red-to green axis) point to an abrupt change of values after reservoir filling (). Low values (CIEa* from ~ −1 to 1), measured above the reservoir base in some cores (Po1 to Po3), suggest a slight shift to greenish (negative values) or a slight shift to reddish hues. CIEa* values (in the reservoir sediment unit) reveal a vertical upward increase towards red hues having only small deflections of values. Core Po3 stands out from this trend, showing deflections in local minima and maxima. CIEa* values show also a slight shift to red hues in the proximal-to-distal direction.
4.3. Bulk-rock elemental geochemistry
The depth profiles of some elements show a change after reservoir filling, reflecting facies changes and fluctuating energy conditions within the reservoir. This is the reason for the sawtooth depth patterns of some elements in the proximal part of the reservoir, showing quick vertical changes in their concentrations, while more stable vertical patterns are typical for the distal parts. An abrupt change of deflection in geochemistry after reservoir filling can be illustrated on Zr depth profiles showing its decrease. Conversely, positive peaks are found in Fe and Mn concentrations after filling. The concentrations of Al, K, Ti, and Rb show a gradually increasing trend towards the lake’s distal parts. The main lithogenic elements (K, Al, Si, Ti, Zr and Rb) reflect variations in the input of siliciclastic sediments. Therefore, the chemical composition of reservoir sediments is related to the grain size. We used the Al/Si ratio as an additional proxy for the grain size, and it showed an increase after filling. The overall trend points to an increase in concentrations of certain elements, namely Rb, in distal sites.
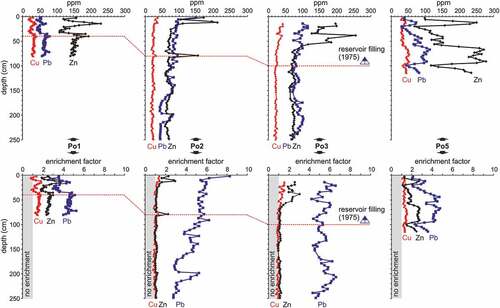
Depth profiles of heavy metals () show very similar trends, but some variations occur. Their concentrations are mostly lower in coarse-grained layers, while in some parts of the cores the effect of the grain size on heavy metal concentrations is missing. Generally, the concentrations of heavy metals increase in the proximal-to-distal direction. Regarding cores located in the inflow and reservoir medial parts, concentrations of Pb, Zn and Cu are highest in subsurface layers. In the most distal core (Po5), the vertical distribution of heavy metals shows their maxima in the interval 90–60 cm below the surface, followed by distinct minimum and smaller subsurface peaks. The heavy metal concentrations were normalized to lithogenic Rb in order to suppress the lithogenic variability (Grygar et al. Citation2010, Sedláček et al. Citation2013). We used the enrichment factor (EF) with the standard formula as the ratio of the actual concentration of a given target element (TE) to the background ratio.
Figure 6. Depth profiles of heavy metals (Cu, Zn and Pb) and their enrichment factors.
EF = TE/Rb(sample)/TE/Rb(background)
The background values (mean upper continental crust) of Rb and heavy metals (Pb, Cu and Zn) were taken from McLennan (Citation2001). The EF values () are highest in the medial part of the reservoir. EF values for Zn and Cu represent minor enrichment (lower than 5), while EF values for Pb varied between 2 and 8.2, often falling under moderate enrichment (Birth Citation2003, Chen et al. Citation2007).
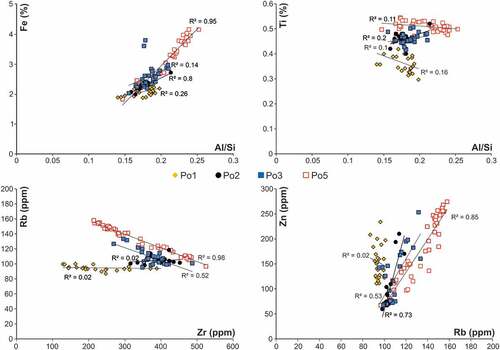
Element ratios were used to distinguish possible differences between cores caused by their position within the reservoir (). The results are displayed in scatter plots of Fe over Al/Si, Ti over Al/Si, Rb over Zr and Rb over Zn. All scatter plots show partial overlaps of element values between individual cores, but slight shifts were recognized for each core, where each branch follows an almost linear trend depending on sediment texture. Distinct clusters were revealed in biplots reflecting the position within the reservoir and differences in the sediment matrix.
Figure 7. Scatter plots of element ratios showing correlations between Fe and Al/Si; Ti and Al/Si; Rb and Zr; Zn and Rb.
5. Discussion
5.1. Aerial imaging and GPR survey
UAV is a good tool to document the volume and extent of flushed or eroded sediments in reservoirs, as proposed by Randle et al. (Citation2015), Pagliari et al. (Citation2017) and Evans et al. (Citation2022). In our study, UAV was able to reveal the extent of the erosion inside the flushed reservoir, particularly bank retreat in the temporary drawdown channel and lateral erosion. For long-term flushed reservoirs, the best results can be achieved by repeated UAV surveys, which can be efficient in documenting erosion progress. The GPR survey displayed three main radar facies organized into architectural elements within the Pocheň reservoir, in accordance with other studies (Moorman Citation2001, Viseras et al. Citation2009, Bábek et al. Citation2020, Citation2021, Sedláček et al. Citation2022). Radar facies RF1 consists of low-frequency noise with some hyperbolic and multiple reflections irregularly scattered in space, having a weak organization into layers; RF1 can be assigned to a colluvial or fluvial sequence below the reservoir sediments. Typical patterns in the reservoir sequence point to chaotic, poorly defined, and irregular reflectors close to the inflow, caused by the heterogeneous nature of coarse-grained proximal sediments (radar facies RF2). Here, reduced thicknesses of the reservoir deposits, seen on the GPR profiles, suggest an interplay of sedimentation and erosion as indicated by the discontinuous character of reflectors. Small hyperbolic and multiple reflections inside the reservoir sequence indicate the presence of boulders, probably transported by flood events. A good example of such a flood layer is probably the layer marked by strong GPR reflection at depths from 0.3 to 0.5 m, which corresponds to the sandy layer found in the cores. We attributed this layer to the 1996 flood event. Finally, horizontal to sub-horizontal continuous and smooth reflectors (radar facies RF3) associated with fine-grained sediments in cores located near the dam indicate predominant suspension settling. The former channel () of the Čížina River (in the 1950s) was recognized in GPR profiles in accordance with its position recorded in old maps.
Figure 8. Map of sediment thickness in the Pocheň reservoir, with the location of all ground-penetration radar (GPR) profiles.
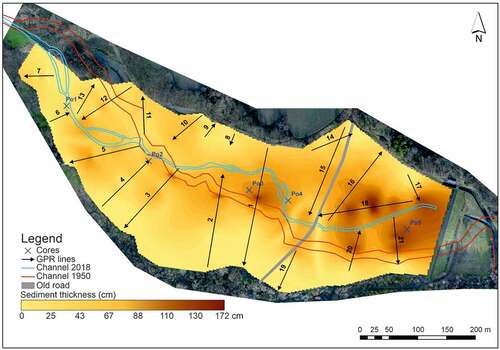
The model of sediment thickness was evaluated in ArcGIS software, based on the identification of the reservoir base using GPR and core data (). It shows the spatial distribution of sediments at the reservoir bottom, accumulated since reservoir construction. The upper brownish colour designates the thicker portion of the sediment layer, while the lower yellow colour designates the thinner portion of the sediment layer inside the reservoir. The sediment thickness increases gradually in the proximal-to-distal direction as well as from reservoir margins to the reservoir centre (axis). The model clearly shows that the sediment layer is thickest (1.7 m) in the deepest region close to the dam, and the average thickness for the whole reservoir is estimated at 0.5 m. A smaller thickness was also found along the temporal river channel. The model shows also some spots (in the proximal and medial parts) having locally higher sediment thickness. The thickness of the reservoir deposit was also visualized on the selected transverse profiles (), which are identical to GPR profiles. The resulting transects show that the base of the reservoir sediments is very close to the present bottom at the reservoir margins and increases towards the reservoir axis. On some transects, this increase is gradual, while in others it is more abrupt (compare transects GPR2 and GPR4). This difference is probably the consequence of local morphology. Transects also revealed some places with abnormally high sediment thickness, representing local depressions of the pre-reservoir surface. Some of them are located very close to the position of the former Čižina River channel from the 1950s.
Figure 9. Transverse profiles of reservoir base infill (solid blue line) and the 1996 flood layer (dashed red line) based on the ground-penetration radar (GPR) survey.
5.2. Processes of sediment accumulation
The transition between older colluvial/alluvial and reservoir sediment was characterized by a gradual and diffuse lithological boundary in terms of colour and textural change, suggesting slow initial filling of the reservoir. It was probably caused by the low discharge of the Čížina River, suggesting only a slow transition from fluvial to lacustrine domains, without substantial erosion of pre-reservoir sediments during initial reservoir filling. Especially in places with a greater distance from the thalweg, deposition of fine-grained overbank sediments took place even during the pre-reservoir fluvial stage. However, variations in inflow discharge, connected to flood events, have blurred the boundary between the two lithological units in very proximal parts, close to the inflow. Another explanation points to the coarse-grained nature of pre-reservoir fluvial sediments near the thalweg; similarly, coarse-grained sediments were brought after dam construction forming a delta, which also contributed to the low lithological contrast between these units.
Results indicate that several stratigraphic reservoir units can be distinguished within the reservoir. Therefore, the evolution of reservoir sedimentation involved three stages. The first involved preferential sediment deposition in local depressions after the initial filling of the reservoir, similarly to other reservoirs (Sedláček et al. Citation2017, Citation2022). The second stage was characterized by the deposition of sheet-like continuous horizontal layers onlapping on the older surface. Delta formation is typical for the inflow part of reservoirs because of decelerating river flow, suitable conditions and reservoir geometry. In the Pocheň reservoir, only a small deltaic accumulation has been formed in the inflow to the reservoir given by low discharge and emerging above the water during the lower water level, suggesting its instability and susceptibility to erosion. Equally, low sediment thickness, found in proximal parts, is the result of frequent resuspension and erosion of reservoir sediments near the former channel. The last stage was characterized by preferential sediment accumulation in distal sites. The youngest unit is almost entirely missing in the proximal part, while its thickness increases towards the dam, suggesting downstream accretion and movement of the depocentre downstream. Part of these youngest sediment packages may represent redeposited proximal sediments.
The sedimentation pattern is driven by the energy conditions related to the inflow discharge, available accommodation space (depending on the actual water level), and reservoir geometry. Similarly, particle size decreases in the proximal-to-distal direction as hydrodynamic energy decreases, which is a common trend in reservoirs (López et al. Citation2016, Sedláček et al. Citation2016, Citation2017). Such a trend is most typical for long and large reservoirs, but the results show that this downstream sorting of particle size can also occur in small reservoirs such as Pocheň. In the inflow area, accumulation and erosion periods alternated, depending on the current discharge and water level. Periods of erosion prevailed, resulting in erosive transport downstream and deposition in the middle and distal parts of the reservoir. Sandy layers originally deposited near the inflow were redeposited in the middle part of the reservoir; however, most coarse-grained sediments could not be transported farther to the dam because of decreasing flow velocity and thus decreasing transport capacity. The erosion and redeposition of sediments in the proximal part and in reservoir margins could be highlighted by the changes in water level. As flow energy decreased in the proximal-to-distal direction, the proportion of fine-grained sediments increased. The distal zone is characterized by the predominance of fine-grained clay and silt sediments deposited under calmer conditions. Sedimentation processes were strongly influenced by the small size of the reservoir, as sediment thickness tends to be higher near the dam, which is typical for small reservoirs (Morris and Fan Citation1997, Shotbolt et al. Citation2005). Fine-grained sediments depleted in the high-energy proximal zone can easily reach the dam, forming a so-called “muddy lake area” (Morris and Fan Citation1997, Shotbolt et al. Citation2005, Sedláček et al. Citation2016), as observed in core Po5, where clay and silt components predominated. Sandy layers rich in organic remains are the result of flooding. However, the sand content decreases very rapidly towards the dam, indicating a rapid loss of flood energy.
The GPR survey and core sediment thickness data were used to determine the volume of sediment trapped in the reservoir. For this calculation, the geometry was approximated to a geometric figure with a trapezoidal cross-section, that resembles a three-dimensional shape (Romero-Díaz et al. Citation2007, Sedláček et al. Citation2016, Bábek et al. Citation2020). We calculated that about 99,000 m3 of sediments has accumulated in the reservoir since it was filled, which corresponds to a total volume of 2250 m3 of sediment deposited annually. A slightly higher value was reported in the GPR survey of the Pocheň reservoir in 2016 (conducted for the Povodí Odry company, Beneš Citation2016) with a sediment volume of 109 362 m3. The difference between these values could be due to the different calculation methods. Another explanation could be loss due to sediment erosion after the drawdown. In this case, approximately 10 000 m3 of sediment would have been removed between 2016 and 2018. Considering the sediment volume in 2018, the capacity of the reservoir has decreased by 12.1% from the original storage capacity of 817 000 m3 in 1975. This corresponds to an annual loss of storage capacity of 0.3%, which is within the range of an annual loss of 0.2 to 1% at the global scale (Mahmood Citation1987, Araújo et al. Citation2006, Wisser et al. Citation2013, Schmengler and Vlek Citation2015).
5.3. Sediment accumulation rates
The age determination was based on two important events. The onset of lacustrine sedimentation (1975) is the most important dated level, which was determined from GPR data, petrophysical logs, and core description. The second event is the position of the Chernobyl peak, which was inferred from 137Cs depth profiles in cores (e.g. Walling et al. Citation1999, Appleby Citation2001, Heim et al. Citation2004, Wildi et al. Citation2004). No significant peak was found in core Po5, but we linked the Chernobyl event to the increase in 137Cs mass activity in the lower part of the profile because of the overall correlation. Average sediment accumulation rates (SARs) were calculated for two time intervals, framed by these events and the time of core retrieval. In the time interval from 1975 to 1986, SAR ranged from 2.72 (Po4) to 5.63 cm/year (Po2), indicating a decrease towards the dam. From 1986 to 2018, SAR ranged from 0.41 (Po2) to 3.04 cm/year (Po5), indicating a gradual increase towards the dam. The temporal shift SAR from the proximal parts to the distal parts indicates that the depocentre (sediment progradation) is moving towards the dam over time. A considerable part of the proximal sediments was eroded and deposited downstream in the distal parts, as shown by the redistribution of the 137Cs-bearing layers into the younger strata, which is known from the other dam reservoirs (cf. Bábek et al. Citation2020).
These results show that SARs in the Pocheň reservoir are controlled by the position within the water body, water depth, size, and geometry of the reservoir (Sedláček et al. Citation2016, Citation2022). The Pocheň SARs are comparable to those of other Czech reservoirs (Sedláček et al. Citation2013, Citation2016, Citation2017, Bábek et al. Citation2020) and to global data (global average SAR: 2 cm/year) (e.g. Müller et al. Citation2000, Arnason and Fletcher Citation2003, Audry et al. Citation2004). However, given its small volume, the Pocheň reservoir is prone to rapid infilling and quick loss of storage capacity, which is a common problem in many small reservoirs and ponds worldwide (Dendy Citation1974, Carvalho et al. Citation2000, Sedláček et al. Citation2016). The SARs can be several orders of magnitude higher during flood periods. A good example is the 1996 flash flood, which resulted in massive sediment input to the Pocheň reservoir and is likely documented by coarse-grained layers in the cores. This event layer consists of a sandy, wedge-shaped form pinching out in the proximal-to-distal direction. The problem of siltation was solved by the construction of a sedimentation pond upstream of the reservoir, finished in 2020, which can trap a considerable amount of incoming sediment from the Čížina River.
5.4. Petrophysical properties and the evidence of erosion
The colour of sediments is a function of sediment composition and is determined by the changing proportions of mineral constituents, especially light-coloured sand grains and dark-coloured fine-grained materials such as clay minerals. Colour changes also indicate facies change after reservoir filling, and some sudden colour changes are associated with grain-size variations (Sedláček et al. Citation2017). Petrophysical proxies identify synchronous layers in the reservoir, which is necessary for predicting sedimentation and/or erosion processes. Slight shifts in the CIEa* parameter are interpreted as facies changes in the proximal-to-distal direction and different redox conditions in various parts of the reservoir. The shift of red hues at the distal sites is probably caused by a longer residence time in the water column leading to a higher degree of Fe oxidation in the oxy–hydroxy mixtures, as has been described in other reservoirs (Sedláček et al. Citation2017, Citation2022, Matys Grygar et al. Citation2018). On the other hand, the difference between proximal and distal samples in the CIEa* parameter is small compared to that seen in long and narrow reservoirs, probably due to low residence time.
MS values reflect changing input of ferromagnetic and other minerals. Distinct MS minima found in the proximal cores were caused by the presence of organic remains, because of the diamagnetic properties of organic matter, and the dilution of magnetic minerals by organic matter (e.g. Foster et al. Citation1998, Sedláček et al. Citation2017). Although some MS peaks coincided with sand-sized layers, no significant causal relationship was found between MS and grain size. The coarse-grained nature of the proximal sediments, containing a large proportion of diamagnetic quartz grains, could contribute to the dilution of MS data. MS depth profiles have also been shown to be a good tool for correlation between cores.
5.5. Trends in elemental geochemistry and pollution
The onset of lacustrine sedimentation was associated with the change in the behaviour of some elements. Some elements, namely Ti and Zr, are very sensitive to the facies change after reservoir filling. Both are normally enriched in the silt fraction (Dypvik and Harris Citation2001, Kylander et al. Citation2011). In contrast, other elements or element ratios show low sensitivity to grain-size changes, such as Al/Si ratio, which contrasts with other reservoirs (Sedláček et al. Citation2013, Citation2017). However, this depends on the geological situation in each individual catchment area and on the conditions in each reservoir. Finally, the difference between pre-reservoir and reservoir sediments depends on the conditions of each reservoir – its geometry, inflow discharge, and position within the reservoir (Matys Grygar et al. Citation2018). The shifts between sample clusters, as seen in the scatter plots, are caused by the differences in the sediment matrix. Therefore, the geochemical composition reflects the change in facies and grain size in the proximal-to-distal direction. The particle size and elemental composition of individual mineral grains is the most important factor in the geochemical composition of bottom sediments (Bouchez et al. Citation2014, Sedláček et al. Citation2017, Matys Grygar et al. Citation2018). It is also influenced by the changing primary productivity within the reservoir and redox conditions.
Good correspondence was found between MS values and heavy metal concentrations in the uppermost parts of the cores, with a positive correlation, especially for Zn and Cu (R2 higher than 0.75), suggesting that both are related to anthropogenic pollution. This positive correlation, also found in other studies, is partly caused by the preferential binding of heavy metals to fly-ash particles and other minerals, such as phyllosilicates, with higher MS values (Sedláček et al. Citation2013). Heavy metal concentrations vary because of facies and grain-size changes as shown by the lower concentrations of Pb, Cu, and Zn in the coarse-grained layers having a possible flood origin. Cu, Pb, and Zn show a very similar depth pattern, suggesting the same source. Considering the agricultural nature of the catchment, the source of modern pollution is likely due to the long-term use of fertilizers and pesticides (non-point source) in former Czechoslovakia (e.g. Komárek et al. Citation2008, Uprety et al. Citation2009). Several authors pointed out the increased Cu and Zn contents in the upper soil layers due to various agricultural activities worldwide (e.g. De la Torre et al. Citation2000, Pederson et al. Citation2002, Novak et al. Citation2004). This source has also been identified as a major source of pollution in the Nové Mlýny reservoir (Sedláček et al. Citation2017). However, the elevated heavy metal levels were also found in deeper layers, probably associated with the sulfide polymetallic mineralization and historical mining in the Lichnov and Horní Benešov mining districts (Műcke et al. Citation2013).
Heavy metal concentrations were also measured with respect to the possible effect of erosion of reservoir sediments on the downstream reaches of the Čížina River. Some portion of the deposited contaminated sediment was resuspended during the floods and transported towards the dam, indicating higher heavy metal levels in the distal sediments. These higher levels are also related to the more fine-grained nature of the distal sediments and their known ability to sorb heavy metals (Förstner Citation2004). After drawdown and subsequent erosion, such sediments were flushed through the outlet, which could pose some risk to downstream ecosystems (Frémion et al. Citation2016). Therefore, the control of sediment quality should be an important step after the reservoir drawdown. EF depth profiles showed that Cu and Zn were enriched in the Pocheň reservoir sediments, while EF showed high values for Pb even in the older pre-reservoir units, indicating a nearly constant Pb supply. The lowest values were found at the base of the deep cores (Po2), likely representing a regional baseline. The depth profiles of EF were used as an additional stratigraphic tool.
5.6. Processes after reservoir drawdown
Sedimentation processes were replaced by drawdown-enhanced erosion after the reservoir drawdown. Erosion was facilitated by the unconsolidated nature of the reservoir sediments. In addition, erosion is known to be influenced by the grain size. Coarse-grained proximal sediments tend to have low erosion stability while decreasing particle size and increasing cohesiveness lead to a higher sediment stability (Beckers et al. Citation2018). Accordingly, Randle et al. (Citation2015) reported higher levels of erosion following dam removal (on the Elwha River, USA) in non-cohesive, coarse-grained sediments compared to more cohesive fine-grained sediments of the prodelta and lake bed. This may have contributed to temporal channel widening in the middle part of the Pocheň reservoir containing relatively coarse-grained sediments. In addition, channel widening can export a large amount of sediment (Doyle et al. Citation2003). Mass movements such as bank failures have contributed to overall erosion, especially in the middle part of the Pocheň reservoir. According to Wilcox et al. (Citation2014), mass movements deliver the sediment to the channel faster compared to the fluvial erosion processes following the dam breaching (on the White Salmon River, USA). Our results show that the channel tends to form a more natural channel geometry with an anabranching pattern. Randle et al. (Citation2015) described the evolution of the channel planform after dam removal from narrow and sinuous to wide and braided to narrower and incised through time. However, erosion is also influenced by the river gradient between the inflow and outflow of the dam, and the tendency to incise. The temporary drawdown channel flows in a different position than the old pre-reservoir channel, whose structure is not visible on the exposed bottom, indicating that it is filled with sediment. Thus, the temporary channel has formed a new thalweg that is different from its original position before the construction of the reservoir.
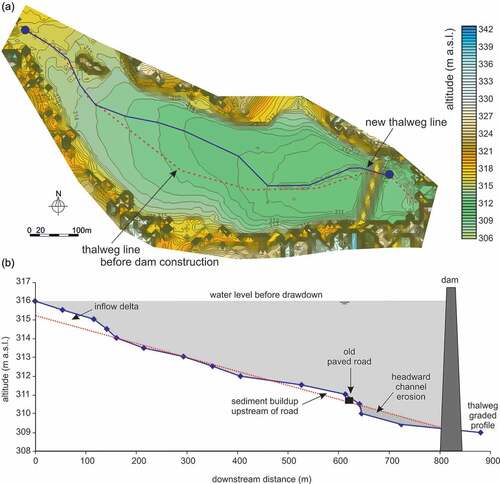
The two-dimensional contour map (), created using Surfer software, shows the elevations after the reservoir was drained with the location of the new thalweg, used to construct the river graded profile. The cross-section along the thalweg grade profile () shows the sediment accumulation that forms the inflow delta body and, in particular, the sediment accumulation upstream of the old paved road, that crosses the reservoir in its central part. The tendency for incision and headward erosion downstream of this road is evident. This means that considerable erosion has taken place, especially along the thalweg. It also shows that base-level fall (in reservoir sediments) is a relatively fast process, even under low discharge conditions. The flow velocity and the bed shear stress decelerated downstream, which contributed to lateral erosion near the inflow and in the middle part of the reservoir. Moreover, the rate of erosion is proportional to the average inflow velocity, which can be influenced by flood events having greater discharges available, with more erosive energy (Kondolf et al. Citation2014b). This process could also be effective in some small reservoirs such as Pocheň. The Čížina River tends to return to its original graded profile by the headward erosion and lowering of the erosion base.
Figure 10. (a) Digital elevation model of the Pocheň reservoir after drawdown, with the position of the former (dashed red line) and current thalweg (solid blue line); (b) longitudinal profiles of the thalweg showing zones with sediment accumulation and erosion.
6. Conclusions
Our results can be applied to the evaluation of processes in other, similar small reservoirs. It can be assumed that the problem of sediment removal from small reservoirs will increase in the next few decades due to their aging, particularly in Europe. The methods used have proven to be good tools for documenting sedimentation and erosion processes. Using a combination of methods is important, especially with respect to identifying the onset of reservoir sedimentation, sediment properties and thickness. In general, the sedimentation pattern is specific to small reservoirs such as Pocheň, having simple geometry. The low lithological contrast between pre-reservoir and reservoir units is the result of low inflow discharge.
We identified three main sedimentation stages. After the initial filling, most sediments accumulated in the proximal parts of the Pocheň reservoir, closer to the inflow. In later years, sediments focused on more distal sites (downstream) near the dam, because of downstream accretion. Given the limited accommodation space, small reservoirs are prone to rapid infilling, especially when combined with high trap efficiency. In small reservoirs, flood events can contribute to a significant reduction in storage capacity, such as the 1996 flood that resulted in the erosion of proximal sediments and their relocation to distal parts of the reservoir. This implies that flood discharges could dramatically decrease the lifespan of small reservoirs. Sediment thickness increases in the proximal-to-distal direction, as well as from the reservoir margins to its centre.
SARs are closely connected to trap efficiency. Soft reservoir sediments are prone to quick erosion during low water levels and during drawdowns. Among the important factors affecting the erosion rate on the exposed bottom of small reservoirs are mainly sediment texture (grain size), sediment thickness, and the geometry of the reservoir. In this case, maximum erosion occurs along the drawdown channel and consists of incision and lateral erosion of soft reservoir sediments. Even small reservoirs, located in relatively agricultural catchments, can pose a problem in terms of potential contamination, for example due to historical mining or long-term use of fertilizers and pesticides.
Disclosure statement
No potential conflict of interest was reported by the authors.
Additional information
Funding
References
- Appleby, P.G., 2001. Chronostratigraphic techniques in recent sediments. In: W.M. Last and J. Smol, eds. Tracking environmental change using lake sediments. Dordrecht: Kluwer Academic Publisher, 171–203.
- Araújo, J.C., Güntner, A., and Bronstert, A., 2006. Loss of reservoir volume by sediment deposition and its impact on water availability in semiarid Brazil. Hydrological Sciences Journal, 51 (1), 157–170. doi:10.1623/hysj.51.1.157
- Arnason, J.G. and Fletcher, B.A., 2003. A 40C year record of Cd, Hg, Pb, and U deposition in sediments of Patroon Reservoir, Albany County, NY, USA. Environmental Pollution, 123, 383–391. doi:10.1016/S0269-7491(03)00015-0
- Audry, S., et al., 2004. Fifty-year sedimentary record of heavy metal pollution (Cd, Zn, Cu, Pb) in the Lot River reservoirs (France). Environmental Pollution, 132, 413–426. doi:10.1016/j.envpol.2004.05.025
- Bábek, O., et al., 2020. Reservoir deltas and their role in pollutant distribution in valley-type dam reservoirs: les Království Dam, Elbe River, Czech Republic. Catena, 184, 104251. doi:10.1016/j.catena.2019.104251
- Bábek, O., et al., 2021. Historical pond systems as long-term composite archives of anthropogenic contamination in the Vrchlice River, Czechia. Anthropocene, 33, 100283. doi:10.1016/j.ancene.2021.100283
- Beckers, F., Haun, S., and Noack, M., 2018. Experimental investigation of reservoir sediments. In: A. Paquier, ed. River Flow 2018 - Ninth International Conference on Fluvial Hydraulics, Lyon-Villeurbanne: E3S Web of Conferences, 40, 03030.
- Beneš, V., 2016. VN Pocheň. Určení objemu rybničních sedimentů. Praha: G IMPULS Praha, spol. s r.o.
- Birth, G., 2003. A scheme for assessing human impacts on coastal aquatic environments using sediments. In: C.D. Woodcoffe and R.A. Furness, eds. Coastal GIS 2003. Wollongong: Wollongong University Papers in Center for Maritime Policy, 14.
- Bladé Castellet, E., et al., 2019. Computation modelling of fine sediment relocation within a dam reservoir by means of artificial flood generation in a reservoir cascade. Water Resources Research, 55, 3156–3170. doi:10.1029/2018WR024434
- Bouchez, J., et al., 2014. Source, transport and fluxes of Amazon River particulate organic carbon: insights from river sediment depth-profiles. Geochimica et Cosmochimica Acta, 133, 280–298. doi:10.1016/j.gca.2014.02.032
- Brandt, S.A., 2000. Classification of geomorphological effects downstream of dams. Catena, 40, 375–401. doi:10.1016/S0341-8162(00)00093-X
- Brignoli, M.L., Espa, P., and Batalla, R.J., 2017. Sediment transport below a small alpine reservoir desilted by controlled flushing: field assessment and one-dimensional numerical simulation. Journal of Soils and Sediments, 17 (8), 2187–2201. doi:10.1007/s11368-017-1661-0
- Carvalho, N.O., et al., 2000. Reservoir sedimentation assessment guideline. Brasilia: Brazilian Electricity Regulatory Agency.
- Chen, C.W., et al., 2007. Distribution and accumulation of heavy metals in the sediments of Kaohsiung Harbor, Taiwan. Chemosphere, 66 (8), 1431–1440. doi:10.1016/j.chemosphere.2006.09.030
- De la Torre, A.I., et al., 2000. Ecotoxicological evaluation of pig slurry. Chemosphere, 4, 1629–1635. doi:10.1016/S0045-6535(00)00038-2
- Dendy, F.E., 1974. Sediment trap efficiency of a small reservoir. Journal of Soil and Water Conservation, 39 (4), 278–280.
- Doyle, M.W., Stanley, E.H., and Harbor, J.M., 2003. Channel adjustments following two dam removals in Wisconsin. Water Resources Research, 39, 1011. doi:10.1029/2002WR001714
- Dypvik, H. and Harris, N.B., 2001. Geochemical facies analysis of fine grained siliciclastics using Th/U, Zr/Rb and (Zr+Rb)/Sr ratios. Chemical Geology, 181, 131–146. doi:10.1016/S0009-2541(01)00278-9
- Espa, P., et al., 2019. Tackling reservoir siltation by controlled sediment flushing: impact on downstream fauna and related management issues. Plos One, 14 (6), e0218822. doi:10.1371/journal.pone.0218822
- Evans, A.D., et al., 2022. UAV and structure-from-motion photogrammetry enhance river restoration monitoring: a Dam Removal Study. Drones, 6, 100. doi:10.3390/drones6050100
- Förstner, U., 2004. Sediment dynamics and pollutant mobility in rivers: an interdisciplinary approach. Lake and Reservoir Management, 9, 25–40. doi:10.1111/j.1440-1770.2004.00231.x
- Foster, I.D.L. et al., 1998. Mineral magnetic characterization of sediment sources from an analysis of lake and floodplain sediments in the catchments of the Old Mill reservoir and Slapton Ley, South Devon, UK. Earth Surface Processes and Landforms, 23, 685–703. doi:10.1002/(SICI)1096-9837(199808)23:8<685:AID-ESP873>3.0.CO;2-8
- Frémion, F., et al., 2016. Impact of sediments resuspension on metal solubilization and water quality during recurrent reservoir sluicing management. Science of the Total Environment, 562, 201–215. doi:10.1016/j.scitotenv.2016.03.178
- Grygar, T., et al., 2010. Geochemical tools for the stratigraphic correlation of floodplain deposits of the Morava River in Strážnické Pomoraví, Czech Republic from the last millennium. Catena, 80, 106–121. doi:10.1016/j.catena.2009.09.005
- Guillén-Ludeña, S., Manso, P., and Schleiss, A., 2018. Multidecadal sediment balance modelling of a cascade of alpine reservoirs and perspectives based on climate warming. Water, 10 (12), 1759. doi:10.3390/w10121759
- Heim, S., et al., 2004. Geochronology of antropogenic pollutants in riparian wetland sediments of the Lippe river (Germany). Organic Geochemistry, 35, 1409–1425. doi:10.1016/S0146-6380(04)00121-4
- Komárek, M., et al., 2008. Copper contamination of vineyard soils from small wine producers: a case study from the Czech Republic. Geoderma, 147, 16–22.
- Kondolf, G.M., et al., 2014b. Sustainable sediment management in reservoirs and regulated rivers: Experiences from five continents. Earth’s Future, 2, 256–280. doi:10.1002/2013EF000184
- Kondolf, G.M., Rubin, Z.K., and Minear, J.T., 2014a. Dams on the Mekong: cumulative sediment starvation. Water Resources Research, 50 (6), 5158–5169. doi:10.1002/2013WR014651
- Kylander, M.E., et al., 2011. High-resolution X-ray fluorescence core scanning analysis of Les Echets (France) sedimentary sequence: new insights from chemical proxies. Journal of Quaternary Science, 26 (1), 109–117. doi:10.1002/jqs.1438
- López, P., et al., 2016. Sediment size distribution and composition in a reservoir affected by severe water level fluctuations. Science of the Total Environment, 540, 158–167. doi:10.1016/j.scitotenv.2015.06.033
- Mahmood, K., 1987. Reservoir sedimentation: impact, extent and mitigation. Washington D.C.: World Bank, Technical Paper No. 71.
- Manso, P., et al. 2018. Evolution of reservoir flushing and emptying practices in a cascade of large reservoirs across several decades. Conference: Hydro 2018 - progress through partnerships, Gdansk.
- Matys Grygar, T., et al., 2018. Changes in the geochemistry of fluvial sediments after dam construction (the Chrudimka River, the Czech Republic). Applied Geochemistry, 98, 94–108. doi:10.1016/j.apgeochem.2018.09.012
- McLennan, S.M., 2001. Relationships between the trace element composition of sedimentary rocks and upper continental crust. Geochemistry, Geophysics, Geosystems, 2, 2000GC000109. doi:10.1029/2000GC000109
- Moorman, B.J., 2001. Ground-penetrating radar applications in paleolimnology. In: W.M. Last and J.P. Smol, eds. Tracking environmental change using lake sediments - Volume 1: basin analysis, coring, and chronological techniques (Developments in paleoenvironmental research). Dordrecht: Kluwer Academic Publisher, 23–47.
- Morris, G.L. and Fan, J., 1997. Reservoir sedimentation handbook, design and management of dams, reservoirs, and watersheds for sustainable use. New York: McGraw-Hill.
- Mücke, A. et al., 2013. The Horní Benešov ore deposit in the Devonian Šternberk-Horní Benešov Belt, Jeseníky Mts, Czech Republic. Part II: Fe-ore occurrences. Acta Musei Silesiae, Scientiae Naturales, 62, 215–254. doi:10.2478/cszma-2013-0023
- Müller, J., et al., 2000. Reservoir sediments – a witness of mining and industrial development (Malter Reservoir, eastern Erzgebirge, Germany). Environmental Geology, 39, 1341–1351. doi:10.1007/s002540000117
- Novak, J.M., Watts, D.W., and Stoke, K.C., 2004. Copper and zinc accumulation, profile distribution and crop removal in coastal plain soils receiving long-term intensive applications of swine manure. Transactions of the American Society of Agricultural Engineers, 47, 1513–1522. doi:10.13031/2013.17631
- Pacina, J., et al., 2020. Dynamics of sediments in reservoir inflows: a case study of the Skalka and Nechranice reservoirs, Czech Republic. International Journal of Geo-Information, 9, 258. doi:10.3390/ijgi9040258
- Pagliari, D., et al., 2017. Measuring the volume of flushed sediments in a reservoir using multi-temporal images acquired with UAS. Geomatics, Natural Hazards and Risk, 8 (1), 150–166. doi:10.1080/19475705.2016.1188423
- Pederson, G.A., Brink, G.E., and Fairbrother, T.E., 2002. Nutrient uptake in plant parts of sixteen forages fertilized with poultry litter: nitrogen, phosphorus, potassium, copper and zinc. Journal of Agronomy, 94, 895–904.
- Pique, G., et al., 2017. The fluvial sediment budget of a dammed river (upper Muga, southern Pyrenees). Geomorphology, 293, 211–226. doi:10.1016/j.geomorph.2017.05.018
- Randle, T.J., et al., 2015. Large-scale dam removal on the Elwha River, Washington, USA: erosion of reservoir sediment. Geomorphology, 246, 709–728. doi:10.1016/j.geomorph.2014.12.045
- Romero-Díaz, A., Alonso-Sarriá, F., and Martínez-Lloris, M., 2007. Erosion rates obtained from check-dam sedimentation (SE Spain). A multi-method comparison. Catena, 71, 172–178. doi:10.1016/j.catena.2006.05.011
- Schmengler, A.C. and Vlek, P.L.G., 2015. Assessment of accumulation rates in small reservoirs by core analysis, Cs-137 measurements and bathymetric mapping in Burkina Faso. Earth Surface Processes and Landforms, 40, 1951–1963. doi:10.1002/esp.3772
- Schüttrumpf, H. and Detering, M., 2011. Innovative sediment handling to restore reservoir capacity. In: A.J. Schleiss and R.M. Boes, eds. Dams and reservoirs under changing challenges. London: Taylor & Francis, 345–352.
- Sedláček, J., et al., 2022. A closer look at sedimentation processes in two dam reservoirs. Journal of Hydrology, 605, 127397. doi:10.1016/j.jhydrol.2021.127397
- Sedláček, J., Bábek, O., and Grygar, T., 2013. Trends and evolution of contamination in a well dated water reservoir sedimentary archive: The Brno Dam, Moravia, Czech Republic. Environmental Earth Sciences, 69, 2581–2593. doi:10.1007/s12665-012-2089-x
- Sedláček, J., Bábek, O., and Kielar, O., 2016. Sediment accumulation rates and high-resolution stratigraphy of recent fluvial suspension deposits in various fluvial settings, Morava River catchment area, Czech Republic. Geomorphology, 254, 73–87. doi:10.1016/j.geomorph.2015.11.011
- Sedláček, J., Bábek, O., and Nováková, T., 2017. Sedimentary record and anthropogenic pollution of a complex, multiple source fed dam reservoirs: an example from the Nové Mlýny reservoir Czech Republic. Science of the Total Environment, 574, 1456–1471. doi:10.1016/j.scitotenv.2016.08.127
- Shotbolt, L., Thomas, A.D., and Hutchinson, S.M., 2005. The use of reservoir sediments as environmental archives of catchment inputs and atmospheric pollution. Progress in Physical Geography, 29 (3), 337–361. doi:10.1191/0309133305pp452ra
- Uprety, D., et al., 2009. Concentration of trace elements in arable soil after long-term application of organic and inorganic fertilizers. Nutrient Cycling in Agroecosystems, 85, 241–252. doi:10.1007/s10705-009-9263-x
- Verstraeten, G. and Poesen, J., 2000. Estimating trap efficiency of small reservoirs and ponds: methods and implications for the assessment of sediment yield. Progress in Physical Geography, 24 (2), 219–251. doi:10.1177/030913330002400204
- Viseras, C., et al., 2009. Dynamics of sedimentary environments in the accelerated siltation of a reservoir: the case of Alhama de Granada, southern Spain. Environmental Geology, 56, 1353–1369. doi:10.1007/s00254-008-1231-2
- Walling, E.D., Owens, P.N., and Graham Leeks, J.L., 1999. Rates of contemporary overbank sedimentation and sediment storage on the floodplains of the main channel systems of the Yorkshire Ouse and River Tweed, UK. Hydrological Processes, 13, 993–1009. doi:10.1002/(SICI)1099-1085(199905)13:7<993::AID-HYP786>3.0.CO;2-C
- Wilcox, A.C., O’Connor, J.E., and Major, J.J., 2014. Rapid reservoir erosion, hyperconcentrated flow, and downstream deposition triggered by breaching of 38 m tall Condit Dam, White Salmon River, Washington. Journal of Geophysical Research: Earth Surface, 119. doi:10.1002/2014JF003135
- Wildi, W., et al., 2004. River, reservoir and lake sediment contamination by heavy metals downstream from urban areas of Switzerland. Lake and Reservoir Management, 9, 75–87. doi:10.1111/j.1440-1770.2004.00236.x
- Wisser, D., et al., 2013. Beyond peak reservoir storage? A global estimate of declining water storage capacity in large reservoirs. Water Resources Research, 49, 5732–5739. doi:10.1002/wrcr.20452