
 ?Mathematical formulae have been encoded as MathML and are displayed in this HTML version using MathJax in order to improve their display. Uncheck the box to turn MathJax off. This feature requires Javascript. Click on a formula to zoom.
ABSTRACT
Drought is often monitored through standardized indices. However, while enabling comparisons across different climatic regions, standardization poses an issue when using indices to assess future climate change impacts on drought, since they have a null average by definition. To address this issue, in this study we introduce a dynamic approach where future changes are assessed by computing climate normals using moving time windows. The approach is applied to Sicily and Calabria (Southern Italy) using the standardized precipitation index (SPI) and the standardized precipitation–evapotranspiration index (SPEI), and considering climate change scenarios RCP4.5 and RCP8.5. An optimized ensemble weighted average (OEWA) of climate models is introduced to reduce model biases. The results indicate that the region is likely to experience an increase in drought events due to climate change. The findings highlight the need for revised drought identification strategies that account for non-stationarity in climate.
Editor A. Castellarin; Guest Editor Félix Francés
1 Introduction
Drought is one of the most complex natural hazards due to a wide variety of related causes and both direct and indirect impacts (Naumann et al. Citation2015). Being a recurrent feature of climate, it occurs in many areas of the globe but with different characteristics from region to region, with harmful consequences for local water supply systems and industrial and agricultural production, as well as on the environment, with particular reference to the degradation of aquatic ecosystems (Cancelliere and Salas Citation2010, Bonaccorso et al. Citation2012, Bonaccorso et al. Citation2013, Monteleone et al. Citation2020, Citation2022).
According to a recent report by the WWF (Citation2019), an average of 55 million people globally are affected by droughts every year. Furthermore, drought is the biggest threat to livestock and crops almost everywhere in the world. Moreover, following climate model projections, droughts are likely to intensify in magnitude and severity globally and last longer in the 21st century, under the forcing factor of climate change (Sheffield and Wood Citation2008, Dai Citation2011, Citation2013, Cook et al. Citation2014, Citation2015, Trenberth et al. Citation2014, Touma et al. Citation2015, Schwalm et al. Citation2017, Haile et al. Citation2020). In this context, the Mediterranean region is recognized as one of the major hot spots of climate change due to future projections of temperature increase and annual precipitation decrease (Giorgi Citation2006, Senatore et al. Citation2011, Kjellström et al. Citation2013). In this area, a potential increase in the intensity and frequency of extreme drought events is expected (Iglesias et al. Citation2007, Hoerling et al. Citation2012, Forzieri et al. Citation2014, Marcos-Garcia et al. Citation2017, Paparrizos et al. Citation2018), especially during summer (Vicente-Serrano et al. Citation2010b), with significant environmental and socio-economic impacts (Blenkinsop and Fowler Citation2007).
Considering lessons learned from past experiences of coping with severe drought events and the potential intensification of such phenomena in the future, a common awareness has risen about the need to develop and implement advanced drought risk management strategies. To this end, combined global–regional climate models (briefly, climate models, CMs) can play a crucial role in developing future drought scenarios for planning purposes (Mendicino and Versace Citation2007, Hart and Halden Citation2019). Such scenarios will support stakeholders in selecting the best measures for adaptation to climate change to minimize the impacts on society and the environment at the regional scale.
A few studies have attempted to use CMs in combination with standardized drought indices – typically the standardized precipitation index (SPI, Mckee et al. Citation1993) and the standardized precipitation–evapotranspiration index (SPEI, Vicente-Serrano et al. 2010) – to assess possible future impacts of climate change on drought (Touma et al. Citation2015, Gaitán et al. Citation2020, Haile et al. Citation2020, Saharwardi and Kumar Citation2021). Standardized indices have the advantage of allowing for the comparison of drought conditions across different regions with varying climates. However, assessing the impacts of climate change based on the statistics of these drought indices presents a challenge in that the index’s expected value is zero by design. To address this issue, the aforementioned studies compute possible future values of the index based on the distribution parameters of the aggregated underlying variables (e.g. precipitation for SPI and precipitation minus reference evapotranspiration for SPEI) from historical periods. However, this “traditional approach” does not account for the need to adapt drought identification criteria to a non-stationary climate. In this work, we propose a “dynamic approach” to assess the impacts of climate change on drought. Specifically, we compute the standardized drought index of interest for a future target period using the distribution parameters of the base variables calibrated on a moving 30-year period.
Another critical issue that deserves to be mentioned is that so far, global climate models reproduce temperature patterns reasonably well, whereas large-scale precipitation patterns are poorly simulated (IPCC Citation2014). Consequently, drought projections and the impacts of climatic change on drought characteristics at the regional level in the future show great uncertainty (Burke and Brown Citation2008). This is particularly true in areas with high precipitation variability, such as the Mediterranean, and consistent with a recent study by Peres et al. (Citation2020), who compared the skill of 19 EURO-CORDEX CMs in reproducing the annual and seasonal temperature and precipitation regime and several drought features observed in the period 1971–2000 in a dense network of raingauges in Sicily and Calabria (southern Italy). They found that the best models for simulating precipitation perform well also for drought features, but the models are not equally suitable for temperature.
Capitalizing on the previous study by Peres et al. (Citation2020), an optimized weighted ensemble average (OWEA) of selected Euro-CORDEX CMs is built. Specifically, the weighting scheme moves forward from previous studies (Coppola et al. Citation2010, Senatore et al. Citation2019) by an optimization procedure adopted to refine the weight attribution to minimize a combined precipitation–temperature normalized error metric. Finally, SPI and SPEI are computed with traditional and dynamic approaches in order to understand the importance of a non-stationary calibration of drought indices for the identification of climate change impacts. Besides, the assessment provides some additional quantitative insights on the possible future impacts of climate change on drought in Sicily and Calabria.
2 Study area and data
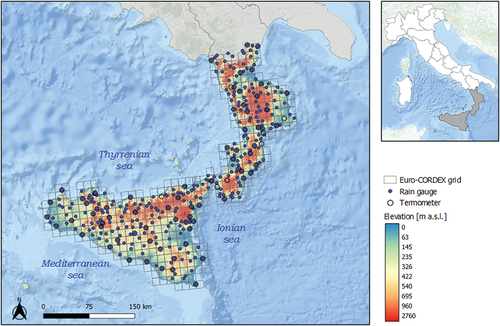
The Calabrian peninsula and the Sicilian island correspond to the southernmost administrative regions of Italy (). They wedge in the middle of the Mediterranean Sea and are divided by a narrow strait approximately 3 km wide. Their total extension equals 40 540 km2, 37% of which belongs to Calabria and 63% to Sicily. The climate is generally of the Mediterranean type, with hot and dry summers and wet, not very cold winters. However, the complex orography characterizing these regions (only 9% and 14% of Calabria and Sicily are occupied by plains, and the highest peaks reach 2267 m a.s.l. and 3357 m a.s.l., respectively), combined with the significant influence of the surrounding sea, cause a fairly complex variability of the local climate. The historical stations considered by Peres et al. (Citation2020) recorded annual average temperature values from 9.2 to 20.6°C (with station elevations from 2 to 1295 m a.s.l.) and annual accumulated precipitation values from 373 to 1736 mm (station elevations from 1 to 1369 m a.s.l.). The climate features often favour drought conditions, particularly damaging in the hottest months (Mendicino et al. Citation2008, Rossi and Benedini Citation2020), which are envisaged to be augmented in future.
Figure 1. Map presenting the study area, the Euro-CORDEX grid, and the raingauges and thermometers used to assess model errors in reproducing climate statistics for the control period (1971–2000). Many of the temperature records are available at the same location as the raingauges.
In what follows, the evaluation of future climate scenarios is based on EURO-CORDEX CMs. In particular, 0.11° resolution data, corresponding to about 11 km, of temperature near the surface (standard name: TAS) and precipitation rate (PR) are used. In Peres et al. (Citation2020), 19 CMs have been ranked for quality, based on the comparison of historical CM simulations with detailed observational data in the control period (1971–2000). In that study, rankings per variable (temperature, precipitation, and drought characteristics) and a global ranking were derived. Based on those rankings, we selected the models providing satisfactory performances in simulating both precipitation and temperature while neglecting the remaining ones, deemed to not represent the climate adequately. Specifically, the selected models are those indicated in .
Table 1. Five most accurate Euro-CORDEX climate models for the study area.
3 Methodology
3.1 Optimized ensemble average
When a set of climate models is considered, the impacts of climate change on a phenomenon of interest can be synthesized using ensemble averages. The simplest way is to consider the arithmetic mean of the single model outcomes – a method referred to as “simple averaging.” An enhanced approach consists of weighting the models as a function of their reliability, which can be estimated from the comparison of observational records with the historical simulations of the CMs. In this study, a model-weighting approach based on that developed by Coppola et al. (Citation2010) is used to compute the ensemble mean values of the CM simulations. In particular, this approach is based on the following five performance indicators, to be computed for each model:
where P and T represent seasonally (DJF, MAM, JJA, SON) averaged precipitation and temperature, with subscripts CM and obs indicating simulated and observed data respectively; denotes the coefficient of correlation between observed and simulated mean values calculated for each season and over a region of interest; RMSE indicates the root mean square error; and
is a measure of the observed inter-annual variability. To obtain
, the mean values of observed precipitation or temperature at each grid point and for each season of each year of the selected time period are first calculated. This seasonal time series is then used to compute the inter-annual standard deviation at each grid point, which is then averaged over all grid points in the domain of interest to yield
. If the RMSE is lower than the observed inter-annual variability of the same variable (used as a measure of observation uncertainty) in EquationEquations (3)
(3)
(3) and (Equation4
(4)
(4) ), the values of g3 and g4 are set to 1 (i.e. the model reaches maximum performance in that metric). In other words, is utilized as a scaling metric to produce a non-dimensional value. The last function (EquationEquation 5
(5)
(5) ) assesses the models’ capacity to mimic the spatial correlation between precipitation and temperature signals, with ρ having the same meaning as in g1 and g2 but now measuring the spatial correlation between temperature and precipitation. The specific functional form of g5 produces values between 0 and 1.
The weight for each RCM is given by:
where wi is the weight for the ith RCM, and the exponents αj (with j = 1, 2, … 5) are set so as to consider different combinations of the performance indicators described below. The weighted mean value of a variable (temperature or precipitation) obtained from the ensemble of models is given by:
where Xi is the value of the variable (temperature or precipitation) for the ith model. Following Senatore et al. (Citation2019), we have analysed different combinations of g1–g5, as shown in .
Table 2. Predetermined combinations of error metric exponents for weight calculations.
In combination 1, all of the g1–g5 error metrics are employed; in combination 2, the function g5 is disregarded; and in combination 3, functions g1 and g2 contribute more to the weight than the others. Finally, only precipitation-based or temperature-based performance indicators are used in combinations 4 and 5. The performance of the various combinations is tested using combined precipitation–temperature RMSE normalized with respect to the standard deviation of each variable:
where the WE subscript stands for the weighted ensemble. One of the advantages of the metric is that the normalization makes it independent of the units used for temperature.
Then an OEWA is built by optimizing the exponents, constrained to the range 0 ≤ αj ≤ 2, in terms of minimization of the combined error metric E. Moreover, the performances of the various combinations of ensemble averages are compared to those of the single CMs, as well as to the simple ensemble average (arithmetic mean, i.e. αj = 0, for j = 1, 2, … 5). The optimization has been carried out using the generalized reduced gradient (GRG) method. This algorithm is a widely used nonlinear optimization method that works by iteratively improving an initial feasible solution until an optimal solution satisfies the specified constraints. The GRG method is well suited for problems with nonlinear objectives and constraints, and can handle both continuous and discrete decision variables.
3.2 Drought indices
Since the 1960s several indices have been proposed for determining the onset, duration and magnitude of drought conditions with respect to normal conditions in various natural and managed systems such as crops, ecosystems, rivers, water resources, etc. Each drought index is generally based on a specific drought definition, according to the scientific field of interest (e.g. meteorology, hydrology, agricultural sciences, and water resources management).
The essential requirements for a reliable drought index are as follows:
• To be representative of the type of drought considered (e.g. meteorological, agricultural, or hydrological);
• To enable the assessment of drought severity based on the historical time series of the variable under investigation;
• To allow for a simple understanding of the phenomenon;
• To be expressed on a standardized scale, to make possible a comparison among droughts occurring in different periods and different climatic regions.
The success of a drought index strongly depends on the availability of suitable data for its calculation. Data can be retrieved from ground weather stations, if available, from reanalysis and/or remote-sensing products (Monteleone et al. Citation2020), and from climate models, as in the present study.
For our applications, the R package SPEI (https://CRAN.R-project.org/package=SPEI) was used to evaluate the two indexes considered in this study, i.e. the SPI and the SPEI.
3.2.1 Standardized precipitation index
The SPI (Mckee et al. Citation1993) is one of the most popular meteorological drought indices, recommended by the World Meteorological Organization (WMO) for monitoring drought conditions since 2009.
The index is based on an equiprobability transformation of aggregated monthly precipitation values into a standard normal variable. In practice, computation of the index requires fitting a probability distribution to aggregated monthly precipitation series (e.g. k = 3, 6, 12, 24 months, etc.), computing the non-exceedance probability related to such aggregated values and defining the corresponding standard normal quantile as the SPI. Mckee et al. (Citation1993) assumed aggregated precipitation series to be gamma distributed and used a maximum likelihood method to estimate the parameters of the distribution. The SPI can interpret the multi-scalar nature of the drought phenomenon by taking into account the different time scales over which water deficits accumulate. In addition, because of its standardization, it is particularly suited to compare drought conditions among different time periods and regions with different climatic conditions.
Usually, a drought begins at an SPI of −1 or less, but there is no standard in place, as some researchers will choose a threshold that is less than 0, but not quite −1, while others will initially classify drought at values less than −1. Although Mckee et al. (Citation1993) originally proposed a classification restricted only to drought periods, it has become customary to use the index to classify wet periods as well.
For additional details on SPI computation, the reader may refer to Edwards and McKee (Citation1997) and Guttman (Citation1999).
3.2.2 Standardized precipitation evapotranspiration index
The SPEI (Vicente-Serrano et al. 2010) uses the same rationale as SPI, but it is built upon the monthly difference D between precipitation and ET0, representing a simple climatic water balance calculated at different time scales. The procedure for calculating SPEI consists of (1) fitting a log-logistic distribution to the aggregated monthly climatic water balance time series, by using unbiased probability-weighted moments (PWMs) for parameter assessment, and then (2) transforming the cumulative probability of the fitted distribution into a standard normal distribution.
The inclusion of monthly temperature data through PET allows the index to account for the impact of temperature on a drought situation. In particular, the inclusion of temperature data in its formulation makes SPEI an ideal index when looking at the impact of climate change on model outputs under various future scenarios. Similar to SPI, SPEI has an intensity scale in which both positive and negative values are calculated, identifying wet and dry events. It can be calculated for time steps of as little as 1 month up to 48 months or more, thus enabling researchers to identify and monitor conditions associated with a variety of drought impacts. The output is applicable for all climate regimes, with the results being comparable because they are standardized.
For the computation of the SPEI index, ET0 has been estimated using the Hargreaves (Citation1994) formula at the monthly time scale, following the FAO 56 paper (Allen and Pereira Citation1998; http://www.fao.org/3/X0490E/X0490E00.htm). In particular, the formula allows us to compute ET0 using mean, minimum and maximum temperature at the daily time scale. We have adapted the formula to use monthly averages of the mentioned temperature variables, as follows:
where ET0 is given in mm, Tmean, Tmax and Tmin (°C) are the monthly averages of daily mean, minimum and maximum temperature, Nd is the number of days in the given month and Ra (mm/day) is extraterrestrial radiation.
For additional details on SPEI computation, the reader may refer to Vicente-Serrano et al. (2010).
3.3 Static versus dynamic approach for assessing climate change impacts from drought indices
The traditional (static) approach for assessing the impacts of future climate change on drought using standardized indices relies on using the parameters of the underlying variables’ probability distributions computed from data during a control period (in our case, 1971–2000). This approach assumes that drought identification criteria remain insensitive to any non-stationarities caused by climate change. Although this approach is still useful, it emphasizes the impacts of climate change by assuming that drought should be identified assuming stationary reference conditions in local climatology (mainly, for our purposes, precipitation and temperature). From the stakeholders’ point of view, drought index values calculated in future scenarios using a fixed control period make sense only if no adaptation strategies are implemented (since no deviation from stationary conditions is expected). To remove the dependence of drought index value calculation on a stationary (current) climate, parameter estimation can be carried out by calibrating on a moving control period, resulting in dynamic drought identification criteria, as illustrated in .
Figure 2. Sketch illustrating the traditional (static) approach versus the proposed dynamic approach for assessing the impacts of climate change on droughts based on standardized indices. The sketch refers to 1971–2000 as the control period and 2041–2070 as future periods, but it is valid for other periods also. It should be noted that reference periods belong entirely to historical or to future scenario periods, as mixed historical–future scenario periods are non-stationary by definition and climate normals cannot be defined.
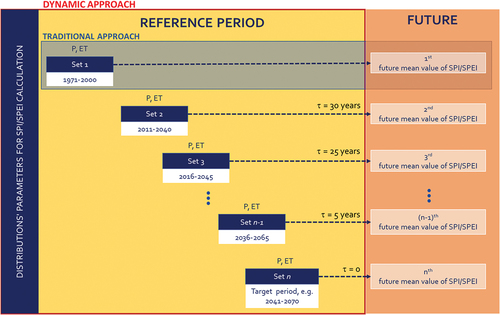
This approach allows us to express the rate of response to climate change, in terms of the drought index calibration, as a lag time of τ years from the targeted future period. For instance, if the targeted period is 2041–2070, then 2011–2040 is lagged τ = 30 years. The fastest “response rate” corresponds to τ = 0. In this case, the average drought index will be zero (except for minor differences due to sampling variability). Based on the proposed dynamic calibration, the changes in SPI and SPEI will be estimated from the CMs and represented versus the last year of the lag time τ (), considering a 30-year moving window with a 25-year overlap length. In other words, drought indices are recalibrated every five years (this could be, in general, even a different period – shorter or longer). In this way, a curve is obtained whose slope is a measure of the rate of change in the climate conditions. This slope can be considered a proxy of the response rate that the drought-affected systems should have to adapt to the new climate. The dynamic approach is also consistent with WMO Guidelines on the Calculation of Climate Normals (WMO Citation2017), which suggest that reference periods be regularly revisited to consider the non-stationarity of the climate. It should be highlighted that a study by Cammalleri et al. (Citation2022) has confirmed that five-year revisited stationary control periods computed on ERA5 datasets can reproduce the behaviour of non-stationary SPI at the European level.
4 Results and discussion
4.1 Ensemble averaging
allows us to assess the reliability of various combinations of the five CMs considered in this study. In particular, the table shows the RMSE and the bias computed across all the grid cells of the study area for the annual average of mean air temperature (RMSET and BiasT, respectively) and accumulated annual precipitation (RMSEP and BiasP) for the control period (1971–2000). The quality of the models in the control period is assumed to indicate the quality of the projections for a given climate scenario (RCP). The five CMs alone perform quite differently in terms of RMSE and bias of precipitation and temperature, as well as of the combined error metric E. Since all models persistently underestimate temperature, RMSE and bias information about their performances are largely superimposable, with Had-CCLM being the best (−1.2 and 1.6°C for bias and RMSE, respectively) and ECE-RCA4 the worst (−3.4 and 3.5°C, respectively). For precipitation, there is also a general trend for underestimation. Still, one model slightly overestimates (ECE-RCA4, but with the highest RMSE), and another is almost unbiased (Had-RACM, which also has the second-best RMSE value). The errors found are consistent with those detected in other studies (Kotlarski et al. Citation2014, Mascaro et al. Citation2018, Peres et al. Citation2020), with the most reliable models globally being ECE-CCLM and Had-CCLM, whereas ECE-RCA4 shows by far the worst performances (combined error metric E). The arithmetic mean (simple ensemble mean) provides a general improvement in the quality of climate reconstruction. However, it is not yet convenient compared to ECE-CCLM, for which a higher combined rate is observed. The weighted averages provide better reconstructions of the climate; however, only the E value of combination 4 overcomes ECE-CCLM. A further, although slight, improvement is obtained by optimally tuning the weighting exponents (i.e. with OEWA). It is worth noting that temperature-based error metrics g2 and g4 do not contribute to the OEWA, i.e. temperature has a minor role in the optimization.
Table 3. Errors in climate reproduction by single climate models and their combinations.
The forthcoming analyses will show the results relative to this optimal combination.
4.2 Impacts of climate change on precipitation, temperature and reference evapotranspiration
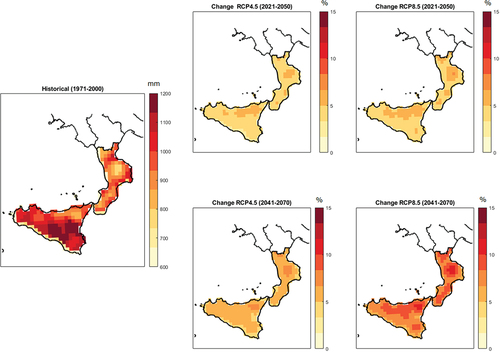
Changes in precipitation, temperature and ET0 have been summarized for Sicily, Calabria and the entire area consisting of the two regions (). For all projection periods, RCP scenarios and investigated areas, low or even null precipitation decreases are projected. For the near future (2021–2050), precipitation decrease is more marked in Sicily and with RCP4.5 (down to −5%). In Calabria, with RCP8.5, no reduction is projected. For the far future (2041–2070), RCP8.5 projects a slightly more pronounced decrease but never below −6% (in Sicily). The predicted temperature increase is almost the same for Sicily and Calabria and is higher in RCP8.5 than RCP4.5, especially in the far future. Reference evapotranspiration, being strongly related to temperature, follows a similar trend, with significant changes predicted for the future (about 50 mm in the near future and up to 82 mm for the period 2041–2070 with RCP8.5).
Table 4. Spatially averaged changes (∆) and relative climate model uncertainty (weighted standard deviation) of mean annual precipitation, temperature and reference evapotranspiration for Sicily, Calabria and the entire study area.
The table also shows climate model uncertainty, computed as the weighted standard deviation of the single model variations (weights from the OEWA). As can be observed, the dispersion of the changes projected by the different climate models is significant, especially for precipitation, where the weighted standard deviation exceeds the change in some cases – this occurs mainly for the RCP8.5 (2021–2050) scenario and Calabria (Senatore et al. Citation2022). To further elaborate on these results, we have analysed the monthly () and spatial distribution () of changes.
Figure 3. Monthly variations of precipitation and reference evapotranspiration (OWEA and single CMs). Temperature variations are qualitatively similar to those of evapotranspiration, and thus are not shown.
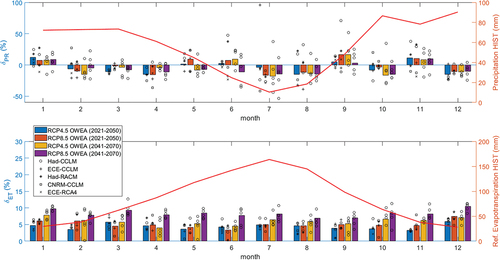
Figure 4. Projected changes in mean annual precipitation.
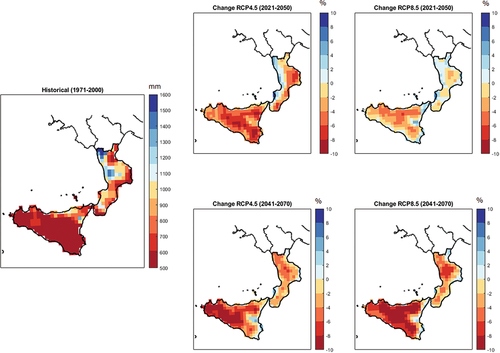
Figure 5. Projected changes in mean annual temperature.
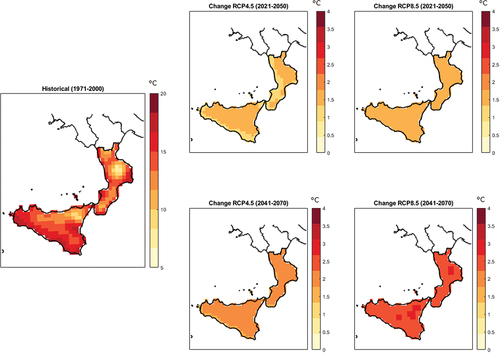
Figure 6. Projected changes in mean annual reference evapotranspiration.
The direction of changes in precipitation, ∆PR, varies within the year. Precipitation is expected to show a marked decrease in October, December, February, March and April, while in the summer season prevalently, precipitation is projected to slightly decrease. In September, November and January, precipitation increases are projected. At the annual scale, this is reflected in a slight decrease in precipitation for most of the scenarios. Regarding the scenarios, consistently with the annual time scale, it can be seen that for the period 2021–2050, RCP4.5 may imply greater variations than those of RCP8.5. However, the way the changes are distributed at a monthly scale may imply a significant change in the seasonality of future precipitation regimes. Changes in ET0 are very regular and proportional to monthly values (i.e. higher in summer than in winter). Single-CM variations are also shown, with different markers. Again, single models can provide very different results (with opposite signs, even). This further corroborates the importance of using ensemble averages that properly weight the CMs based on their reliability.
As can be seen from , the spatial distribution of the changes highlights that the most significant decrease of precipitation occurs in the inland area (up to about −100 mm), which roughly corresponds to the mountainous areas, while along the coast a moderate increase in precipitation is projected (especially for Calabria and eastern Sicily).
Spatial patterns of temperature changes () generally project a higher increase in temperature in the inland area with respect to the coastal areas. Changes in ET0 () follow a similar pattern of temperature, but the contrast between coastal areas and inland is more pronounced. The spatial concordance between precipitation decrease and temperature increase can produce higher impacts of droughts in the inland as compared to the coastal areas, which is an aspect that cannot be evidenced with the previous spatially aggregated information.
4.3 Impacts of climate change on droughts – statistical approach
The optimal CM combination was used to obtain projected SPEI and SPI indices for the near future (2021–2050) and the far future (2041–2070). show the variation of the SPI and the SPEI, respectively, relative to three aggregation time scales (k), namely 3, 6, and 12 months. Projected changes in terms of algebraic difference concerning the RCM data in the control period (1971–2000) are shown for the two different RCPs (4.5 and 8.5).
Figure 7. Projected changes in SPI at increasing time aggregation scales for different scenarios and future periods.
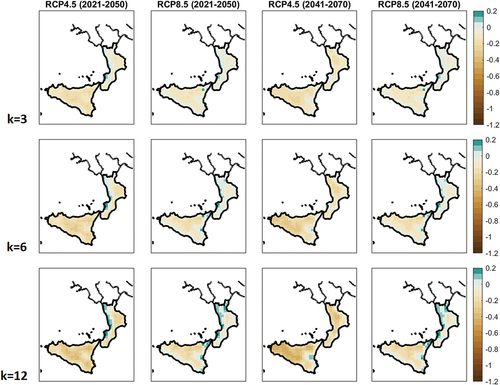
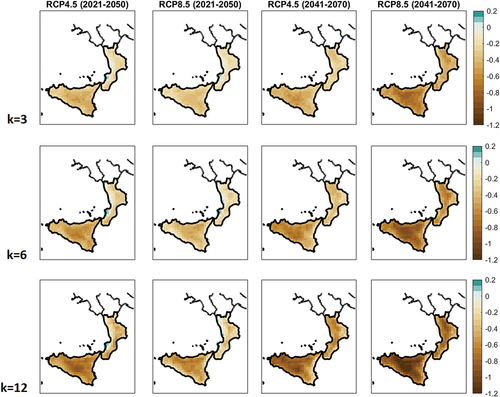
Figure 8. Projected changes in SPEI at increasing time aggregation scales for different scenarios and future periods.
Regarding SPI, variations increase with the aggregation time scale. The most significant variations in the near future (2021–2050) are observed for RCP4.5 rather than for RCP8.5. This result was somewhat expected, given the projected precipitation variation shown in . In the far future (2041–2070), instead, the highest impact is projected for RCP8.5, even though for some aggregation time scales (6 and 12 months for Sicily, 12 months considering the whole study area). As summarized in , the maximum change occurs in Sicily in the far future with k = 24 months, reaching −0.46 (RCP8.5).
Table 5. Spatially averaged changes (∆) for the standardized precipitation index in Sicily, Calabria and the entire study area.
The impacts in Sicily are higher than in Calabria. There are no significant projected changes in SPI in the latter region in the near future for the RCP4.5 scenario, even though the maps in do not show a homogeneous behaviour. Specifically, the western (Tyrrhenian) areas in Calabria and the eastern (Ionian) areas in Sicily tend to be wetter.
The dynamics of SPI are, obviously, closely related to those of precipitation. This index does not consider the projected changes in temperature and, in turn, evapotranspiration. Regarding the SPEI, which allows overcoming this drawback of SPI, the impacts of climate change on droughts become more significant and proportional to the emissions implemented in the RCPs (). The spatial variation of SPEI changes is similar to that for SPI, although biased towards negative values. The magnitude of changes is amplified; for instance, average changes with SPEI24 (RCP8.5, 2021–2050) may be as low as – 1.24 and – 1.01, in Sicily and Calabria, respectively (). The most remarkable differences between the two periods are found with the scenario RCP8.5, while with RCP4.5 the changes in the two periods are comparable, except for the 24-month aggregation. This result agrees with , which shows a particularly remarkable increase in temperature with RCP8.5 in the far future.
Table 6. Spatially averaged changes for the standardized precipitation and evapotranspiration index in Sicily, Calabria and the entire study area.
4.4 Impacts of climate change on droughts – dynamic approach
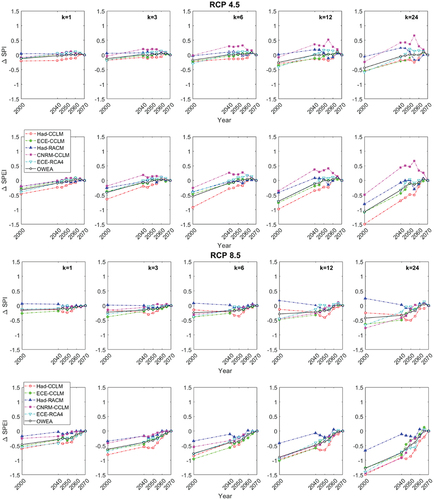
The results presented in the previous subsection were based on the assumption that drought conditions in future climate change scenarios would be identified with reference to the climate normals of the historical control period. This can be interpreted as a conservative assumption since index calculation reflects static reference climate conditions, and therefore an absence of adaptation to climate change from the systems affected by drought. illustrates the change of SPI and SPEI across the entire analysed region for the targeted future period 2041–2070 under RCP4.5 and RCP8.5 scenarios. The graph shows the effects of calibrating the indices on different 30-year data samples, with the time window moving at intervals of five years, beginning from 2011–2040. Plots consider various aggregation time scales k of the drought indices. Again, as can be observed, changes increase with k. The range of changes given by CMs can be quite wide. Firstly, the plots show how the “traditional” approach is very conservative. The curves are almost monotonically increasing, even though some slight deviations from such behaviour can occur in some cases, especially in the far future (2070). These behaviours indicate a continuous progression towards drier mean conditions. Usually, the changes in SPI and SPEI decrease as the calibration period gets closer to the reference future period, even with a significant lag τ. For instance, in the worst situation (SPEI at k = 12 months and future scenario RCP8.5), the traditional approach indicates a variation of −1.23, which decreases to −0.74 with a calibration period lagged τ = 30 years (2011–2040) from the future target period. However, this highlights at the same time the importance of implementing adaptation measures.
Figure 9. Plots showing the change in the average values of SPI and SPEI on moving time windows (x-axis represents the end year of the calibration period) and different time aggregations k (in months) for the whole investigated area (Calabria and Sicily).
5 Discussion
Changes in drought are foreseen to be mainly related to temperature (hence, ETo), whose projected increase is significantly higher during the hot summer months (). On the other hand, consistent with previous studies (e.g. Zittis et al. Citation2019, Senatore et al. Citation2022), both monthly and annual precipitation projections pinpoint weaker trends in space () and time (). Specifically, the overall wetting trends in western Calabria and eastern Sicily are mostly related to the interaction of the local morphology with the wetter atmosphere fuelled by a warmer sea, which results in increased orographic precipitation (e.g. Bonaccorso and Aronica Citation2016, Senatore et al. Citation2020). Further studies, possibly supported by convection-permitting climate simulations, will investigate how much the increased precipitation detected at the local scale depends on short and highly intense events. Contrastingly, inland Sicily shows more significant impacts of climate change on droughts, with the homogeneous temperature increase coupled with a further decrease of the already scarce precipitation. This climate evolution may also have substantial consequences on desertification, an ongoing process according to several studies (Gao and Giorgi Citation2008, Autorità di bacino del distretto idrografico della Sicilia Citation2019). It is noteworthy that the very localized trends found in sub-zones of the study area are gathered thanks to the high-resolution models used in this study, which help unravel the projection uncertainties typical of the Mediterranean region (Tuel and Eltahir Citation2020).
Future possible impacts of climate change on drought have been identified by both a static (traditional) and a dynamic approach. The traditional approach leads to conservative results, as it does not reflect possible adaptation measures that will be implemented within drought-affected systems. The dynamic approach allows us, in principle, to reduce this issue, as it allows us to understand how the implementation of adaptation measures can reduce climate change impacts.
As a matter of fact, the different temperature, ETo and precipitation trends lead to the identification of much clearer future drought trends with SPEI than SPI, thanks to the capability of the former index to adequately consider climate warming. This result is consistent with several examples where SPEI trends are more well defined than those of SPI, e.g. Touma et al. (Citation2015) in a global analysis, Haile et al. (Citation2020) in Eastern Africa, Saharwardi and Kumar (Citation2021) in India, and Gaitán et al. (Citation2020) in the Mediterranean region (Aragon, Spain). SPEI was also used as a better impact predictor than SPI in the European and Mediterranean regions (Stagge et al. Citation2015). Furthermore, some studies on catchments within the study area, which use more complex approaches based on hydrological modelling (requiring both precipitation and ETo as input data), highlighted water resource reductions not explainable considering the weak precipitation trends only. Using RCP4.5, Senatore et al. (Citation2022) projected a significant average decrease in the largest Calabrian river basin (Crati) for root zone soil moisture, groundwater storage, and streamflow (down to −19% for the latter variable) at the end of the 21st century. Pumo et al. (Citation2016) estimated a substantial reduction in the mean annual streamflow in some small intermittent Sicilian catchments using RCP4.5 and RCP8.5. With the same RCPs, Peres et al. (Citation2019) predicted a significant decrease in the performance of the Pozzillo Reservoir in Sicily. Another interesting feature emerging from this study is the increasing strength of the positive or negative trends of drought indices with more extended cumulative periods (increasing k). Such behaviour is well known theoretically: on longer time scales, the autoregressive component of the index is enhanced (e.g. Vicente-Serrano et al. Citation2019, Gaitán et al. Citation2020). However, the link of the index time scale to the scale length of the main hydrological processes highlights the main risks for the study area. Typically, longer SPI and SPEI time scales are related to groundwater and reservoir storage. Mendicino et al. (Citation2008) showed that different SPI time scales (but never lower than six months) could be connected to other hydrogeological properties of the basin.
Climate change projections were analysed considering two reference scenarios. Schwalm et al. (Citation2020) highlight that total cumulative CO2 emissions for the International Energy Agency scenarios are between these two pathways. Indeed, the issue of the most reliable climate scenario is much debated, with some scientists rejecting the worst path (i.e. reflecting an additional radiative forcing of 8.5 W m−2 in 2100) as highly unlikely. This debate will continue with the adoption of the Shared Socioeconomic Pathways (SSPs; Riahi et al. Citation2017), used in the last IPCC AR (IPCC Citation2021). Nevertheless, in 2021–2050, the SPI and SPEI projected with RCPs 4.5 and 8.5 are comparable, consistently with the emission scenarios associated with those pathways, which diverge later in the future.
Climate projection models provide a wide range of results that can also indicate different directions of change. For practical purposes, it is important to present unambiguous results, which at the same time should be accompanied by uncertainty statistics – whose values can sometimes be on the same order of magnitude as the estimated change.
For this reason, in this study, we have made an effort to improve model weighting techniques to reduce the uncertainty of the results. Although the weighting procedure itself represents a source of uncertainty (e.g. Christensen et al. Citation2010), also given the strong assumptions behind it (Räisänen and Ylhäisi Citation2012), it has been argued that it could be particularly beneficial with proper CM selection (Senatore et al. Citation2019). The OEWA allows relying on one robust reference scenario for a given future period and RCP, providing clearer and sharper indications to environmental managers and stakeholders.
6 Conclusions
A reliable assessment of climate change impacts on drought patterns under different climate scenarios is essential to properly address and manage the risk of future drought events. In this study, we have investigated meteorological drought scenarios in Southern Italy (Sicily and Calabria regions) based on both a static and a dynamic approach in the calibration of the standardized drought indices SPI and SPEI. Projections of the five best-performing CMs from the EURO-CORDEX initiative have been used. Both the single and various multi-model ensembles have been considered to assess future changes in drought characteristics in the near term (2021–2050) and the far future (2041–2070) under RCPs 4.5 and 8.5. Ensembles in the form of “simple averages” and following different model-weighted schemes, also including an optimized ensemble weighted average (OEWA), have been implemented and compared using various error metrics. Then, single and combined models were used to assess the possible future impacts of climate change on critical hydro-meteorological variables (precipitation, temperature and ET0) and drought.
The main findings are summarized as follows:
Concerning the model skill in reproducing annual precipitation and mean temperature in the control period, the individual models usually show larger errors in comparison to the multi-model ensembles, mainly for precipitation. Had-CCLM remains the most reliable model for temperature, while the OEWA performs much better than the single models and slightly better than the other multi-model ensembles in reducing the precipitation RMSE (thus proving to be more efficient in reproducing the dry and wet precipitation phases) and minimizing the combined precipitation–temperature normalized error metric.
Climate change impacts on temperature and ET0 values obtained by the optimized weighted ensemble scheme for the future scenarios have revealed a similar increase in Sicily and Calabria for the same RCP and future time period. As regards precipitation, a generally slight decrease was observed with minor discrepancies between the two regions mainly for mid-century and RCP8.5 scenarios. However, CM models may present uncertainties of the same magnitude as projected changes.
Regarding the climate change impacts on droughts computed at different aggregation time scales, although SPI and SPEI display mainly an increase in drought conditions in the future, results significantly differ with the selected index, with generally larger impacts described by SPEI compared to SPI. This difference stems from the fact that while SPI only considers precipitation, SPEI is based on the water balance, with evapotranspiration playing a relevant role in the warming climate due to the increased evaporative demand. Regardless of the index, the rate of change increases as the aggregation time scale k increases, suggesting larger variations in the underlying probability distributions in future scenarios. The area most affected by intense drought periods will be inland Sicily, already recognized to be at risk of desertification.
Comparison of the traditional and proposed dynamic approaches in the calibration of the standardized drought indices has demonstrated the importance of using climate normals that reflect the possibility to implement climate change adaptation measures. Specifically, even a slow adaptation rate can significantly reduce climate change’s impacts on droughts.
The proposed methodology allows a better quantification of climate change impacts on drought occurrence and intensity. Specific outcomes for Calabria and Sicily may help and encourage policymakers and water managers to develop and implement appropriate adaptation strategies and increase the resilience of water infrastructures. To this aim, a further development of the present study may be the analysis of indices that reflect crop conditions.
Author contributions
Conceptualization: DJP, BB, AS; methodology: DJP, BB, AS; software: DJP, NP; formal analysis: DJP, NP; investigation: DJP, BB, NP, AS; resources: all authors; writing: DJP, NP, BB, AS; writing – review and editing: DJP, BB, AS; visualization: DJP, NP; supervision: DJP, AC, GM, BB, AS; project administration; DJP, AC, GM, BB, AS; funding acquisition: DJP, AC, GM, BB, AS.
References
- Allen, R.G. and Pereira, L.S., 1998. Crop Evapotranspiration (guidelines for computing crop water requirements) - FAO Irrigation and drainage paper 56. Rome: FAO. Food and Agriculture Organization of the United Nations.
- Autorità di bacino del distretto idrografico della Sicilia, 2019. Strategia regionale di azione per la lotta alla desertificazione (in Italian). Available from: http://pti.regione.sicilia.it/portal/page/portal/PIR_PORTALE/PIR_LaStrutturaRegionale/PIR_PresidenzadellaRegione/PIR_AutoritaBacino/PIR_Areetematiche/PIR_sitiTematici/PIR_Desertificazione/Strategia%2Bregionale%2Blotta%2Bdesertificazione_def_0.pdf.
- Blenkinsop, S. and Fowler, H.J., 2007. Changes in European drought characteristics projected by the PRUDENCE regional climate models. International Journal of Climatology, 27 (12), 1595–1610. doi:10.1002/JOC.1538
- Bonaccorso, B., et al., 2013. Large scale probabilistic drought characterization over Europe. Water Resources Management, 27 (6), 1675–1692. doi:10.1007/s11269-012-0177-z
- Bonaccorso, B. and Aronica, G.T., 2016. Estimating temporal changes in extreme rainfall in sicily region (Italy). Water Resources Management, 30 (15), 5651–5670. doi:10.1007/s11269-016-1442-3
- Bonaccorso, B., Cancelliere, A., and Rossi, G., 2012. Methods for drought analysis and forecasting. In: N. Balakrishnan, ed. Methods and Applications of Statistics in the Atmospheric and Earth Sciences. Hoboken: John Wiley and Sons, 150–184.
- Burke, E.J. and Brown, S.J., 2008. Evaluating uncertainties in the projection of future drought. Journal of Hydrometeorology, 9 (2), 292–299. doi:10.1175/2007JHM929.1
- Cammalleri, C., et al., 2022. The effects of non-stationarity on SPI for operational drought monitoring in Europe. International Journal of Climatology, 42 (6), 3418–3430. doi:10.1002/joc.7424
- Cancelliere, A. and Salas, J., 2010. Drought probabilities and return period for annual streamflows series. Journal of Hydrology, 391 (1–2), 77–89. doi:10.1016/j.jhydrol.2010.07.008
- Christensen, J.H., et al., 2010. Weight assignment in regional climate models. Climate Research, 44 (2–3), 179–194. doi:10.3354/CR00916
- Cook, B.I., et al., 2014. Global warming and 21st-century drying. Climate Dynamics, 43 (9–10), 2607–2627. doi:10.1007/S00382-014-2075-Y
- Cook, B.I., Ault, T.R., and Smerdon, J.E., 2015. Unprecedented 21st century drought risk in the American Southwest and Central Plains. Science Advances, 1 (1). doi:10.1126/SCIADV.1400082/SUPPL_FILE/1400082_SM.PDF
- Coppola, E., et al., 2010. Model weighting based on mesoscale structures in precipitation and temperature in an ensemble of regional climate models. Climate Research, 44 (2–3), 121–134. doi:10.3354/CR00940
- Dai, A., 2011. Drought under global warming: a review. Wiley Interdisciplinary Reviews: Climate Change, 2 (1), 45–65. doi:10.1002/WCC.81
- Dai, A., 2013. Increasing drought under global warming in observations and models. Nature Climate Change 2012, 3(1), 52–58. doi:10.1038/nclimate1633
- Edwards, D.C. and McKee, T.B., 1997. Department of atmospheric science. Weather - soundings. Climatology Report No. 97-2, 634. Available from: http://weather.uwyo.edu/upperair/sounding.html.
- Forzieri, G., et al., 2014. Ensemble projections of future streamflow droughts in Europe. Hydrology and Earth System Sciences, 18 (1), 85–108. doi:10.5194/HESS-18-85-2014
- Gaitán, E., et al., 2020. Impact of climate change on drought in Aragon (NE Spain). Science of the Total Environment, 740, 140094. doi:10.1016/J.SCITOTENV.2020.140094
- Gao, X. and Giorgi, F., 2008. Increased aridity in the Mediterranean region under greenhouse gas forcing estimated from high resolution simulations with a regional climate model. Global and Planetary Change, 62 (3–4), 195–209. doi:10.1016/J.GLOPLACHA.2008.02.002
- Giorgi, F., 2006. Climate change hot-spots. Geophysical Research Letters, 33 (8), 8707. doi:10.1029/2006GL025734
- Guttman, N.B., 1999. Accepting the standardized precipitation index: a calculation algorithm. JAWRA Journal of the American Water Resources Association, 35 (2), 311–322. doi:10.1111/J.1752-1688.1999.TB03592.X
- Haile, G.G., et al., 2020. Projected impacts of climate change on drought patterns over East Africa. Earth’s Future, 8 (7), e2020EF001502. doi:10.1029/2020EF001502
- Hargreaves, G.H., 1994. Defining and using reference evapotranspiration. Journal of Irrigation and Drainage Engineering, 120 (6), 1132–1139. doi:10.1061/(ASCE)0733-9437(1994)120:6(1132)
- Hart, O.E. and Halden, R.U., 2019. On the need to integrate uncertainty into U.S. water resource planning. Science of the Total Environment, 691, 1262–1270. doi:10.1016/J.SCITOTENV.2019.07.164
- Hoerling, M., et al., 2012. On the increased frequency of Mediterranean drought. Journal of Climate, 25 (6), 2146–2161. doi:10.1175/JCLI-D-11-00296.1
- Iglesias, A., et al., 2007. Challenges to manage the risk of water scarcity and climate change in the Mediterranean. Water Resources Management 2006, 21(5), 775–788. doi:10.1007/S11269-006-9111-6
- IPCC. 2014 Climate Change 2014: Synthesis Report. Contribution of Working Groups I, II and III to the Fifth Assessment Report of the Intergovernmental Panel on Climate Change. In: R. K. Pachauri and L. A. Meyer, eds. Core Writing Team. Geneva, Switzerland: IPCC, 151.
- IPCC, 2021. Climate change 2021: the physical science basis. Contribution of working group I to the sixth assessment report of the intergovernmental panel on climate change. In: V. Masson-Delmotte, et al., eds. Cambridge, United Kingdom and New York, NY, USA: Cambridge University Press. In press. doi:10.1017/9781009157896
- Kjellström, E., et al., 2013. Emerging regional climate change signals for Europe under varying large-scale circulation conditions. Climate Research, 56 (2), 103–119. doi:10.3354/CR01146
- Kotlarski, S. et al., 2014. Regional climate modeling on European scales: a joint standard evaluation of the EURO-CORDEX RCM ensemble. Geoscientific Model Development, 7, 1297–1333. doi:10.5194/gmd-7-1297-2014
- Marcos-Garcia, P., Lopez-Nicolas, A., and Pulido-Velazquez, M., 2017. Combined use of relative drought indices to analyze climate change impact on meteorological and hydrological droughts in a Mediterranean basin. Journal of Hydrology, 554, 292–305. doi:10.1016/J.JHYDROL.2017.09.028
- Mascaro, G., Viola, F., and Deidda, R., 2018. Evaluation of precipitation from EURO-CORDEX regional climate simulations in a small-scale mediterranean site. Journal of Geophysical Research: Atmospheres, 123 (3), 1604–1625. doi:10.1002/2017JD027463
- Mckee, T.B., Doesken, N.J., and Kleist, J. (1993). The relationship of drought frequency and duration to time scales. Eighth Conference on Applied Climatology, Anaheim, California, 17–22.
- Mendicino, G., Senatore, A., and Versace, P., 2008. A Groundwater Resource Index (GRI) for drought monitoring and forecasting in a Mediterranean climate. Journal of Hydrology, 357 (3–4), 282–302. doi:10.1016/J.JHYDROL.2008.05.005
- Mendicino, G. and Versace, P., 2007. Integrated drought watch system: a case study in Southern Italy. Water Resources Management 2006, 21(8), 1409–1428. doi:10.1007/S11269-006-9091-6
- Monteleone, B. et al., 2022. Developing stage-specific drought vulnerability curves for maize: The case study of the Po River basin. Agricultural Water Management, 269, 107713. doi:10.1016/j.agwat.2022.107713
- Monteleone, B., Bonaccorso, B., and Martina, M., 2020. A joint probabilistic index for objective drought identification: the case study of Haiti. Natural Hazards and Earth System Sciences, 20 (2), 471–487. doi:10.5194/NHESS-20-3057-2020
- Naumann, G., et al., 2015. Assessment of drought damages and their uncertainties in Europe. Environmental Research Letters, 10 (12), 124013. doi:10.1088/1748-9326/10/12/124013
- Paparrizos, S., et al., 2018. Analysis and mapping of present and future drought conditions over Greek areas with different climate conditions. Theoretical and Applied Climatology, 131 (1–2), 259–270. doi:10.1007/S00704-016-1964-X
- Peres, D.J., et al., 2020. Evaluation of EURO-CORDEX (Coordinated regional climate downscaling experiment for the Euro-Mediterranean area) historical simulations by high-quality observational datasets in southern Italy: insights on drought assessment. Natural Hazards and Earth System Sciences, 20 (11), 3057–3082. doi:10.5194/NHESS-20-3057-2020
- Peres, D.J., Modica, R., and Cancelliere, A., 2019. Assessing future impacts of climate change on water supply system performance: application to the Pozzillo Reservoir in Sicily, Italy. Water, 11 (12), 2531. doi:10.3390/W11122531
- Pumo, D., et al., 2016. Climate change effects on the hydrological regime of small non-perennial river basins. The Science of the Total Environment, 542 (Pt A), 76–92. doi:10.1016/J.SCITOTENV.2015.10.109
- Räisänen, J. and Ylhäisi, J.S., 2012. Can model weighting improve probabilistic projections of climate change? Climate Dynamics, 39 (7–8), 1981–1998. doi:10.1007/S00382-011-1217-8
- Riahi, K., et al., 2017. The shared socioeconomic pathways and their energy, land use, and greenhouse gas emissions implications: an overview. Global Environmental Change, 42, 153–168. doi:10.1016/J.GLOENVCHA.2016.05.009
- Rossi, G. and Benedini, M., 2020. Water resources of Italy. Protection, Use and Control. Springer Nature Switzerland.
- Saharwardi, M.S. and Kumar, P., 2021. Future drought changes and associated uncertainty over the homogenous regions of India: a multimodel approach. International Journal of Climatology, 42 (1), 652–670. doi:10.1002/JOC.7265
- Schwalm, C.R., et al., 2017. Global patterns of drought recovery. Nature, 548 (7666), 202–205. doi:10.1038/nature23021
- Schwalm, C.R., Glendon, S., and Duffy, P.B., 2020. RCP8.5 tracks cumulative CO2 emissions. Proceedings of the National Academy of Sciences. 117 (33): 19656–19657. doi:10.1073/pnas.2007117117
- Senatore, A., et al., 2011. Regional climate change projections and hydrological impact analysis for a Mediterranean basin in Southern Italy. Journal of Hydrology, 399 (1–2), 70–92. doi:10.1016/J.JHYDROL.2010.12.035
- Senatore, A., et al., 2019. Climate conditions and drought assessment with the palmer drought severity index in Iran: evaluation of CORDEX South Asia climate projections (2070–2099). Climate Dynamics, 52 (1–2), 865–891. doi:10.1007/S00382-018-4171-X
- Senatore, A., et al., 2020. Reconstructing flood events in Mediterranean Coastal Areas using different reanalyses and high-resolution meteorological models. Journal of Hydrometeorology, 21 (8), 1865–1887. doi:10.1175/JHM-D-19-0270.1
- Senatore, A., et al., 2022. Evaluating the uncertainty of climate model structure and bias correction on the hydrological impact of projected climate change in a Mediterranean catchment. Journal of Hydrology: Regional Studies, 42, 101120. doi:10.1016/J.EJRH.2022.101120
- Sheffield, J. and Wood, E.F., 2008. Projected changes in drought occurrence under future global warming from multi-model, multi-scenario, IPCC AR4 simulations. Climate Dynamics, 31 (1), 79–105. doi:10.1007/S00382-007-0340-Z
- Stagge, J.H., et al., 2015. Modeling drought impact occurrence based on meteorological drought indices in Europe. Journal of Hydrology, 530, 37–50. doi:10.1016/J.JHYDROL.2015.09.039
- Touma, D., et al., 2015. A multi-model and multi-index evaluation of drought characteristics in the 21st century. Journal of Hydrology, 526, 196–207. doi:10.1016/J.JHYDROL.2014.12.011
- Trenberth, K.E., et al., 2014. Global warming and changes in drought. Nature Climate Change, 4 (1), 17–22. doi:10.1038/nclimate2067
- Tuel, A. and Eltahir, E.A.B., 2020. Why is the mediterranean a climate change hot spot? Journal of Climate, 33 (14), 5829–5843. doi:10.1175/JCLI-D-19-0910.1
- Vicente-Serrano, S.M., et al., 2019. Global characterization of hydrological and meteorological droughts under future climate change: the importance of timescales, vegetation-CO2 feedbacks and changes to distribution functions. International Journal of Climatology, 40 (5), 2557–2567. doi:10.1002/JOC.6350
- Vicente-Serrano, S.M., Beguería, S., and López-Moreno, J.I., 2010a. A multiscalar drought index sensitive to global warming: the standardized precipitation evapotranspiration index. Journal of Climate, 23 (7), 1696–1718. doi:10.1175/2009JCLI2909.1
- Vicente-Serrano, S.M., Lasanta, T., and Gracia, C., 2010b. Aridification determines changes in forest growth in Pinus halepensis forests under semiarid Mediterranean climate conditions. Agricultural and Forest Meteorology, 150 (4), 614–628. doi:10.1016/J.AGRFORMET.2010.02.002
- World Meteorological Organization (WMO), 2017. Guidelines on the Calculation of Climate Normals (WMO No. 1203). World Meteorological Organization.
- WWF, 2019. Drought risk. The global thirst for water in the era of climate crisis. Available from: https://d2ouvy59p0dg6k.cloudfront.net/downloads/drought_risk__wwf_.pdf.
- Zittis, G., et al., 2019. A multi-model, multi-scenario, and multi-domain analysis of regional climate projections for the Mediterranean. Regional Environmental Change, 19 (8), 2621–2635. doi:10.1007/S10113-019-01565-W
Acknowledgement
This work was supported by the European Climate, Infrastructure and Environment Executive Agency [LIFE17 CCA/IT/000115 – SimetoRES]; Autorità di bacino regione siciliana [Progetto: “Autorità di Bacino del Distretto Idr]; Università di Catania [Progetto: “Autorità di Bacino del Distretto Idr].
Disclosure statement
No potential conflict of interest was reported by the authors.