
ABSTRACT
Addressing post-fire impacts largely depends on burn “severity.” A singular severity classification that encompasses the holistic effects of fire on all ecosystem processes does not currently exist. Lumping vegetation burn severity and soil burn severity into one metric, or using them interchangeably, can induce large inaccuracies and uncertainties in the intended ecosystem response to forcing. Often, burn “severity” reflects fire impacts on vegetation, which can be measured through remote sensing. Vegetation burn severity is likely more apropos for ecological research, whereas soil burn severity is more relevant for hydrological analyses. This paper reviews different remotely sensed vegetation severity products currently (mis)used for hydrological modeling, provides examples of when vegetation burn severity may (not) match soil burn severity, and summarizes the potential synergistic future of remote sensing with in situ severity metrics. While the focus in this paper is on the western United States, the lessons and principles apply universally.
Editor K. Soulis; Associate Editor (not assigned)
1 Introduction
In the western US, there has been a marked increase in large fire frequency and fire season length within the past 30 years (Westerling et al. Citation2006, Alizadeh et al. Citation2021, Citation2023). This trend is expected to continue, with fires increasing in size and in vegetative burn severity (Singleton Citation2019, Parks and Abatzoglou Citation2020). This has grave ecosystem, societal and infrastructure implications (Modaresi Rad et al. Citation2023), including increasing the magnitude of post-fire erosion and the likelihood of hazardous sediment-charged floods and debris flows (Folton et al. Citation2015, Papadaki et al. Citation2022). Sankey et al. (Citation2017), for example, projected that the increases in fire size alone will lead to at least a 10% increase in erosion rates in 90% of the watersheds in the western US, and over a third may see sediment yield increases greater than 100%. Beside the erosion potential of a landscape, characterizing fire-induced changes in soil and ground surface properties is also key for understanding, and modeling of, infiltration and runoff processes (Lavee et al. Citation1995, Cannon et al. Citation2001, Parsons et al. Citation2010). While the focus of this paper is on the US, dramatic post wildfire impacts to watersheds are not limited to the US, and there are mounting concerns regarding the impact of wildland fire on global water security that are materializing across the world (Nalbantis and Lymperopoulos Citation2012, Semenova et al. Citation2015, Robinne et al. Citation2021). The myriad threats that a post-fire landscape poses has catalyzed an immense volume of research attempting to quantify and forecast the impacts of a severe fire on values-at-risk, which, in the first few years after a fire, is often focused on hydrologic response and erosion (Moody et al. Citation2008, Neary et al. Citation2010, McGuire et al. Citation2016, Vieira et al. Citation2018).
Research regarding wildland fire, and the post-fire landscape, is replete with the terms “high,” “moderate,” or “low” assigned as descriptors of “severity.” However, there is no single definition of fire/burn “severity,” as the application of this metric is highly dependent upon the impacts to the specific biotic or abiotic variables of interest (Cocke et al. Citation2005, Key and Benson Citation2006). The lack of specificity when using the term “severity” has been noted as a fundamental issue in its application (Jain Citation2004, Keeley Citation2009, Yang et al. Citation2021), which can hamper land managers’ decision making and muddy communication about fire effects to the general public. Two widely used severity terms include “vegetation burn severity” and “soil burn severity.” Vegetation burn severity refers to “the degree of scorch on tree trunks and limbs, the amount of vegetation burned, and the percentage of vegetation that is dead,” whereas soil burn severity refers to “the estimated effect of heat transfer from vegetation burning on the surface and the combustion of organic material such as leaves and duff into the upper layers of the soil” (Northwest Fire Science Consortium Citation2015). The use of the term “severity” is not in itself the issue; rather, the main problem is correctly attributing the ecosystem response in question (Key and Benson Citation2006, Keeley Citation2009).
While there are similarities between vegetation and soil burn severity, the effect of a fire on vegetation cannot be assumed to be analogous to the impact of the fire on the soil (Safford et al. Citation2008, Parsons et al. Citation2010). They are both important metrics that help quantify post-fire impacts, but vegetation burn severity is more relevant for ecological studies (i.e. those focused on biological populations or communities), whereas soil burn severity is more relevant in hydrological or other abiotic ecosystem analyses (Moody et al. Citation2016, Ebel and Moody Citation2017). Conventional soil burn severity evaluation requires in situ measurements, which are costly and time consuming (Stroosnijder Citation2005, Fox et al. Citation2008), particularly at larger scales (Batista et al. Citation2019). It has become increasingly common in the hydrologic community to use vegetation burn severity as forcing for post-fire erosion and flooding assessments, as this can be quickly and readily estimated from open-source remote sensing imagery. Misapplication of forcing severity data will introduce additional error into the hydrologic models that are being utilized in post-fire landscape modeling and assessment (Lopes et al. Citation2021). In fact, some research questioned the appropriateness of using vegetation severity for predicting post-fire hydrological processes due to the disconnect between vegetative consumption and actualized soil temperature (Doerr et al. Citation2006).
With the continuation of megafires (typically defined as fires >10 000 ha, but also defined in local terms) in many regions globally (Khorshidi et al. Citation2020), there is an increased pressure to triage millions of burned acres to make decisions on which burned landscapes, or parts of them, should be allotted finite rehabilitation time, money and resources (Robichaud et al. Citation2000). Treatments can be costly and have a narrow window of application (e.g. in the Southwest US early season fires are quickly followed by monsoonal moisture). Here, we argue that the assumption that a high severity fire, as determined by vegetation loss, has matching high severity impacts on soil is tenuous and should be carefully evaluated for surrogacy, particularly for hydrological modeling. The purpose of this paper is: (1) to build upon the literature of fire severity by augmenting it with systematic and anecdotal observations of US wildland fire managers; (2) to reevaluate the concepts of severity and supporting products available, including their limitations; and (3) to propose appropriate uses of severity specifically as applied to post-fire hydrological modeling.
2 Wildland fire terminology
Wildland fires are characterized with a variety of metrics, including intensity and severity, each being associated with differentiating nuances. Fire intensity, for example, has a variety of flavors: radiant intensity (the rate of thermal radiation emission), convective intensity (the entrained gasses and air above the flame) and total fire intensity, which is the summation of all the heat output from the fire. Total fire intensity, also known as Byram’s intensity, can be empirically related to flame length (DeBano et al. Citation1998), giving it field-level applicability and approximation, which is a boon for wildland fire specialists as measurements of the actual thermal output of a fire are rarely if ever collected (although sporadic satellite-based inferred estimates are available, e.g. Sadegh et al. Citation2022). Hence, fire severity, more easily measured by ecological first- and, to a lesser extent, second-order fire effects, has become a more or less universal qualitative metric for categorizing fire. While there is a relationship between fire intensity and fire severity (Keeley Citation2009), it is not direct and can vary across ecosystems. Juxtaposing the two, fire intensity is an expression of the fire behavior, to which flame length, rate of spread and, most notably, thermal output are contributing factors; fire severity is the effect of a fire on vegetative and/or soil properties using the loss or decomposition of organic matter as the metric. In essence, fire intensity could be viewed as the genotype underlying the phenotypic response of fire severity on the landscape.
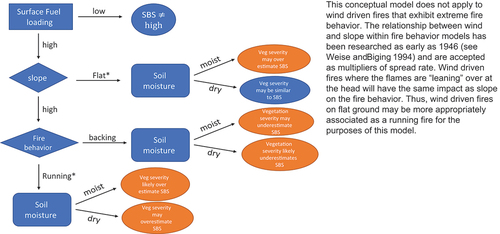
In the case of soil burn severity, post-fire effects are governed not only by the amount of heat (i.e. intensity), but also by the duration the heat is in contact with the soil, referred to as fire residence time (e.g. (Hartford and Frandsen Citation1992, DeBano et al. Citation1998, Parsons and Orlemann Citation2011). For this reason, the soil burn severity, vegetation burn severity, and fire intensity are not likely to be analogous (DeBano et al. Citation1998, Safford et al. Citation2008, Parsons et al. Citation2010, Citation2010, Morgan et al. Citation2014). A rapidly moving fire that primarily burns within the canopy of a forested ecosystem would likely be categorized as a high vegetation severity fire and would release a lot of heat (intensity); but due to a potential lack of fire contact with the ground and its low residence time might be more appropriately labeled as moderate with potential patches of low soil burn severity. This type of response can be observed in wind-driven, fast-moving fires. In contrast, forest fires that primarily burn by backing down heavy loads of ground fuels (i.e. post-logging slash or windthrow) through smoldering combustion with little to no impact on the canopy may be categorized as having low vegetation fire severity, but high soil burn severity. presents a simple conceptual model of fire scenarios and the potential relationship between remotely sensed vegetation burn severity and soil burn severity. Although outside the scope of this paper, soil moisture is considered the most important factor governing heat transfer in soil (Hartford and Frandsen Citation1992) – thorough reviews are available from DeBano (Citation1998) and Van Wagtendonk (Citation2018) – which merits inclusion in the figure.
Figure 1. Relationship between wildfire scenarios and potential vegetation and soil burn severity (SBS) outcomes (Weise and Biging Citation1994).
3 Remote sensing products
Although there is a sound recommendation to keep the metrics of fire severity (soil or vegetation) from being used as the primary/holistic explanatory variable for ecosystem response (Keeley Citation2009), the need to qualify the impacts of burn severity as it relates to hydrologic response is entrenched in the post-fire community of practice. During federal responses to fire, Burned Area Emergency Response (BAER) teams deploy to incidents with the primary objective to rapidly identify post-fire effects and determine whether the fire has created unacceptable risk to human life and safety, property, and critical natural or cultural resources (Parsons et al. Citation2010). Critically important to this mission is the development of a soil burn severity (SBS) map, which serves to rapidly assess the fire’s effects on the ground surface and soil condition. The SBS map is a secondary product based on the validation or reclassification of a burned area reflectance classification (BARC) map, which is a satellite-based product of fire impacts on vegetation. Mapping fire-induced changes in soil and ground surface properties is key for gestalt understanding and subsequent modeling of infiltration, runoff, and the erosion potential of a post-fire landscape (Parsons et al. Citation2010).
3.1 Burned area reflective classification (BARC)
A BARC map uses pre- and post-fire satellite imagery from, most commonly, Landsat or Sentinel platforms and resolves it into classifications of vegetation burn severity. At its core, the values are mostly derived from the changes in short-wave infrared and near-infrared reflectance of a burned landscape. Considerable research has been devoted to nuancing the quantification of these values with the development of various indices, including the normalized burn ratio (NBR), delta or differenced normalized burn ratio (dNBR) and, more recently, relative differenced normalized burn ratio (RdNBR) and relativized burn ratio (RBR) (Miller and Thode Citation2007, Miller et al. Citation2009). As of this publication, dNBR remains the preferred method of US federal land management agencies for the creation of BARC maps when pre-fire imagery is available (Hudak Citation2004a). The resulting product, the BARC-Adjustable, is classified into the four categories of high, moderate, low and unburned by Jenks natural breaks logic (Hudak et al. Citation2004a), which can be refined and adjusted through ground observation if needed. The product is further refined by overlaying the National Land Cover Database vegetation layer to “identify” potentially misclassified severity; a common example is that of grasslands which are often initially classified as “high severity” but are routinely reclassified as moderate or low (Hudak et al. Citation2004b). A similar product derived from the RdNBR is the Rapid Assessment of Vegetation Condition After Wildfire (RAVG) product which utilizes RdNBR indices and regression equations based on field-based metrics. dNBR is an absolute change detection metric, whereas RdNBR is a relative change detection metric. Severity maps derived from dNBR and RdNBR are expected to be rather similar when pre-fire canopy cover is relatively high and homogeneous, but are usually different when there are heterogeneous cover conditions.
Regardless of which mathematical manipulation (i.e. formula) of spectral bands is used to differentiate between pre- and post-fire imagery, it is critical for users to understand how the timing of the image capture affects the utility and ecosystem response interpretation. Although both the Monitoring Trends in Burn Severity mapping products (MTBS) and BARC maps use dNBR, the break points for severity are regularly calibrated on a case-by-case basis, often as a result of an analyst examining the image who may have little knowledge of ground conditions. BARC maps are produced by referencing the temporally closest two images available from before and after the fire, whereas the MTBS database uses an “extended” comparison of the phenology one year after the impact of the fire, which lends to communication of ecological resilience and regrowth. Further, it is important to note that while the term “severity” is commonly utilized in the communication of products (e.g. the USGS Burn Severity portal, which is the data clearing house for federally generated products in the US), practitioners within the post-fire community prefer to communicate results using the term “vegetation mortality” in lieu of severity so as to be more pointed in the products’ utility (see Case Studies section).
3.2 Soil burn severity
The SBS map is the field validation and recalibration of the BARC map to reflect the fire’s effects on the ground surface and soil condition, including char depth and ash, organic matter loss, altered color and structure, and reduced infiltration capacity (DeBano et al. Citation1998, Lentile et al. 2006). The map’s purpose is to predict second-order fire effects such as accelerated risk of erosion, debris flows, flooding, vulnerabilities to recolonization by invasive plant species and impacts on natural regeneration (Calkin et al. Citation2007, Parsons et al. Citation2010). At best, BARC maps can be the preliminary indicator of potential soil erosion hotspots, which is a primary concern of the federal BAER teams (Hudak et al. Citation2007). The field validation or adjustment of the BARC map to produce the SBS map includes:
Measuring the ground cover (effective organic cover as it pertains to mitigation of runoff and erosion and includes litter, duff and woody debris),
Documenting the ash color and depth,
Evaluating the fire’s effect on soil structure,
Evaluating the fire’s effect on root systems, and
Measuring soil water repellency.
Of particular note is the measurement of effective ground cover, which is arguably one of the most important variables governing erosion and runoff (Inbar et al. Citation1998, Benavides-Solorio and MacDonald Citation2005, Parsons et al. Citation2010). summarizes the 2010 Forest Service General Technical Report 243 which is used to guide field measurements of soil burn severity; note that these metrics are difficult to impossible to measure solely from a remote sensing platform. This report also explicitly states that “soil burn severity mapping should never be done solely through the use of remote sensing classifications and without proper field verification” (Parsons et al. Citation2010, p. 4). All in all, the BARC map cannot be considered an SBS map until it has been verified and, if necessary, recalibrated (Hudak et al. Citation2007, Parsons et al. Citation2010).
Table 1. Soil burn severity classification.
Even the SBS map product should not be interpreted as a proxy for or analog of hydrologic response. The SBS map is not a hazard map; it is a key input parameter for models that produce the three main hazard products: erosion response, peak flow response, and debris flow hazard. Soil burn severity must be used in combination with topography, slope, weather, and other factors to arrive at hydrologic or other types of watershed response. One example is that high soil burn severity on flat ground will likely not generate a significant watershed response (Dave Young, personal communication, March 2023).
3.3 Composite Burn Index (CBI)
The Composite Burn Index, developed by Key and Benson (Citation2006), is a protocol designed to correlate and validate Landsat (or other remotely collected) data through field data collection. CBI was developed as a way to evaluate and quantify the effects of fire across multiple strata that have relevance to ecological effects, as remote sensing is biased to detect the change in the upper canopy. Much like remotely sensed data, CBI is not adjusted for different community types; instead, it attempts to synthesize the change from pre-fire conditions. CBI plots are collected over a variety of burns in various ecosystems with the goal of developing statistical confidence in the remote sensing results correlated to field-based measurements, increasing to a point where the need for new ground data should diminish, thus minimizing time and expense for field-based campaigns.
3.4 Case studies: products in practice
Observations by and discussions with post-fire practitioners confirms that remotely sensed vegetation severity mapping can differ substantially from the field-evaluated soil burn severity product.
For example, during the 2020 fire season, Oregon experienced multiple large, fast-moving, wind-driven fires (Abatzoglou et al. Citation2021); however, for nine of these fires the field data collected showed that often the soils were largely intact even when the aboveground vegetation loss was 100%, resulting in substantial reclassification of the high vegetation mortality map products to soil burn severity mapping products with lesser severity (Dorothy Thomas, personal communication, 12 December 2022). Conversely, field reconnaissance within the 2022 Cedar Creek Fire in Oregon noted that remotely sensed vegetation mortality mapping underestimated the extent of low and moderate soil burn severity, with many areas mapped as “unburned” through dNBR exhibiting low soil burn severity from low-intensity burns beneath the intact canopy (and therefore hidden from remote sensing platforms), or moderate soil burn severity where deep duff and litter layers smoldered and were slowly consumed, with long heat residence times. Within the Cedar Creek Fire, the reburn of the 1996 Charlton Fire was mapped as low and exhibiting moderate vegetation mortality; however, the entire footprint exhibited high soil burn severity, as evidenced by total consumption of all vegetation, most heavy ground fuels, surface roots and soil organic matter, including loss of soil structure (Dorothy Thomas, personal communication, 12 December 2022).
juxtapose the soil burn severity product (acquired via the United States Geological Survey [USGS] burn severity portal: https://burnseverity.cr.usgs.gov/) with the RAVG CBI product produced by the United States Forest Service [USFS] Geospatial Technology and Applications Center for two fires in California that burned in 2021. RAVG is a suite of products, among which the CBI was selected for these figures as it is a standardized fire severity rating based on a composite of effects to the understory vegetation (grass, shrub layers), midstory trees and overstory trees (https://burnseverity.cr.usgs.gov/ravg/background-products-applications). RAVG products, initially developed in the USFS Pacific Southwest Region (California), utilize field measurements from the Sierra Nevada and Northern California for the regression equations used to determine the burn severity measures from RdNBR indices. As RAVG imagery is typically not available until around 45 days after a fire, SBS maps are often developed from BARC maps (not shown) which can be produced more quickly (within hours of receiving usable imagery) and are based on dNBR-derived indices.
Figure 2. Comparison of SBS with the remotely sensed Rapid Assessment of Vegetation Condition After Wildfire (RAVG) product for Caldor Fire (California, 2021).
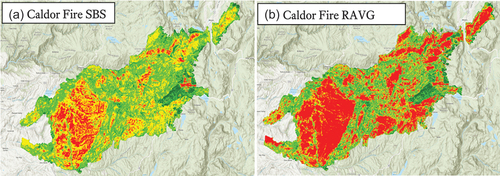
Figure 3. Comparison of SBS with the remotely sensed RAVG product for Dixie Fire (California, 2021).
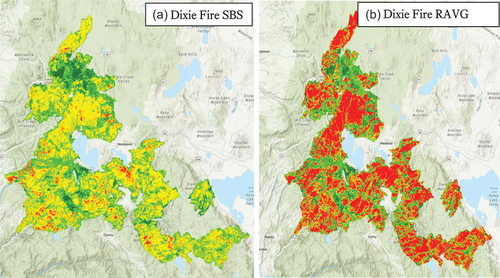
As discussed above, severity products can vary in their manipulation of specific spectral bands (e.g. RdNBR vs. dNBR), the timing of the comparison (e.g. BARC vs. MTBS), and their re-calibration (RAVG), thus producing different final products. Modelers and practitioners should be aware of the nuanced differences between publicly available products prior to using the mapping categories as inputs for hydrologic models.
Both examples show a large expanse of high vegetation burn severity; however, the field-validated SBS map shows a very dissimilar soil burn severity pattern with considerable areas of high vegetation severity classified as moderate soil burn severity. An important consideration is that one of the differentiations between high and moderate severity is the likely preservation of soil structure in the moderately rated soil burn severity category. Also worth noting in the Caldor Fire () is the residual patch of dark green evident in both products in the eastern half of the fire. Interestingly, this difference collocates with the footprint of the Caples prescribed fire, a fuel reduction project, which was implemented two years before the Caldor Fire. Of the many potential mapping products available after a fire, the CBI is calibrated, although only slightly, to include a soil burn severity metric; but, as these figures show, it is still heavily weighted toward vegetation burn severity, and therefore can over- or underestimate the severity of the SBS map product.
4 Increased reliance on remotely sensed data and products
The successful deployment of Landsat-9 greatly increased the amount of remotely sensed data that can be leveraged for use in a multitude of fire metrics (Seydi and Sadegh Citation2023). Together, the quantifiable values of reflectance available from remote sensing platforms and the ever-increasing computational power with which to process this exponentially growing data availability have greatly reduced the subjectivity that can plague severity estimates, effectively addressing Simard’s (Citation1991, p. 16) often cited statement “no two people interpret fire severity the same.” While Rapid Response Research can provide information on the ground that is unattainable by other means (Lentile et al. Citation2007), information derived only from ground campaigns has severe limitations. Post-fire burn severity recalibration (mainly focused on soil, but also including vegetation) is labor intensive and costly (Chuvieco et al. Citation2006, Fox et al. Citation2008), and field surveys can be difficult or dangerous to perform (Morgan et al. Citation2014). Remote sensing coupled with geographic information systems (GIS) technology undoubtedly is the future for quickly ascertaining information about wildland fire at regional to global scales; however, researchers should be cautioned against using solely remote sensing data for burn severity metrics without field verification. The variability of fire behavior and post-fire ecosystem response necessitates refinement of remotely sensed data through ground observation (Key and Benson Citation2006, Parsons et al. Citation2010).
Although the metadata for open-source BARC data warn against using it for anything other than evaluating burned vegetation, a warning that is further substantiated in the literature (Hudak et al. Citation2004b, Safford et al. Citation2008, Parsons and Orlemann Citation2011), requests for BARC maps have increased in recent years. BAER teams have reported multiple misunderstandings of the utility of the BARC maps, primarily driven by private citizens or groups who are typically most concerned about the potential post-fire hydrological effects within their watershed. Even within the academic research community, there is evidence of misapplication of BARC and SBS map products (see Odion and Hanson Citation2006, and the response by Safford et al. Citation2008). Unfortunately, the appropriate information for hydrological modeling (i.e. the SBS map) is not always available. Federal BAER teams are limited in their ability to collect field data points on non-federal lands, so visual estimates of soil burn severity are relied upon to make every effort to create a full SBS map product of the fire regardless of ownership (Cara Farr March, personal communication, 2023). However, for non-federal fires, affected landowners will not benefit from federal BAER teams, leaving those lands without soil burn severity data unless those data can be collected by state or other entities (e.g. California Watershed Emergency Response Teams).
Due to the lack of encompassing soil burn severity data available for a full fire perimeter for every fire in the US, the only open-source data available are burned area reflectance data, which leave users to make assumptions regarding soil effects based solely on remote sensed severity inputs. Currently, there is still no dependable method to remotely sense soil burn severity completely independently of ground-truthed recalibrated measurements. The difficulty lies with the dynamic temporal nature of fire effects on soil (e.g. ash cover is quickly redistributed by wind and water between satellite orbits) (Hudak et al. Citation2004a, Hudak et al. Citation2007), compounded by vegetation and cloud blockage of soil reflectance. Although it could be posited that there is inclusion of bare ground effects (or soil burn severity metrics) in the calculation of dNBR, through the contribution of the shortwave infrared band, the dNBR is more dependably used for vegetation burn severity, and the authors suggest that the bare soil index, or a similar index, be considered as a complementary measure (see Dindaroglu et al. Citation2021).
Further confounding the application of spatially resolved vegetation severity data for first-order soil effects is that the single observed pixel reflection is an amalgamation of potentially diverse actual severities, along with potential influence from neighboring pixels. As a classic example of spatial autocorrelation, a single Landsat pixel is a single 30 x 30 m representation of what might be, in actuality, a heterogeneous burn severity pattern. Therefore, the index of burn severity at the pixel scale is already an oversimplification of fine-scale fire effects in a 30 x 30 m plot (Hudak et al. Citation2007).
4.1 Linking remote sensing to soil burn severity
Although considerable caveats and caution should be employed when making predictions about fire effects using remotely sensed data, the use of satellite imagery is, and will continue to be, a powerful tool for evaluating the post-fire landscape (Lentile et al. 2006, French et al. Citation2008, Szpakowski and Jensen Citation2019) and has the ability to be a cost-effective alternative to field sampling (Veraverbeke and Hook Citation2013, Whitman et al. Citation2018).
It has been generally accepted that high-severity burns often produce greater post-fire erosion than moderate and low burns do (Benavides-Solorio and MacDonald Citation2001, Pierson et al. Citation2015). This ecosystem response is due to an amalgamation of indirect evidence:
Loss of aboveground biomass, potentially exposing more soil to entrainment by overland flow (Moody and Martin Citation2001);
Significant vegetation loss, exposing the soil to raindrop splash effect (Shakesby et al. Citation1993, Fox et al. Citation2007);
Removal of canopy interception and reduction of root network soil stabilization (Miller and Quayle Citation2015, Efthimiou et al. Citation2020);
Loss of soil organic matter, altering the binding capacity of the soil (Hubbert et al. Citation2006).
High-severity burns have also been credited (although without consistency) with the establishment of a hydrophobic layer (Debano and Krammes Citation1966, Doerr et al. Citation2000, Robichaud et al. Citation2000, Lewis et al. Citation2006), which can reduce infiltration capacity and lead to greater overland flow (Debano Citation2000). However, there is also research that suggests or cautions that, over a larger spatial or temporal scale, high-severity fires may have mitigating factors that work to secure soil stability. For example, high-severity fire landscapes in which all the needles on a tree were not consumed may benefit from the subsequent needle cast stabilizing hillslopes, thereby reducing erosion (Pannkuk and Robichaud Citation2003). The impact of high-severity fires on canopy interception, particularly for post-fire precipitation events, is a critical component in the hydrological response of a burned catchment (Stoof et al. Citation2012, Ebel Citation2013) and can be parameterized based on post-fire vegetation severity classifications (e.g. BARC). Thus the art of modeling lies in using the complementary, albeit different, contributions from both vegetation- and soil-derived severity indices.
4.2 Remote sensing for assessing post-fire hydrologic response
Building on some successful case studies supporting the relationship between remotely sensed data and hydrological response, research evaluating the erosion response of a burned watershed using remotely sensed data is also being investigated. Noting that the qualitative values of high, medium and low do not provide sufficient utility for quantifying runoff response, Moody et al. (Citation2008) demonstrated the utility of burn severity derived from dNBR values in predicting peak discharges off the burn scar of the 2000 Cerro Grande Fire.
Contrarily, Saxe et al. (Citation2018) evaluated multiple western US post-fire watershed responses utilizing data from the Monitoring Trends in Burn Severity (MTBS) program and, interestingly, found that only moderate-severity fires were positively correlated with increased post-fire flow response; contrary to expectation, high-severity fires had a negative correlation with the hydrological response. Moreno et al. (Citation2020) also sought to evaluate the utility of NBR for estimating hydrologic response for the 2012 Waldo Canyon Fire, concluding that while there were no direct mathematical relationships relating dNBR to selected hydrological response variables, dNBR generally correlates to hydrological response. However, the authors emphasized the importance of in situ soil measurements and field-validated data for storm-scale hydrological projections.
Vafeidis et al. (Citation2007) suggest high vegetation burn severity, in combination with slope inclination, is likely the most important factor in post-fire erosion modeling. Fox et al. (Citation2008) touted the benefits of satellite imagery for identifying high-severity vegetation burn and likely high erosion potential in lieu of costly and time consuming on-the-ground campaigns, particularly in forest environments where remoteness can hamper accessibility. This need for caution is supported in the literature associated with one of the most common sources of satellite-derived dNBR data, the MTBS Database, where the developers stressed the need for
users of MTBS-generated data to be aware that burn severity products relate primarily to the effects of fire on vegetation biomass, particularly in the upper strata. These products are not intended to be consistent with soil burn severity data produced by the Forest Service and USGS in support of Burned Area Emergency Response (BAER) efforts. (Eidenshink et al. Citation2007, emphasis added)
5 Future research
There are substantial developments in the remote sensing arena that are driving a future where determining the impacts on soil burn severity is not fully reliant upon ground campaigns (Parks et al. Citation2014, Moody et al. Citation2016, Whitman et al. Citation2018). However, the juggernaut of how to determine soil burn severity strictly from a remote sensing platform has not yet fully materialized. Linear spectral unmixing (Lentile et al. Citation2009), hyperspectral analysis (Kokaly et al. Citation2007) and other satellite platforms (e.g. SmallSats) have greatly enhanced the potential for quantifying ecologically linked metrics; however, they have yet to outperform Landsat-based dNBR or RdNBR when validated with field-collected data (Parks et al. Citation2014). Fernández et al. (Citation2021) demonstrated the strength of the differenced Mid-Infrared Burn Index (dMIRBI) in quantifying changes in soil properties after fire, but concluded that further research is necessary. The future of satellite-based radar, and the promise of unmanned arial platforms and increased LiDAR availability, may winnow down the uncertainties associated with purely remotely sensed data.
The future of remote sensing and that of traditional field campaigns are complementary, not mutually exclusive. The availability of increasingly higher resolution (spectral, temporal and spatial) remote-sensing products and rapid advances in machine learning point to a rich research future where, perhaps, to move forward the research community can look backward to identify where remote-sensing imagery can be used as an accurate substitution for ground campaigns to help triage and best assign limited time, money and other resources during post-fire response. Advances in computational spatial analysis may be able to draw out relationships and the relative influence of soil type, weather, vegetation, slope and aspect through comparisons of extensively available soil and vegetation burn severity products.
In a more distant time line, a paradigm of tier-scalable reconnaissance, in which instrument-bearing vehicles operate autonomously, has been advancing within the planetary science community (Fink et al. Citation2007). While it was primarily developed as a means of exploring the solar system, it is also envisioned as an efficient way to gather data in hostile environments on Earth (Wolfgang et al. Citation2017, Brooks et al. Citation2018). The autonomous flights of the Ingenuity Mars Helicopter (Tzanetos et al. Citation2022) demonstrated the technology (Fink et al. Citation2022), and someday, its distant relatives may navigate around flame fronts to gather high-resolution data without requiring any human involvement.
6 Conclusions
Wildland fire activity in the western US is projected to increase in size and severity (Westerling et al. Citation2006, Attiwill and Binkley Citation2013, Singleton Citation2019). The ecological ramifications of this shift span many disciplines, but of most immediate concern are post-fire hydrological impacts, which manifest with the greatest strength in the first few years after a large fire event. Accurate modeling and quantification of the impacts are of paramount importance but are hampered by models that may not be designed with parameterization to account for nuanced post-fire inputs. Further, defaulting to using remote-sensing products based on changes in green reflectance – a vegetation-based burn severity – can greatly over- or underestimate the corresponding severity of the fire impacts on the soil, which is a major governing factor in post-fire hydrological response. Comparisons of vegetation severity products to ground-truthed and recalibrated soil burn severity products demonstrate a need for caution when using vegetation-derived metrics as forcings in hydrological models.
The recent advances of computational power and machine learning could provide a new frontier for post-fire modeling to blend the power of remote sensing with field measurements in evaluating under what conditions and in what environments post-fire vegetation derived metrics may serve as an accurate surrogate for soil severity. Harnessing these advances would greatly improve the accuracy of models; provide critical and timely information for vulnerable populations and infrastructure that do not have the benefit of ground campaigns for field evaluation; and focus finite time, money and resources to areas where ground truthing is necessary.
The purpose of this paper was to provide the burgeoning research community with, as referred to in the wildland fire community, a “tactical pause” to reevaluate the concepts of fire/burn severity, supporting products available, and their limitations, and propose appropriate uses specifically as they apply to post-fire hydrological modeling. Tactical pauses in wildland fire check the momentum of an effort to reassess the changing environment for future development. When properly employed, an operational or tactical pause allows a leader to retain the initiative in the fire environment by temporarily halting operations. This gives the individual a moment to step back, reevaluate, and ensure the operation is still relevant and still meets the objectives, and helps to ensure that participants are clear on strategies and tactics. Researchers on the forefront of developing novel ways to meet the needs of fire and land managers would benefit from reevaluating the momentum, direction, and conclusions coming out of the advances of computational power in tandem with remote sensing capabilities.
Data availability
All data used in this paper are available at https://burnseverity.cr.usgs.gov/.
Acknowledgements
This paper was greatly improved due to communication and suggestions from Dorothy Thomas, Cara Sponaugle, Michele Slaton, David Young, Luke McGuire, and Doug Peters. An anonymous reviewer and the HSJ editor provided very insightful comments which contributed significantly to the final manuscript.
Disclosure statement
No potential conflict of interest was reported by the authors.
Additional information
Funding
References
- Abatzoglou, J.T., et al., 2021. Compound extremes drive the western Oregon wildfires of September 2020. Geophysical Research Letters, 48 (8), e2021GL092520. doi:10.1029/2021GL092520
- Alizadeh, M.R., et al., 2021. Warming enabled upslope advance in western US forest fires. Proceedings of the National Academy of Sciences, 118 (22), e2009717118. doi:10.1073/pnas.2009717118
- Alizadeh, M.R., et al., 2023. Elevation-dependent intensification of fire danger in the western United States. Nature Communications, 14 (1), 1773. doi:10.1038/s41467-023-37311-4
- Attiwill, P. and Binkley, D., 2013. Exploring the mega-fire reality: a ‘Forest Ecology and Management’ conference. Forest Ecology and Management, 294, 1–3. doi:10.1016/J.FORECO.2012.12.025
- Batista, P.V.G. et al., 2019. On the evaluation of soil erosion models: are we doing enough? Earth Science Review, 197 (June). doi 10.1016/j.earscirev.2019.102898
- Benavides-Solorio, J. and MacDonald, L.H., 2001. Post-fire runoff and erosion from simulated rainfall on small plots, Colorado Front Range. Hydrological Processes, 15 (15), 2931–2952. doi:10.1002/hyp.383
- Benavides-Solorio, J.D.D. and MacDonald, L.H., 2005. Measurement and prediction of post-fire erosion at the hillslope scale, Colorado Front Range. International Journal of Wildland Fire, 14 (4), 457–474. doi:10.1071/WF05042
- Brooks, A.J.-W., Fink, W., and Tarbell, M., 2018. An adaptive hierarchical approach to lidar-based autonomous robotic navigation. Orlando, Florida: SPIE.
- Calkin, D.E., et al., 2007. Assessing post-fire values-at-risk with a new calculation tool. USDA Forest Service - General Technical Report RMRS-GTR, (205 RMRS-GTR), 1–32.
- Cannon, S.H., Kirkham, R.M., and Parise, M., 2001. Wildfire-related debris-flow initiation processes, Storm King Mountain, Colorado. Geomorphology, 39 (3–4), 171–188. doi:10.1016/S0169-555X(00)00108-2
- Chuvieco, E., et al., 2006. Use of a radiative transfer model to simulate the postfire spectral response to burn severity. Journal of Geophysical Research: Biogeosciences, 111 (4), 4–09. doi:10.1029/2005JG000143
- Cocke, A.E., Fulé, P.Z., and Crouse, J.E., 2005. Comparison of burn severity assessments using differenced normalized burn ratio and ground data. International Journal of Wildland Fire, 14 (2), 189–198. doi:10.1071/WF04010
- Debano, L.F., 2000. The role of fire and soil heating on water repellency in wildland environments: a review. Journal of Hydrology, 231–232, 195–206. doi:10.1016/S0022-1694(00)00194-3
- Debano, L.F. and Krammes, J.S., 1966. Water repellent soils and their relation to wildfire temperatures. International Association of Scientific Hydrology. Bulletin, 11 (2), 14–19. doi:10.1080/02626666609493457
- DeBano, L.F., Neary, D.G., and Ffolliott, P.F., 1998. Fire effects on ecosystems. New York: John Wiley & Sons.
- Dindaroglu, T., et al., 2021. Evaluation of geomorphometric characteristics and soil properties after a wildfire using Sentinel-2 MSI imagery for future fire-safe forest. Fire Safety Journal, 122, 103318. doi:10.1016/j.firesaf.2021.103318
- Doerr, S.H., et al., 2006. Effects of differing wildfire severities on soil wettability and implications for hydrological response. Journal of Hydrology, 319 (1–4), 295–311. doi:10.1016/j.jhydrol.2005.06.038
- Doerr, S.H., Shakesby, R.A., and Walsh, R.P.D., 2000. Soil water repellency: its causes, characteristics and hydro-geomorphological significance. Earth Science Reviews, 51 (1–4), 33–65. doi:10.1016/S0012-8252(00)00011-8
- Ebel, B.A., 2013. Wildfire and aspect effects on hydrologic states after the 2010 Fourmile Canyon Fire. Vadose Zone Journal, 12 (1), 1–19. doi:10.2136/vzj2012.0089
- Ebel, B.A. and Moody, J.A., 2017. Synthesis of soil-hydraulic properties and infiltration timescales in wildfire-affected soils. Hydrological Processes, 31 (2), 324–340. doi:10.1002/hyp.10998
- Efthimiou, N., Psomiadis, E., and Panagos, P., 2020. Fire severity and soil erosion susceptibility mapping using multi-temporal Earth observation data: the case of Mati fatal wildfire in Eastern Attica, Greece. Catena, 187 (October), 104320. doi:10.1016/j.catena.2019.104320
- Eidenshink, J.et al., 2007. A project for monitoring trends in burn severity. Fire Ecology, 3 (1), 3–21. doi:10.4996/fireecology.0301003
- Fernández, C., et al., 2021. Exploring the use of spectral indices to assess alterations in soil properties in pine stands affected by crown fire in Spain. Fire Ecology, 17 (2). doi:10.1186/s42408-020-00089-7
- Fink, W., et al., 2007. Tier-scalable reconnaissance missions for the autonomous exploration of planetary bodies. In: 2007 IEEE Aerospace Conference, Big Sky, Montana, United States, 1–10.
- Fink, W., et al., 2022. 20 years of tier-scalable reconnaissance: adoption of a game-changing mission paradigm. In: 2022 IEEE Aerospace Conference (AERO), Big Sky, Montana, United States, 1–13.
- Folton, N., Andréassian, V., and Duperray, R., 2015. Hydrological impact of forest-fire from paired-catchment and rainfall–runoff modelling perspectives. Hydrological Sciences Journal, 60 (7–8), 1213–1224. doi:10.1080/02626667.2015.1035274
- Fox, D.M., Darboux, F., and Carrega, P., 2007. Effects of fire-induced water repellency on soil aggregate stability, splash erosion, and saturated hydraulic conductivity for different size fractions. Hydrological Processes, 21 (17), 2377–2384. doi:10.1002/hyp.6758
- Fox, D.M., Maselli, F., and Carrega, P., 2008. Using SPOT images and field sampling to map burn severity and vegetation factors affecting post forest fire erosion risk. Catena, 75 (3), 326–335. doi:10.1016/j.catena.2008.08.001
- French, N.H.F., et al., 2008. Using Landsat data to assess fire and burn severity in the North American boreal forest region: an overview and summary of results. International Journal of Wildland Fire, 17 (4), 443–462. doi:10.1071/WF08007
- Hartford, R.A. and Frandsen, W.H., 1992. When it’s hot, it’s hot … or maybe it’s not! (Surface flaming may not portend extensive soil heating). International Journal of Wildland Fire, 2 (3), 139–144. doi:10.1071/WF9920139
- Hubbert, K.R., et al., 2006. Prescribed burning effects on soil physical properties and soil water repellency in a steep chaparral watershed, southern California, USA. Geoderma, 130 (3–4), 284–298. doi:10.1016/J.GEODERMA.2005.02.001
- Hudak, A., et al., 2004a. The relationship of field burn severity measures to satellite-derived Burned Area Reflectance Classification (BARC) maps. American Society for Photogrammetry and Remote Sensing Annual Conference Proceedings, 2003, 96–104. http://treesearch.fs.fed.us/pubs/viewpub.jsp?index=26195 [Accessed 12 April 2022].
- Hudak, A.T., et al., 2004b. Field validation of burned area reflectance classification (BARC) products for post fire assessment. Tenth Forest Service Remote Sensing Applications Conference, 2003, 12.
- Hudak, A.T., et al., 2007. The relationship of multispectral satellite imagery to immediate fire effects. Fire Ecology, 3 (1), 64–90. doi:10.4996/fireecology.0301064
- Inbar, M., Tamir, M., and Wittenberg, L., 1998. Runoff and erosion processes after a forest fire in Mount Carmel, a Mediterranean area. Geomorphology, 24 (1), 17–33. doi:10.1016/S0169-555X(97)00098-6
- Jain, T.B., 2004. Tongue-tied: confused meanings for common fire terminology can lead to fuels mismanagement. Wildfire, July/August 2004, 22–26.
- Keeley, J.E., 2009. Fire intensity, fire severity and burn severity: a brief review and suggested usage. International Journal of Wildland Fire, 18 (1), 116–126. doi:10.1071/WF07049
- Key, C.H. and Benson, N.C. (2006). Landscape Assessment (LA) sampling and analysis methods. USDA Forest Service - General Technical Report RMRS-GTR, 164 RMRS-GTR.
- Khorshidi, M.S., et al., 2020. Increasing concurrence of wildfire drivers tripled megafire critical danger days in Southern California between1982 and 2018. Environmental Research Letters, 15 (10), 104002. doi:10.1088/1748-9326/abae9e
- Kokaly, R.F., et al., 2007. Characterization of post-fire surface cover, soils, and burn severity at the Cerro Grande Fire, New Mexico, using hyperspectral and multispectral remote sensing. Remote Sensing of Environment, 106 (3), 305–325. doi:10.1016/j.rse.2006.08.006
- Lavee, H., et al., 1995. Effect of surface roughness on runoff and erosion in a Mediterranean ecosystem: the role of fire. Geomorphology, 11 (3), 227–234. doi:10.1016/0169-555X(94)00059-Z
- Lentile, L., et al., 2006. Remote sensing techniques to assess active fire characteristics and post-fire effects. International Journal of Wildland Fire, 15 (3), 319–345. doi:10.1071/WF05097
- Lentile, L., et al., 2007. Lessons learned from rapid response research on wildland fires. Fire Management Today, 67 (1), 26–31.
- Lentile, L., et al., 2009. Remote sensing for prediction of 1-year post-fire ecosystem condition. International Journal of Wildland Fire, 18 (5), 594–608. doi:10.1071/WF07091
- Lewis, S.A., Wu, J.Q., and Robichaud, P.R., 2006. Assessing burn severity and comparing soil water repellency, Hayman Fire, Colorado. Hydrological Processes: An International Journal, 20 (1), 1–16. doi:10.1002/hyp.5880
- Lopes, A.R., et al., 2021. What is wrong with post-fire soil erosion modelling? A meta-analysis on current approaches, research gaps, and future directions. Earth Surface Processes and Landforms, 46 (1), 205–219. doi:10.1002/esp.5020
- McGuire, L.A., et al., 2016. Constraining the relative importance of raindrop- and flow-driven sediment transport mechanisms in postwildfire environments and implications for recovery time scales. Journal of Geophysical Research: Earth Surface, 121 (11), 2211–2237. doi:10.1002/2016JF003867
- Miller, J.D., et al., 2009. Calibration and validation of the relative differenced Normalized Burn Ratio (RdNBR) to three measres of fire severity in the Sierra Nevada and Klamath Mountains, California, USA. Remote Sensing of Environment, 113 (3), 645–656. doi:10.1016/j.rse.2008.11.009
- Miller, J.D. and Quayle, B., 2015. Calibration and validation of immediate post-fire satellite-derived data to three severity metrics. Fire Ecology, 11 (2), 12–30. doi:10.4996/fireecology.1102012
- Miller, J.D. and Thode, A.E., 2007. Quantifying burn severity in a heterogeneous landscape with a relative version of the delta Normalized Burn Ratio (dNBR). Remote Sensing of Environment, 109 (1), 66–80. doi:10.1016/J.RSE.2006.12.006
- Modaresi Rad, A., et al., 2023. Human and infrastructure exposure to large wildfires in the United States. Nature Sustainability, 829, 1–9.
- Moody, J.A., et al., 2008. Linking runoff response to burn severity after a wildfire † †. Hydrological Processes, 22 (13), 2063–2074. doi:10.1002/hyp.6806
- Moody, J.A., et al., 2016. Relations between soil hydraulic properties and burn severity. International Journal of Wildland Fire, 25 (3), 279–293. doi:10.1071/WF14062
- Moody, J.A. and Martin, D.A., 2001. Initial hydrologic and geomorphic response following a wildfire in the Colorado Front Range. Earth Surface Processes and Landforms, 26 (10), 1049–1070. doi:10.1002/esp.253
- Moreno, H.A., et al., 2020. Utility of satellite-derived burn severity to study short- and long-term effects of wildfire on streamflow at the basin scale. Journal of Hydrology, 580 (February 2019), 124244. doi:10.1016/j.jhydrol.2019.124244
- Morgan, P., et al., 2014. Challenges of assessing fire and burn severity using field measures, remote sensing and modelling. International Journal of Wildland Fire, 23 (8), 1045–1060. doi:10.1071/WF13058
- Nalbantis, I. and Lymperopoulos, S., 2012. Assessment of flood frequency after forest fires in small ungauged basins based on uncertain measurements. Hydrological Sciences Journal, 57 (1), 52–72. doi:10.1080/02626667.2011.637041
- Neary, D.G., Koestner, K.A., and Youberg, A., 2010. Hydrologic impacts of high severity wildfire : learning from the past and preparing for the future.In: 24th Annual Symposium of the Arizona Hydrological Society; Watersheds near and Far: Response to Changes in Climate and Landscape, Flagstaff, AZ, p. 8. http://www.fs.fed.us/rm/pubs_other/rmrs_2011_neary_d003.pdf?
- Northwest Fire Science Consortium, 2015. NWFSC fire facts: what is fire severity?, Northwest fire science consortium. Available from: https://www.nwfirescience.org/biblio/nwfsc-fire-facts-what-fire-severity [ Accessed 17 September 2023].
- Odion, D.C. and Hanson, C.T., 2006. Fire severity in Conifer Forests of the Sierra Nevada, California. Ecosystems, 9 (7), 1177–1189. doi:10.1007/s10021-003-0134-z
- Pannkuk, C.D. and Robichaud, P.R., 2003. Effectiveness of needle cast at reducing erosion after forest fires. Water Resources Research, 39 (12). doi:10.1029/2003WR002318
- Papadaki, C., et al., 2022. Effects of forest fires on headwater streamflow and the habitat suitability for benthic macroinvertebrates. Hydrological Sciences Journal, 67 (9), 1356–1371. doi:10.1080/02626667.2022.2081508
- Parks, S.A. and Abatzoglou, J.T., 2020. Warmer and drier fire seasons contribute to increases in area burned at high severity in Western US Forests from 1985 to 2017. Geophysical Research Letters, 47 (22), 1–10. doi:10.1029/2020GL089858
- Parks, S.A., Dillon, G.K., and Miller, C., 2014. A new metric for quantifying burn severity: the relativized burn ratio. Remote Sensing, 6 (3), 1827–1844. doi:10.3390/rs6031827
- Parsons, A., et al., 2010. Field guide for mapping post-fire soil burn severity. USDA Forest Service - General Technical Report RMRS-GTR, 243, 1–49. doi:10.2737/RMRS-GTR-243
- Parsons, A. and Orlemann, A., 2011. USDA forest service, remote sensing applications center. Figure, 1, 1–6.
- Pierson, F.B., Williams, C.J., and Robichaud, P.R., 2015. Assessing impacts of fire and post-fire mitigation on runoff and erosion from rangelands (Issue Great Basin Factsheet Series, Number 11).
- Robichaud, P.R., et al., 2000. Evaluating the effectiveness of postfire rehabilitation treatments. GTR-RMRS-63.
- Robinne, F.N., et al., 2021. Scientists’ warning on extreme wildfire risks to water supply. Hydrological Processes, 35 (5). doi:10.1002/hyp.14086
- Sadegh, M., et al., 2022, December. Increase in fire intensity with elevation gain. In: AGU Fall Meeting Abstracts, (Vol. 2022, pp. NH45F–0492). Chicago, IL, USA.
- Safford, H.D., et al., 2008. BAER soil burn severity maps do not measure fire effects to vegetation: a comment on Odion and Hanson (2006). Ecosystems, 11 (1), 1–11. doi:10.1007/s10021-007-9094-z
- Sankey, J.B., et al., 2017. Climate, wildfire, and erosion ensemble foretells more sediment in western USA watersheds. Geophysical Research Letters, 44 (17), 8884–8892. doi:10.1002/2017GL073979
- Saxe, S., Hogue, T.S., and Hay, L., 2018. Characterization and evaluation of controls on post-fire streamflow response across western US watersheds. Hydrology and Earth System Sciences, 22 (2), 1221–1237. doi:10.5194/hess-22-1221-2018
- Semenova, O., et al., 2015. Detecting immediate wildfire impact on runoff in a poorly-gauged mountainous permafrost basin. Hydrological Sciences Journal, 60 (7–8), 1225–1241. doi:10.1080/02626667.2014.959960
- Seydi, S.T. and Sadegh, M., 2023. Improved burned area mapping using monotemporal landsat-9 imagery and convolutional shift-transformer. Measurement, 216, 112961. doi:10.1016/j.measurement.2023.112961
- Shakesby, R.A., et al., 1993. Wildfire impacts on soil erosion and hydrology in wet Mediterranean forest, Portugal. International Journal of Wildland Fire, 3 (2), 95–110. doi:10.1071/WF9930095
- Simard, S.J., 1991. Fire severity, changing scales, and how things hang together. International Journal of Wildland Fire, 1 (1), 23–34. doi:10.1071/WF9910023
- Singleton, M.P., 2019. Increasing trends in high-severity fire in the southwestern USA from 1984 to 2015. Forest Ecology and Management, 433, 709–719. doi:10.1016/j.foreco.2018.11.039
- Stoof, C.R., et al., 2012. Hydrological response of a small catchment burned by experimental fire. Hydrology and Earth System Sciences, 16 (2), 267–285. doi:10.5194/hess-16-267-2012
- Stroosnijder, L., 2005. Measurement of erosion: is it possible. Catena, 2 (3), 162–173. doi:10.1016/j.catena.2005.08.004
- Szpakowski, D.M. and Jensen, J.L.R., 2019. A review of the applications of remote sensing in fire ecology. Remote Sensing, 11 (22), 2638. doi:10.3390/rs11222638
- Tzanetos, T., et al., 2022. Ingenuity mars helicopter: from technology demonstration to extraterrestrial scout. In: 2022 IEEE Aerospace Conference (AERO), Big Sky, Montana, United States, 1–19.
- Vafeidis, A.T., Drake, N.A., and Wainwright, J., 2007. A proposed method for modelling the hydrologic response of catchments to burning with the use of remote sensing and GIS. Catena, 70 (3), 396–409. doi:10.1016/j.catena.2006.11.008
- Van Wagtendonk, J.W., Ed., 2018. Fire in California’s ecosystems. 2nd ed. Berkley and Los Angeles: University of California Press.
- Veraverbeke, S. and Hook, S.J., 2013. Evaluating spectral indicies and spectral mixture analysis for assessing fire severity, combustion completeness and carbon emissions. International Journal of Wildland Fire, 22 (5), 707–720. doi:10.1071/WF12168
- Vieira, D.C.S., et al., 2018. Key factors controlling the post-fire hydrological and erosive response at micro-plot scale in a recently burned Mediterranean forest. Geomorphology, 319, 161–173. doi:10.1016/j.geomorph.2018.07.014
- Weise, D.R. and Biging, G.S., 1994. Effects of wind velocity and slope on fire behavior. Fire Safety Science, 4, 1041–1051.
- Westerling, A.L., et al., 2006. Warming and earlier spring increase Western U.S. Forest wildfire activity. Science, 313 (5789), 940–943. doi:10.1126/science.1130691
- Whitman, E., et al., 2018. Variability and drivers of burn severity in the northwestern Canadian boreal forest. Ecosphere, 9 (2). doi:10.1002/ecs2.2128
- Wolfgang, F., et al., 2017. Tier-scalable reconnaissance: the future in autonomous C4ISR systems has arrived: progress towards an outdoor testbed. Bellingham, Washington: SPIE.
- Yang, G.et al., 2021. Quantifying fire severity: a brief review and recommendations for improvement. Ecosystem Health & Sustainability, 7 (1). doi:10.1080/20964129.2021.1973346