
ABSTRACT
Enhanced and effective hydrological monitoring plays a crucial role in understanding water-related processes in a rapidly changing world. Within this context, image-based river monitoring has been shown to significantly enhance data collection, improve analysis and accuracy, and support effective and timely decision making. The integration of remote and proximal sensing technologies with citizen science and artificial intelligence may revolutionize monitoring practices. Therefore, it is crucial to evaluate the quality of current research and ongoing initiatives to envision the potential trajectories for research activities within this specific field. The evolution of monitoring strategies is progressing in multiple directions that should converge to build a critical mass around relevant challenges to find innovative solutions that overcome limitations of traditional approaches. The present study reviews examples and good practices of enhanced hydrological monitoring in different applications, reflecting on the strengths and limitations of new approaches.
Editor K. Soulis; Associate Editor (not assigned)
1 Introduction
Water resources management is facing critical challenges due to the combined effects of global warming, population growth, human pressures, and increased pollution. These factors collectively contribute to the global rise in hydrological extremes, including droughts and floods. Furthermore, they exacerbate the declining trend in water availability and the degradation of water quality, which could ultimately result in chronic water scarcity affecting a substantial portion of the world’s population. Already, around four billion people, approximately half of the global population, are affected by severe water scarcity (Mekonnen and Hoekstra Citation2016), and future climate scenarios are expected to amplify this situation (Wheater and Gober Citation2015, Boretti and Rosa Citation2019, Lu et al. Citation2019, Tramblay et al. Citation2020), which poses an escalating risk to human health and rights, ecosystems, cultural heritage, and the global economy (e.g. Cammalleri et al. Citation2020). In addition, water quality is being degraded more rapidly and diversely than ever, with an increasing number of pollutants such as nutrients, pesticides, plastics, and emerging contaminants (Bhateria and Jain Citation2016, Hannah et al. Citation2022). To address these challenges effectively, the field of water resources monitoring must evolve by considering the complex interconnections between the environment and human society (Montanari et al. Citation2013, Ross and Chang Citation2020).
Although the existing and commonly used monitoring systems have laid the foundation for our knowledge, these were designed under different hydrological conditions compared to today’s needs and challenges. These monitoring systems are laborious and expensive, and often provide data that is discontinuous in space and time (Sergeant and Nagorski Citation2015). For example, current low-frequency water quality sampling methods fail to capture occasional pollution events or changes induced by urban floods, while high-frequency monitoring approaches using in situ water quality sensors are more likely to detect these dynamics in a detailed manner (e.g. Outram et al. Citation2014, Rode et al. Citation2016). However, these approaches are prone to instrument degradation (e.g. biofouling, calibration issues) and human error, if adequate instrumental maintenance and technical staff training are not ensured. Thus, it is necessary to adopt new observational strategies, benefiting from the increasing technological development, to deepen comprehension and gain further insights on river ecosystems and dynamics.
Advancements are expected to enhance the spatiotemporal resolution of observations in order to improve “near real-time” water quality and quantity monitoring to move towards more equitable, sustainable and efficient water management. In fact, water management practices face limitations concerning data availability and timely data sharing, especially in rapidly changing environments. Increasing in-depth knowledge of how climate change as well as human pressures impact the environment, in both time and space, cannot be achieved solely with traditionally used instruments. Furthermore, the absence of a data-sharing policy in certain regions, coupled with the lack of common standards and protocols for hydrological monitoring, metadata storage, and exchanges – especially for qualitative monitoring – presents additional challenges to achieving effective and sustainable water management.
Recent advancements in Earth observation (EO) technologies, environmental tracers (isotopes and biomarkers), new sensor technologies, and unmanned aerial systems (UASs), present promising opportunities to revolutionize environmental monitoring (Demarchi et al. Citation2017, Koparan et al. Citation2018, Citation2020, Manfreda et al. Citation2018, Wang and Yang Citation2019, Perks et al. Citation2020, Piégay et al. Citation2020, Taramelli et al. Citation2020, Strelnikova et al. Citation2023). Furthermore, the integration of groundbased measurements with remotely acquired data makes it possible to characterize environmental processes much more accurately than in the recent past.
In recent years, there have been strong investments aimed at managing and maintaining EO missions, EO-derived services, and products, designing and launching new satellite missions or making operational new EO-based reliable tools (McCabe et al. Citation2017) and financing space research programmes. At the EU level, the European Copernicus Programme (https://www.copernicus.eu/) provides EO data and information services for different domains, and the EUMETSAT Satellite Application Facilities (SAF) provides datasets and products for operational hydrological applications (referred to as H SAF; https://hsaf.meteoam.it/). Similar investments are also ongoing at national levels. For instance, Italy is pursuing investments in its space economy through the Copernicus Mirror Programme, focusing on national downstream services tailored to end-user requirements. Part of this programme, known as the IRIDE Program, is now being put into action as part of the Italian National Recovery and Resilience Plan. This initiative aims to enhance hydrological monitoring by launching a hybrid satellite constellation and providing EO services, with a particular focus on water management (Mariani and Bussettini Citation2021). At global scale, a large effort was made to accelerate EO uptake and impact by fully capitalizing on the power of satellite EO in international development assistance operations such as the Global Development Assistance (GDA) programme (https://gda.esa.int/). The GDA programme is powered by the European Space Agency (ESA) and implemented in partnership with the World Bank and the Asian Development Bank through complementary thematic areas, including water resources (https://gda.esa.int/thematicarea/waterresources/).
Similarly to how smartphones revolutionized communication, the field of remote sensing has undergone a significant transformation with the emergence of miniaturized technology. In this context, CubeSats and UASs have boosted widespread adoption of these systems in academia, in operational institutional services, and in the commercial sector (Acharya et al. Citation2021, Eltner et al. Citation2022, Manfreda and Ben Dor Citation2023). Therefore, there is a growing number of new users for such new technologies, which still require harmonizing efforts in monitoring practices and accuracy assessment procedures (Tmušić et al. Citation2020).
The objective is to highlight the potential, limitations, and challenges of new technologies in hydrological monitoring by exploiting the capabilities of remote sensing, camera systems mounted on UASs or in fixed locations, image processing, and artificial intelligence (AI) algorithms. These methods and approaches may provide complementary and valuable information as well as processing capabilities to comprehensively monitor fluvial systems. This study is built upon the experiences of the authors who have been involved in European and national projects and are collaborating within the Measurements and Observations in the XXI century (MOXXI) Working Group of the International Association of Hydrological Sciences (IAHS – https://iahs.info/Initiatives/WorkingGroups/MOXXI/).
2 Challenges in hydrological monitoring
Effective hydrological monitoring faces several challenges to ensure sustainable and equitable water resources management. This section will discuss three key challenges: data scarcity and institutional limitations, spatial and temporal variability, and increasing demands for water resources.
2.1 Data scarcity and institutional limitations
The primary challenge in hydrological monitoring is data scarcity. Traditional monitoring systems often suffer from inadequate spatial coverage, limited temporal resolution, and insufficient availability of data. This scarcity of data hinders the accurate assessment of water resources and their quality, making it difficult to develop robust management strategies.
One of the most pressing concerns in data collection is the fragmentation of agencies and institutions responsible for overseeing distinct monitoring networks aimed at various objectives while tracking the same variables. This results in a heterogeneous and non-uniform distribution of monitoring stations, which often lack connections to a shared database or are installed at locations not suitable for specific objectives (Kirchner Citation2006). Despite the overall increase in the number of sensors deployed over time, the availability of pertinent information has not shown significant improvement.
The development of monitoring systems over time has been significantly shaped by political decisions and monosectorial water management criteria that lead to fragmented networks. For instance, the Italian hydrometeorological monitoring network, which transitioned from national to local control, has experienced relevant changes over time in the number of institutions involved, and the number and distribution of monitoring stations (Braca et al. Citation2021).
In addition, it is not uncommon to observe redundancy of investments in multiple monitoring networks carried out by various agencies (see the example of Basilicata Region in ), with different purposes (e.g. hydrological monitoring, agrometeorological monitoring, civil protection, research). Even if these monitoring efforts have resulted in an increased number of monitoring stations, in situ data fragmentation has increased over the course of time. These investments fail to enhance the quality and quantity of information provided because they are not synchronized or optimized with each other. Due to the lack of coordination and data harmonization, it is hard to obtain a comprehensive picture of this issue at a larger scale (e.g. at the national or European level).
Figure 1. Stacked area graph with number of raingauges installed over the Basilicata Region (Southern Italy) between 1916 and 2020. Initially, a national agency was in charge of the installation and maintenance of the monitoring network (SIMN – Servizio Idrografico e Mareografico Nazionale), while several additional networks have been introduced in more recent years addressing different purposes and managed by different agencies.
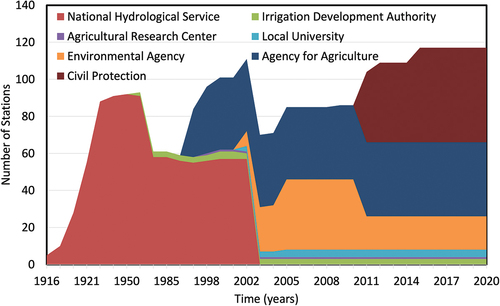
Therefore, the final total number of sensors that may be available over a certain area could comprise the combination of multiple networks established over the years, culminating in an exceedingly inefficient monitoring system. The heterogeneity of the monitoring networks also brings to light problems relating to the quality and officiality of the data.
The shift towards the digital age has unlocked the potential to construct extensive databases amalgamating measurements gathered from various origins. This could potentially overcome the existing constraints of current independently operational systems. However, substantial efforts are required for the reconstruction and harmonization of all available hydrological information, along with the digitization of historical data previously recorded on strip charts. In this context, certain automated techniques for data reconstruction have been formulated, which may help to reconstruct time series reported on strip charts (e.g. Deidda et al. Citation2007, Jaklič et al. Citation2016).
Despite the significant number of rain gauges distributed worldwide, which sum to a total number ranging between 150 000 and 250 000, the heterogeneity of rainfall fields challenges their ability to comprehensively capture precipitation patterns (Groisman and Legates Citation1995, Kidd et al. Citation2017). These gauges, assuming each is independent and represents an area with a 5 km radius, cover only about 1% of Earth’s land surface (Becker et al. Citation2013). The number of river monitoring stations is smaller than that of rain gauges (e.g. in Italy, their number is roughly one-third of the approximately 3000 rain gauges available – Braca et al. Citation2021) and they are unevenly distributed across the globe. These stations are mainly concentrated in North America and Europe, which represent about 50% of the global coverage, while Africa contains only 6% of the total (e.g. Herold and Mouton Citation2011). In addition, water level stations provide only indirect measurements of discharge and require yearly surveys to reconstruct the corresponding updated flow rating curve (Mosley and McKerchar Citation1993, Manfreda Citation2018). This activity is time consuming and expensive and for this reason has been interrupted at several sites in recent years (Tauro et al. Citation2018a). Therefore, the real number of river monitoring stations useful for water assessment is even lower than the number mentioned above.
Water quality monitoring is probably one of the most complex activities which frequently implies field sampling standards, complex laboratory protocols and techniques as well as routine data analysis. The Waterbase European Environment Agency (EEA) databases report on the status and quality of Europe’s rivers, lakes, groundwater bodies and transitional, coastal, and marine waters, on the quantity of Europe’s water resources, and on the emissions to surface waters from point and diffuse sources of pollution (Waterbase – Water Quality ICM Citation2022). This data shows that there are about 1550 monitoring locations, distributed over 24 European countries, having three or more years of data with an average of at least four samples per year. This database represents just a subset of the EU Water Quality Monitoring Network, but the limited temporal resolution of most of the water quality observations does not allow researchers to capture the variability of natural and anthropic processes especially with respect to pollution events (Alilou et al. Citation2019). At a global scale, the Global Database of Freshwater Quality (GEMStat, https://gemstat.org/) is one of the most comprehensive repositories of measured water quality data and gathered with voluntary submissions from different countries and organizations. The GEMStat database contains over 15 million entries from about 130,000 stations gathered from more than 80 countries (https://gemstat.org/about/dataavailability/). Even if many gauging stations contain only a small fraction of available data, the GEMStat database represents an important open-access and valuable reference for in situ water quality at global scale.
To address this limitation, the GlobeWQ project (https://www.globewq.info/) is a leading global initiative that proposes the integration of data from different sources, including in situ, EO, and modelling results, to enhance water quality information and assessment globally. Additionally, the presence of macro- and microplastics in rivers poses one of the most critical challenges for ocean pollution. However, there are currently no standardized protocols and sustainable systems for monitoring it.
A recent study by Hurley et al. (Citation2023) highlighted that the total number of monitored sites for macroplastics is limited to approximately 57 rivers around the world, which is notably insufficient given the scale of the problem. Therefore, it is vital to enhance monitoring efforts in both space and time to better understand regional and global plastic fates.
2.2 Spatial and temporal variability
Another significant challenge is represented by the spatial and temporal variability of hydrological processes and water resources. Their patterns exhibit substantial variations and are influenced by factors such as climate, land use, soil characteristics, morphology, human activities, and interventions. Traditional monitoring systems, often based on pointwise measurements or sampling, struggle to adequately capture this variability. In fact, the hydrological variables are mutually influenced and controlled by the spatial variability of physical factors (e.g. Rodríguez‐Iturbe et al. Citation2006, Metzger et al. Citation2017, Meijer et al. Citation2021). Therefore, water resource regimes can differ significantly between and within river basins due to the heterogeneity of geological settings, land cover, soil types, and human pressures. To account for this variability, monitoring networks must be designed to capture such heterogeneities. This requires the optimal distribution and densification of monitoring stations, and the use and integration of remote sensing data to gather spatially explicit information. This is also a clear objective introduced by the Water Framework Directive 2000/60/EC (WFD), although it is not always fully implemented, due to tangible limitations (e.g. insufficient funding, lack of skilled human resources).
Temporal variability also poses an additional challenge for water availability and quality monitoring. Infrequent sampling and sparse data collection fail to adequately capture water dynamics that can vary dramatically over different time scales, ranging from hourly fluctuations to seasonal variations, and long-term trends. Therefore, high-frequency monitoring, enabled by advanced sensor technologies and automated data collection systems, is crucial for accurately capturing these processes (e.g. Sergeant and Nagorski Citation2015, Rode et al. Citation2016).
2.3 Increasing demands for water resources
Population growth, urbanization, and industrial development exert pressure on water availability and quality. This pressure is emphasized by the current and likely future impacts of climate change on water resources. Balancing the competing demands for water resources while ensuring their sustainable use and allocation requires monitoring networks which can be expanded and upgraded to provide comprehensive coverage and real-time data. However, traditional monitoring approaches often struggle to keep pace with the increasing demands for data.
Furthermore, as water scarcity becomes more and more pressing, efficient water management strategies are needed to optimize water allocation and minimize waste. Integrated monitoring systems that combine hydrological data with socio-economic information can facilitate informed decision making and support sustainable water resources management.
Addressing the challenges of data scarcity and limitations, spatial and temporal variability, and increasing demands for water resources requires a concerted effort from the scientific community, policy- and decision makers, and water resources managers. These challenges are clearly identified by the IAHS Water Solutions Decade on “Science for Solutions: Hydrology Engaging Local People IN one Global world (HELPING).” In this context, Theme 3 is promoting joint efforts to integrate new technologies with existing ones (IAHS Citation2023).
3 Advancing hydrological monitoring
Fast-developing technologies such as remote sensing, UAS, advanced sensor networks, and wireless data networks offer opportunities to improve data availability and accessibility, and to collect data more efficiently and comprehensively. These technologies can also provide relatively high-resolution data over large spatial extents and properly capture temporal variations of hydrological processes. Integration of these technologies with data-driven approaches, such as AI, can enable more accurate and reliable hydrological monitoring.
This section will explore key areas such as: remote sensing and satellite-based technologies, sensor networks and citizen science.
3.1 Remote sensing
Satellite-based technologies offer the main advantage of wide-area coverage, capturing information on various hydrological variables such as precipitation, evapotranspiration, soil moisture, and surface water dynamics (Rango Citation1994, Chen and Wang Citation2018, Pereira et al. Citation2019, Albertini et al. Citation2022). This data, depending on the satellite mission characteristics, can be obtained at reasonable regular time intervals and at varying costs (some data are also available for free, such as those from the Copernicus mission), allowing for the assessment of temporal changes and the characterization of spatial patterns.
Numerous observation systems are tailored for hydrological research. Within National Aeronautics and Space Administration (NASA’s) 19 Earth science missions, nine are notably pertinent to hydrology: AQUA, ICESat-2, GPM, GRACE, PMM, SLAP, SMAP, SWOT, and VIIRS (NASA Citation2023). ESA has four missions relevant to hydrology: CryoSat-2, EUMETSAT satellites, Copernicus Sentinel-1 and Sentinel-2, and SMOS (Soil Moisture and Ocean Salinity) (ESA Citation2023). ESA intends to launch the EarthCARE mission to enhance understanding of clouds and aerosols’ role in solar radiation reflection. China has made substantial progress in Earth hydrology-related observation with the Fengyun and Haiyang satellite series, which focuses on meteorological observations and oceanographic monitoring, and plans to also launch the Water Cycle Observation Mission (WCOM) (Shi et al. Citation2016).
In addition, various national and international initiatives aim to advance the intersection of EO and hydrological science. These include the International Precipitation Working Group (IPWG), NASA Energy and Water Cycle Study (NEWS), European Union WATer and Global CHange (WATCH), and the Global Energy and Water Exchanges (GEWEX Citation2018) initiative.
The combined efforts of EO missions and initiatives are propelling hydrology into the era of “big data” (Peters-Lidard et al. Citation2017). Big data techniques can handle vast amounts of data, extract meaningful insights and interpret complex hydrological datasets, leading to improved understanding and predictive capabilities.
UASs, alongside satellites, are also valuable tools for hydrological monitoring (Manfreda and Ben Dor Citation2023). These systems use advanced sensors to collect high-resolution data on a local scale, allowing for precise observations. UASs are versatile and agile, capable of capturing RGB and multi- or hyper-spectral data, thermal imagery, and light detection and ranging (LiDAR) data. They excel in covering local to large areas, reaching inaccessible regions and improving the spatial and temporal resolution of hydrological observations. Currently, one limitation for the use of UASs is the maximum extent of individual surveys. Swarm drone operations could overcome these limitations using multiple unmanned aerial platforms carrying sensors integrated as a single networked system.
In this context, an intermediate level between satellites and UASs is represented by “CubeSat” and High-Altitude Pseudo Satellites (HAPS), which offer the possibility of conducting surveys over larger surfaces with high resolution. CubeSats are nano satellites which have standardized size and form which are increasingly utilized by space agencies (McCabe et al. Citation2017). HAPS, which typically fly at 15 000–30 000 m above ground level for several months at a time, are also currently in development and testing. Both systems have the potential to fill the gap between satellites and UAS for EO and hydrological monitoring, given their endurance and spatial resolution (Poghosyan and Golkar Citation2017, Gonzalo et al. Citation2018, Baraniello et al. Citation2021).
3.2 Internet of Things (IoT) and sensor networks
The Internet of Things (IoT) represents a novel technological paradigm conceptualized as a worldwide network of machines and devices with the ability to engage in mutual interactions (Lee and Lee Citation2015). It allows the integration of sensors interconnected through a variety of access networks, facilitated by cutting-edge technologies like embedded sensing and actuation, radio frequency identification (RFID), wireless networks, and semantic and real-time web services. The IoT’s low-power wide-area network (LPWAN) capabilities enable the utilization of battery-powered sensors. Among these, long-range wide-area network (LoRaWAN) stands out as it employs open-source technology and operates on unlicensed frequency bands, offering significantly greater range compared to WiFi or Bluetooth connections. LoRaWAN is particularly advantageous for applications in remote regions where cellular networks experience limited coverage. Given the multitude of devices that can be connected, the number of local measurements could enormously increase, offering the possibility to further explore complex dynamics of hydrological forcings (Perumal et al. Citation2015, McCabe et al. Citation2017, Balsamo et al. Citation2018, Tauro et al. Citation2018a, Tosi et al. Citation2020, Livoroi et al. Citation2021).
Sensory networks, in conjunction with IoT, hold promising potential for adaptive monitoring strategies through dynamic adjustments to the spatial distribution and density of sensors based on evolving hydrological conditions. Such flexibility enables targeted data collection in response to specific events or areas of interest, incorporating event-based triggers for sensor readings. Consequently, this approach optimizes the allocation of monitoring resources (Marino et al. Citation2023, Zanella et al. Citation2023).
3.3 Citizen science and crowd-sourced data
Citizen science represents an innovative tool with a measurable influence on environmental stewardship and public policy advocacy. When integrated with crowdsourcing, involving the gathering of extensive data from a diverse array of participants, citizen engagement can lead to an immediate, real-time response to pressing issues, such as pollution and natural disasters. Engaging the public in data collection and classification not only increases data coverage but also promotes public awareness and participation in water resources management (e.g. Sermet et al. Citation2020, Nardi et al. Citation2022).
Recently, several initiatives have stimulated the participation of volunteers in data collection through methods such as mobile applications, community-based monitoring programmes, or distributed sensor networks – as is the case, for example, with the CrowdWater project (Strobl et al. Citation2019). Participants can measure water levels and discharge, report on water quality observations, and share hydrological data collected from their personal monitoring stations. This collaborative effort significantly boosts data availability and offers valuable insights into the specific hydrological conditions within local areas, while also providing an avenue for active participation of key stakeholders in the community to foster technology localization and sustainability. The use of crowd-sourced data also holds the potential to complement conventional monitoring networks by capturing detailed spatial and temporal data (e.g. Etter et al. Citation2020, Mapiam et al. Citation2022).
In this context, citizen-acquired data may not always be comparable to professionally obtained data. To maintain high data quality standards, initiatives in citizen science consistently incorporate training and implement measures for quality control. This enables participants to contribute effectively, following simple and reliable procedures. Integration of these data with professional monitoring data, remote sensing observations, or model simulations can notably enhance the accuracy and resolution of hydrological analyses. Several private sensor networks have grown significantly in the last few years, producing many measurements that may be easily filtered and validated and offering a dense network of observations (de Vos et al. Citation2019). Popular online platforms such as Netatmo (https://weathermap.netatmo.com) and Weather Underground (https://www.wunderground.com/) collect and visualize measurements from public and even personal weather stations (PWSs) every ∼5 to 10 min with a total number of sensors that exceeds by one order of magnitude the number of stations of the national hydrological services (Graf et al. Citation2021, Coney et al. Citation2022). This private network of rainfall stations connected to a web service has been clearly assessed in a recent work by Graf et al. (Citation2021). In fact, these opportunistic networks can lead, after filtering and sensor calibration (Krüger et al. Citation2023), to rainfall maps of higher accuracy and increased spatial variability, especially on smaller spatial and temporal scales.
The successful use of citizen science’s potential for hydrological monitoring relies on a crucial collaboration between scientists, water managers, and the public. This engagement with the public also proves to be an effective approach for fostering a deeper understanding of water level measurements, discharge estimates, water conservation and shoreline changes (Harley et al. Citation2019, Seibert et al. Citation2019, Wang et al. Citation2022).
Several citizen science initiatives and crowd-sourced data collection platforms can contribute to data integration efforts (for instance, the largest people-powered research platform, Zooniverse – https://www.zooniverse.org/). Engaging the public in data collection and monitoring processes can increase data coverage and improve community involvement in water management decisions. This approach has been used, for instance, for flood risk management in Argentina, France, and New Zealand (e.g. Le Coz et al. Citation2016) and for coastal litter monitoring (e.g. van Lieshout et al. Citation2020).
4 The potential of image-based techniques for river monitoring
The proliferation of modern optical sensors, present in satellites, on UASs, and in smartphones as well as attached to low-cost single-board computers or micro-controllers, has sparked a compelling interest in utilizing imagery to greatly broaden the scope of possible hydrological observations (e.g. Manfreda et al. Citation2018, Strelnikova et al. Citation2023). Digital cameras have been successfully used in areas such as surveillance, facial recognition, object detection and tracking, inventory monitoring, and management. Additionally, some existing algorithms developed for general purposes have found intriguing applications in environmental monitoring, including the creation of three-dimensional (3D) models (James et al. Citation2019), assessment of highway vehicle flux (Hsu et al. Citation2003), monitoring air pollution (Zhang et al. Citation2016), measuring rainfall intensity (Allamano et al. Citation2015, Kavian et al. Citation2018, Jiang et al. Citation2019), and mapping river velocity fields (Johnson and Cowen Citation2017, Lewis and Rhoads Citation2018), among others.
Numerous researchers are currently delving into the field of river monitoring using image processing techniques. This includes a range of possibilities like traditional image processing methods from computer vision, but also new techniques utilizing AI. One of the most common applications is 3D reconstruction through Structure-from-Motion and Multi-View Stereo (SfM-MVS) or photogrammetry.
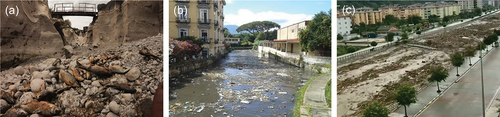
It is becoming increasingly common for ordinary hydrological stations to be associated with nearby installed optical cameras. New camera systems have the potential to capture a range of complementary information (e.g. water level, velocity, and water quality parameters) useful for interpreting natural phenomena. They may also be exploited to measure features with the support of an evolving range of software and tools (e.g. the Segment Anything Model – https://segment-anything.com/). In , we provide three examples of images taken on different rivers highlighting various phenomena such as a drought, plastic pollution, and a flood with associated intense wood transport.
Figure 2. Three examples of cross-sections: (a) Alcantara River (Italy) during a recent drought observed in the summer of 2021; (b) Sarno River (Italy) with macroplastics and organic matter transport; (c) flood with wood transport in the Ezine River, northern Turkey.
The following sections provide an in-depth exploration of various aspects that can be investigated using image-based techniques, ranging from 3D reconstruction for analysing river morphology to monitoring water quality in rivers.
4.1 River morphology
SfM-MVS algorithms have produced a revolution in the field of high-resolution topographic reconstruction (Westoby et al. Citation2012). This integrated approach utilizes matching features in multiple overlapping images without requiring 3D location of ground control points, which is common in traditional photogrammetric methods. These methods may help in estimating the area of the water surface in orthophotos (Niedzielski et al. Citation2016) and in assessing river morphology throughout time (Carrivick and Smith Citation2019), allowing for frequent cross-section updates, which becomes especially important before and immediately after flood events (Bertalan et al. Citation2023). These surveys can be repeated several times over the year to define the cross-section geometry. To improve the change detection accuracy, multi-temporal image matching techniques can be used (Feurer and Vinatier Citation2018) and when combined with error propagation methods, such as M3C2-PM (James et al. Citation2017), enable the identification of small-scale events also (Blanch et al. Citation2021). The magnitude of morphological events that can be identified with change-detection techniques depends on the resolution of the image and on the characteristics of the sensors. The detection of river morphological changes from satellite data (e.g. radar data) is not always easy, showing limitations, potentials, and challenges in this field of study, still to be investigated (Marchetti et al. Citation2023, Rossi et al. Citation2023). The riverbed below the water surface can be reconstructed, using active or passive mapping approaches, and considering radiometric and geometric principles (Mandlburger Citation2022). Geometric tools consider refraction impacts (Maas Citation2015, Dietrich Citation2017) and radiometric tools utilize the attenuation of light when travelling into deeper water (Flener et al. Citation2013, Legleiter Citation2021, Mandlburger et al. Citation2021). Thus, images can be used to describe the observed river cross-section above and below the water surface (Eltner et al. Citation2021a), including the change in distribution of grain sizes of the exposed river sediment bars (Lang et al. Citation2021, Marchetti et al. Citation2022); growth of submerged vegetation (e.g. Rowan and Kalacska Citation2021), which controls hydraulic roughness and conveyance in many lowland rivers; or the change in geomorphic unit assemblages, which compose the riverine habitats (Carbonneau and Bizzi Citation2023, Crivellaro et al. Citation2024, Latella et al. Citation2024).
4.2 Image velocimetry
Image sequences can be used to trace flow velocities and paths, tracking and measuring the displacement of visible structures on the water surface. Generally, natural patterns on free surfaces, such as wave crests, vortexes, bubbles, foams, or natural floating material (debris, vegetation) provide seeding for image processing. These conditions are especially prevalent during floods due to the presence of surface ripples caused by near-surface turbulence and pressure fluctuations. In the case of missing tracers, they can also be added manually if the site conditions allow for it.
In recent years, several image velocimetry methods have been developed, which include the classical correlation-based algorithms such as large scale particle tracking velocimetry (LSPTV – Brevis et al. Citation2011, Tauro et al. Citation2017, Eltner et al. Citation2021a) and large scale particle image velocimetry (LSPIV – Fujita et al. Citation1998, Muste et al. Citation2008, Sabrina et al. Citation2021). Other approaches measure one-dimensional (1D) patterns of image intensity, i.e. Space-Time Image Velocimetry (STIV – Fujita et al. Citation2007), or use the well-known computer vision technique of optical flow, e.g. implemented in the tools optical tracking velocimetry (OTV – Tauro et al. Citation2018b) and Kanade-Lucas-Tomasi image velocimetry (KLT-IV – Perks Citation2020).
These methodologies have been successfully implemented in continuous monitoring systems (e.g. Peña-Haro et al. Citation2021) and they have been effectively applied in remote or hard-to-reach areas using footage captured from UAS or on synthetic flow videos (e.g. Perks et al. Citation2016, Tauro et al. Citation2016, Pearce et al. Citation2020, Bodart et al. Citation2022, Ljubičić et al. Citation2024). The introduction of deep learning-based algorithms, as highlighted by Ansari et al. (Citation2023), has significantly reduced the need for extensive parameter configuration. It is important to note that the accuracy of these methods in reconstructing surface velocities is influenced by various factors, including camera set-up, seeding density, lighting conditions and other environmental variables. Despite the associated errors being typically quite small, often lower than 10% (Manfreda et al. Citation2019, Eltner et al. Citation2020), data collection can still be improved by taking into consideration relevant data optimization procedures. Since there is an emphasis on the need for higher seeding density, solutions to optimize frame selection using metric-based (Pizarro et al. Citation2020) and artificial neural network (ANN) (Alongi et al. Citation2023) approaches may be beneficial to improve the quality of surface velocity reconstructions.
Besides the usage of RGB imagery, thermal data is considered for the tracking tasks, which can become important in the case of low density or absence of floating features at the water surface (Lin et al. Citation2019), or in night-time conditions (Fujita Citation2017). Thermal cameras can capture the inherent fluxes of river surface temperature and therefore trace the evolving vortices (Kinzel and Legleiter Citation2019, Eltner et al. Citation2021c). Furthermore, these cameras have the potential to serve as valuable tools for monitoring the inflow of water with distinct thermal properties into the main river channel.
4.3 River discharge
The computation of river discharge primarily relies on integrating water velocity profiles with cross-sectional area. In this context, a crucial factor is the water level, which can be determined in various ways. One option is the imaging of a stage board for a straightforward water-level retrieval (Young et al. Citation2015, Leduc et al. Citation2018), or using synchronized cameras to create a 3D reconstruction of the water surface (Ferreira et al. Citation2017). In ephemeral and intermittent streams, water level was monitored by applying automatic image thresholding to pictures of a reference thin pole installed in the stream (Noto et al. Citation2022, Tauro et al. Citation2022). Another approach is the masking of the water area in the image to identify the boundary between water and other elements and then transforming this waterline into water level data. The process involves two steps: image segmentation, which classifies pixels as water or non-water using image sequences or Convolutional Neural Networks (CNNs) (Stumpf et al. Citation2016, Elias et al. Citation2019, Vandaele et al. Citation2021); and water level retrieval, where the waterline contour is converted into water level data, often through intersection with a 3D model (Eltner et al. Citation2021b).
Once water levels and velocities are determined, discharge can be determined with various approaches. One straightforward method involves deriving depth-averaged velocity with correction parameters, and subsequently applying the velocity-area method (Hauet et al. Citation2008, Detert et al. Citation2017). Alternatively, the entropy model reconstructs flow velocity profiles (Bahmanpouri et al. Citation2022), utilizing known conditions like surface velocity to accurately estimate average water flow speed (Moramarco et al. Citation2013). A more recent approach uses river wave patterns to directly estimate discharge, without the need for cross-section measurements or velocity data, solely relying on physical principles (Dolcetti et al. Citation2022). The last methodology may be useful during high flood flows, but it still provides errors larger than 30%.
4.4 Water quality
Numerous water quality parameters serve as key pollution indicators. Gholizadeh et al. (Citation2016) identifies a list of most commonly measured qualitative parameters of water, which include: chlorophyll-a (CHL-a), Secchi disk depth (SDD), temperature, coloured dissolved organic matter (CDOM), total organic carbon (TOC), dissolved organic carbon (DOC), total suspended matter (TSM), turbidity, sea surface salinity (SSS), total phosphorus (TP), ortho-phosphate (PO4), chemical oxygen demand (COD), biochemical oxygen demand (BOD), electrical conductivity (EC), and ammonia nitrogen (NH3-N). Some, like CHL and CDOM, have optical properties detectable with RGB cameras (Goddijn and White Citation2006), while non-optical parameters like TP can be remotely sensed by leveraging their relationship with optically active parameters, such as CHL (Niu et al. Citation2021).
Furthermore, RGB cameras are effective in detecting floating materials, plumes, foam, or oil spills, with spatial image resolution matching object dimensions being the only limitation. Feature detection and labelling algorithms provide valuable insights into material density and distribution, aiding in prompt pollution event detection.
A recent review by Ramírez et al. (Citation2023) underscores the potential of citizen science in diverse hydrological applications, especially pollution detection and water quality modelling. The review highlights the need for guidelines and protocols to ensure data meets water quality standards and is comparable across projects. Additionally, integrating discharge and flow velocity measurements enhances the evaluation of pollutant concentration and propagation velocity.
4.4.1 River turbidity
Turbidity detection is an important indicator of water quality and assumes great significance for environmental protection and aquatic ecosystems. It is used as a relative indicator for other physical properties such as suspended sediment concentration (SSC) and total suspended solids (TSS) as well as other compounds present in water such as chlorophyll, organic matter, microorganisms, algae, chemicals, etc. Since turbidity is generally closely related to these compounds, it can often be used for quantitative estimation. Turbidity often varies with seasons and rainfall events that can cloud the water. The growth of algae and other organisms in the summer can also cause an increase in turbidity.
There are several applications of river turbidity monitoring from satellites which provide a clear overview of the opportunities offered by different spectral indices (e.g. Fraser Citation1998, Lacaux et al. Citation2007, Wang and Shi Citation2007, Constantin et al. Citation2016). Among others, Garg et al. (Citation2020) investigated the change in spectral reflectance of water across the visible to near-infrared (NIR) range along the Ganga River. The temporal analysis indicates a reduction in reflectance across the visible-to-NIR range, likely due to decreased water turbidity. While it is difficult to use the blue and green bands to map turbidity variations because of bottom interference, the red and NIR bands prove more sensitive for turbidity estimation, particularly in optically deep water. Ehmann et al. (Citation2019) confirmed these findings, emphasizing the red band’s sensitivity in depicting turbidity gradients within UAS imagery.
4.4.2 Macroplastics and litter
Global concern about plastic pollution in rivers is increasing due to the escalating issue of plastics entering waterways through direct disposal, wind dispersal, runoff, and sewage discharge. Macroplastics, which are large particles of plastic debris (>2.5 cm), account for about 70–80% of total debris that mainly enters the oceans via rivers, posing serious threats to the environment and human health (Haseler et al. Citation2018, GESAMP Citation2019, van Emmerik and Schwarz Citation2020). This concerning issue is further compounded by an annual surge of 14 million tons of plastic leakage at the global scale. Notably, the yearly discharge of mismanaged plastic waste (MPW) from land into the ocean was estimated to vary between 0.41 and 12.7 million metric tons (Jambeck et al. Citation2015, Lebreton et al. Citation2017, Schmidt et al. Citation2017). The range of variability is large given the high uncertainty and low availability of reliable observations (Roebroek et al. Citation2022, González-Fernández et al. Citation2023). It is also remarkable that the distribution of emissions is extremely uneven, with a few countries such as the Philippines and India contributing up to almost 50% of the pollution (Meijer et al. Citation2021). Recent work, however, suggests that a large part of plastic accumulates in and around rivers for years to decades before reaching the ocean (van Emmerik et al. Citation2022). Currently, the plastic mobilization, transport and accumulation processes remain largely unresolved.
Flood events seem to play a key role, and globally lead to a 30-fold increase in plastic mobilization (Roebroek et al. Citation2021). Plastic transport can vary by one to two orders of magnitude at daily, monthly, and yearly time scales. However, current methods only allow for sporadic observations with limited temporal and spatial coverage (van Calcar and van Emmerik Citation2019, González-Fernández et al. Citation2021).
Despite the low reflectance of plastic, RGB and multispectral imagery combined with machine learning tools (e.g. Gnann et al. Citation2022), or in some cases with simpler tools, such as object detection (van Lieshout et al. Citation2020), spectral angle mapper (Gonçalves and Andriolo Citation2022), naïve Bayesian classification (Biermann et al. Citation2020), image masking (Schreyers et al. Citation2021), and other RGB markers such as microorganisms (Corbari et al. Citation2020), are valuable tools for effective macroplastic monitoring. To overcome the large uncertainties in plastic transport, retention and emissions into the ocean, increased monitoring efforts are crucial.
5 Experimental activities and projects
The large number of ongoing international initiatives highlights the worldwide effort aimed at developing new tools and methodologies for hydrological monitoring. In , we have listed the most promising recent research projects that exploit innovative technological solutions, including image processing, UASs, and citizen science.
Table 1. Initiatives orientated towards promoting the use of new technologies in hydrological monitoring.
Within this context, we are carrying out several experimental initiatives within international projects that are useful to underline the potential of alternative techniques with practical examples. Among others, we will mention: (1) the Agenzia Spaziale Italiana-ISPRA (ASI-ISPRA) Habitat Mapping project; (2) the Partnership for Research & Innovation in the Mediterranean Area (PRIMA)-funded project named “OurMED: Sustainable water storage and distribution in the Mediterranean”; and (3) “RiverWatch: a citizen-science approach to river pollution monitoring,” funded by the Italian Ministry of University and Research Progetti di Rilevante Interesse Nazionale (PRIN). The first project aims to use remote sensing techniques for mapping terrestrial, aquatic, and transitional habitats, including characterizing fluvial hydromorphology. The second project aims to explore new water-saving strategies over several demo sites distributed in different countries in the Mediterranean. Within each demo site, monitoring camera systems will be adopted to measure the water flow and turbidity. The third project will be focused on the monitoring of the Sarno River, which is the most polluted river in Europe (Lofrano et al. Citation2015, Baldantoni et al. Citation2018). These examples trace the pace for a new trajectory in hydrological monitoring. These projects offer a unique opportunity to test new water monitoring ideas and tools. More details about the case studies are given in the following subsections, with the aim to identify the expected impacts associated with the ongoing activities.
5.1 Hydromorphological characterization through satellite and UAS data
The ASI-ISPRA Habitat Mapping project () established the “Italian Research and development Initiative for Spaceborne river monitoring” (IRIS) to develop a prototype of tools and algorithms able to map river forms and processes along hundreds of kilometres of river length. The combined use of Copernicus Sentinel-1 and Sentinel-2 data and UAS acquisitions (the latter used as “ground truth” – that is, as the real feature collected at the imaged location) in a satellite-based classification algorithm has proven effective to identify, along the river corridor, the spatial units with similar textural and spectral characteristics that constitute the key river geomorphic macro‐units: “water,” “vegetation” and “exposed sediment” (, Carbonneau et al. Citation2020, Mariani and Bussettini Citation2021). These key geomorphic macro-units represent the external envelope of river geomorphic units of the same type (Belletti et al. Citation2017), whose temporal evolution is necessary to identify river channel dynamics, and to better understand river processes and their future trajectories.
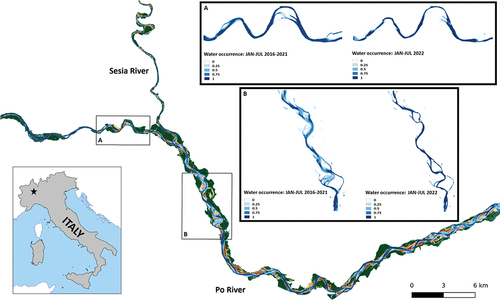
Figure 3. Example of satellite-based classification for the Po River (approximately from Morano at Po and Castelnuovo di Scrivia, NW Italy) and the Sesia River over the period January–July 2016–2021 using Copernicus Sentinel-2 data. The map in the bottom left corner displays the location of both rivers using a star symbol. Water units are represented by shades of blue, vegetation (both riverbed and riparian) by shades of green, and sediments by shades of brown. Boxes A and B specifically focus on the impact of drought on the Po River’s water presence. The map on the left of each box shows the frequency of “water” units from January to July across the years 2016–2021, while the map on the right depicts the same for January to July 2022. This comparison allows for easy visualization of changes in water distribution over time.
The IRIS prototype was developed and tested on five Italian rivers characterized by different channel patterns, morphological types, and flow regimes, namely the Po and Sesia rivers (in NW Italy), the Tagliamento River (in NE Italy), the Paglia River (in Central Italy), and the Bonamico Torrent (in Southern Italy). The operational implementation of these algorithms and tools is underway within the IRIDE Program (). The potential of this tool is to provide continuous river monitoring and support local authorities in the assessment of rivers’ morphological status, needed for WFD implementation.
The satellite-based algorithm developed in IRIS is typically applied to a mask of the river corridor, divided into specific river stretches of similar morphological types, following the Sistema di valutazione idromorfologica, analisi e monitoraggio dei corsi d’acqua (IDRAIM) methodological framework for stream hydromorphological assessment (Rinaldi et al. Citation2015). The identification of the three classes (water, vegetation, and sediments) in time (e.g. monthly, yearly) and space (river reach scale) allow researchers to measure changes and interaction between them and extract hydromorphological indicators useful for river monitoring. This can be done, for example, by calculating the ratio of “units submerged” to “units submerged + units emerged” and creating a spatio-temporal matrix of these values. Such analysis provides insights on the river dynamics and planimetric variations, useful for understanding past, current, and potential future river processes. In addition, by exploiting a time series analysis of derived satellite data, the frequency map of each macro-unit class can be calculated. These products can be used for a variety of purposes, ranging from decision making support to pre- and post-event assessments (e.g. assessing the impact of natural events such as droughts and/or floods).
(boxes A and B) presents a semi-quantitative assessment of the impact of the severe drought that affected Northwestern Italy between late 2021 and April 2023, focusing on a portion of the Po River. Specifically, it examines the “water frequency” map, calculated as the average frequency of the water component through time. By comparing the period of January–July 2022 vs January–July over the years 2016–2021, the effect of the severe drought is shown by the decrease in the number of pixels belonging to the “water” class, compared with what was observed in the previous years. While not shown here, similar analyses and applications can be conducted for the “vegetation” and “sediment” classes. For example, the map of “exposed sediments” can be used to perform correlation analyses between satellite data and sediment characteristics (e.g. sediment size and shape, sediment provenance, lithology). A first application of this kind can be found in Marchetti et al. (Citation2022), which shows the potential of Sentinel-2 multispectral data to derive gravel vs sand-dominated river bars.
This study demonstrates the potential of Copernicus satellite data, including both multispectral (Sentinel-2) and radar (Sentinel-1) data, to support the hydromorphological characterization of watercourses as well as their integration with high resolution UAS data. The EU Copernicus programme offers freely available, long-term satellite data with reasonably frequent acquisition, enabling the derivation of statistically robust results for river monitoring. Notably, these Sentinel-1 and Sentinel-2 missions have seen spatial resolution improvements in recent years, now ranging from 10 to 20 m. Despite these enhancements, however, the current resolution still limits the applicability of the methodology to watercourses with active channels wider than 50 m. Unfortunately, this excludes most mountain river basins. Higher resolution sensors, such as those offered by private satellite companies or CubeSats (with resolution up to 30 cm), exist but come at a significant cost. In mountain river basins, UAS acquisitions remain a valuable tool for detailed hydromorphological characterization, particularly before and after specific events. The future availability of higher satellite resolution imagery, such as those coming from the IRIDE satellite constellation () for the Italian public administration, promises to significantly improve the recognition of river forms and processes through satellite-based algorithms.
5.2 Water turbidity monitoring on the Bode River
The Bode catchment is one of the meteorologically and hydrologically best-instrumented meso-scale catchments in Europe, providing high-resolution observations of water quantity and quality (Zacharias et al. Citation2011, Wollschläger et al. Citation2017). Within this catchment, the Meisdorf station has been chosen to assess the viability of camera systems for continuous water quality monitoring. In addition, targeted experiments have been conducted, inducing controlled changes in water turbidity, to test potentials of camera systems.
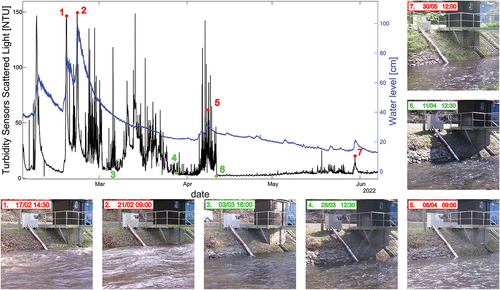
Preliminary results of the long-term study are given in , which describes the turbidity measurements in terms of nephelometric turbidity units (NTUs) obtained by a submerged turbidimeter and the water level gauges. Within this figure, we have selected seven significant images obtained by the trap camera which provides evidence of the relative changes of the water body colours at different levels of turbidity (Miglino et al. Citation2022).
Figure 4. Turbidity and water level diagram from February to June 2022 with associated photographs taken at different levels of turbidity (Meisdorf station on the Selke River – tributary of the Bode River, Germany).
In addition, supplementary tracer experiments were conducted by applying kaolin clay (a commonly used turbidity standard, which is a readily available, safe, and cost-effective clay mineral) upstream of the monitored river cross-section. illustrates one of these simulated events. During these events, various sensors, including optical cameras, multispectral cameras, and a drone equipped with an optical camera, were employed to capture different perspectives of the synthetic turbidity event. The data collected from these cameras were compared with the records from existing turbidity sensors at the Selke River cross-section.
Figure 5. Turbidity diagram measured in February 2023 with associated photographs taken in different conditions from the trap-camera and UAS hovering.
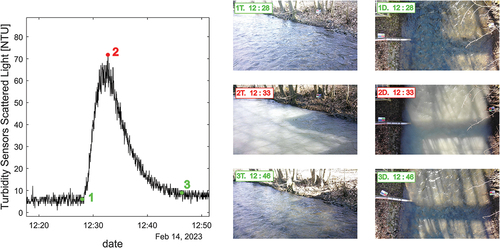
provides an initial overview of the experimental results, emphasizing the phases of the experiment captured by RGB cameras. However, the UAS imagery offers a richer and more informative depiction of the water dynamic response, highlighting the advantages of zenithal camera positioning for comprehensive observations.
This field campaign proved invaluable for developing and refining the image processing methodology. Integrating field results allowed us to test the camera monitoring system in diverse environmental and hydrological settings. This enabled us to generalize the procedure for potential application to other water quality parameters exhibiting spectral response changes.
These experiments illuminated both the advantages and the challenges of camera systems. Though they offer a wealth of information, they can also be susceptible to significant noise and difficulties. While initial findings clearly demonstrate the system’s ability to provide insights into river system trends and dynamics, several practical issues require resolution:
Significant variations in illumination cause notable differences in spectral signatures across days and seasons.
Changing illumination direction and resulting tree shadows alter the scene during the day.
Flow conditions and ripples may affect the spectral signature.
Suspended sediment colour variations can also impact the camera signal.
Wind, human activity, or animal presence might disrupt camera positioning or even induce vibrations.
Shallow rivers’ backgrounds, particularly the cross-section, can be challenging.
These critical factors should be considered to refine camera systems’ effectiveness, establishing a robust workflow for high-quality measurements. This might involve optimizing camera angles, implementing effective image filtering and calibration, securing camera stability, and providing comprehensive training for floating object detection.
5.3 Water quality monitoring on the Sarno River
The Sarno River is a formidable challenge: developing pioneering monitoring systems for Europe’s most polluted river, situated within a complex and socioeconomically disadvantaged setting. The site has been subject to political disputes over remediation measures for a long time. It is considered the most polluted river in Europe and one of the 10 most polluted rivers in the world. The river drains a watershed area of 540 km2 densely populated with heavy agricultural and industrial activities. The distribution of different activities in the basin is clustered, which leads to strong spatial variability and temporal fluctuations of environmental conditions (Montuori et al. Citation2013, Cicchella et al. Citation2014, Baldantoni et al. Citation2018).
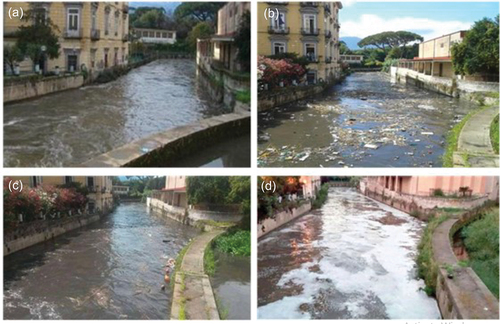
shows four images of the Sarno River at Scafati in different conditions: ordinary condition, dense presence of macroplastic (polystyrene foams) and organic material, presence of plastic elements, and presence of foam on the surface.
Figure 6. Examples of images taken on the Sarno River at Scafati (Italy) where the presence of suspended material is clearly visible: (a) ordinary condition; (b) dense presence of macroplastic (polystyrene foams) and organic material; (c) presence of plastic elements; (d) presence of foam on the surface.
UAS and camera images have been instrumental in capturing a comprehensive view of water quality dynamics, encompassing factors such as turbidity levels, plastic presence, and pollutant transport. Notably, images offer a distinct advantage in their ability to reveal the spatial distribution of pollution. This capability enables us to precisely identify the sources of specific contaminants and accurately depict the processes of intermingling between polluted and clean water. In this context, provide a detailed representation of the mixing of contaminated water. illustrates the confluence of the Nocerino tributary into the Sarno River using thermal cameras, while depicts the outlet of the Sarno River using a turbidity index.
Figure 7. Example of UAS-based imagery obtained with (a) an RGB and (b) a thermal camera at the confluence of the Nocerino River and the Sarno River. The image shows a clear flow of pollutants coming from the right tributary.
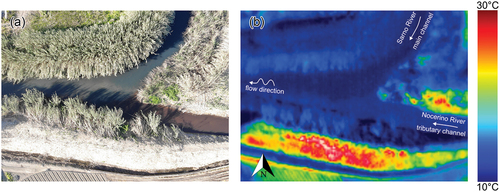
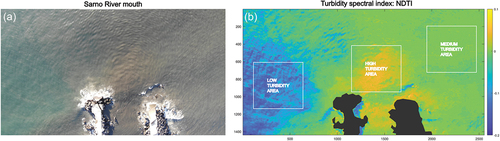
Figure 8. Outlet of the Sarno River: (a) RGB UAS image, (b) normalized difference turbidity index, NDTI = (R − G)/(R + G) obtained as the ratio between the red (R) and green (G) bands.
presents an RGB aerial image of the confluence of the Nocerino tributary and the Sarno River. The image clearly shows the distinct chromatic differences between the two water bodies, confirmed by the thermal image in . The higher temperature visible in the Nocerino tributary suggests a substantial inflow of sewer water, likely causing the thermal contrast.
Downstream from the confluence, the river’s turbidity noticeably increases, serving as a strong indicator of aquatic ecosystem pollution. As the river approaches its mouth at the Tyrrhenian Sea, a clear blending of this concentrated pollutant plume with seawater becomes evident. This mixing process is vividly illustrated in ), where the Normalized Difference Turbidity Index (NDTI) derived from RGB UAS imagery visually depicts this phenomenon.
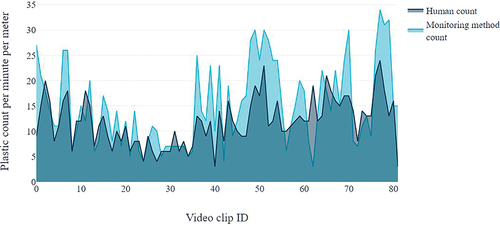
Besides the characteristics of the fluid, feature detection and classification algorithms can support the identification of floating objects on the water surface. In fact, van Lieshout et al. (Citation2020) compared the automatic procedure with manual counting and obtained promising results in several monitored sites in Jakarta (Indonesia). They developed a deep learning algorithm that allowed them to estimate plastic density with a precision of 68.7%, when compared to human detection (see ).
Figure 9. Performance of automatic feature detection for plastic detection applied on five different river locations across Jakarta, Indonesia (taken from van Lieshout et al. Citation2020).
In the literature, numerous well-established algorithms for feature detection and classification are available. One notable example is the YOLO (You Only Look Once) algorithm, initially developed by Redmon et al. (Citation2016). This algorithm stands out for its exceptional computational efficiency, making it a highly promising tool.
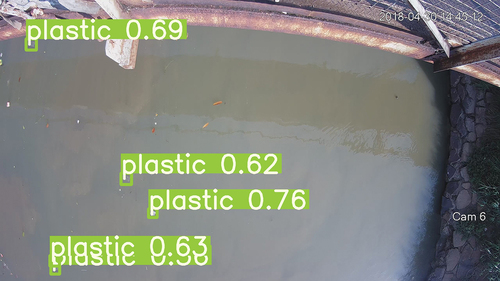
The effectiveness of YOLO in plastic detection has been explored through the application of YOLOv7 (Wang et al. Citation2023), which demonstrated good performance in identifying plastic objects, as illustrated in . Nonetheless, there remains room for improvement in enhancing its performance, especially when it comes to adapting to the unique environmental characteristics of plastic objects. This can be achieved by incorporating environment-specific plastic training data that encompasses a wide range of colours and geometric variations.
Figure 10. Sample image of floating plastic bottles in the environment, with floating macroplastic processed with the YOLOv7 algorithm.
In this context, the activities along the Sarno River serve as an ideal source of new training data. Leveraging this data will contribute to optimizing the utilization of a tool that has rapidly evolved into an indispensable and versatile resource for a multitude of applications.
In order to improve the training of these algorithms, there is a need for a large amount of training data which could be provided by any volunteer. With this aim, we are promoting the construction of an image repository for YOLO training, collecting images of rivers with the presence of different pollutants or floating materials. This activity will be carried out within the project RiverWatch and it is possible to contribute to this data collection effort using the following link: https://forms.gle/WHvGvqQc6p3zdEuN9.
It is worthy to mention that several repositories of river images have been already implemented, and these may represent a good starting point in future studies on plastic transport and identification of other pollutants. The most recent repositories developed within different EU or national projects are listed in .
Table 2. Public repositories useful for image-based applications.
6 Discussion
This paper addresses the challenges of hydrological monitoring, encompassing issues such as data scarcity, spatial and temporal variability, and the growing demand for water resource monitoring. These challenges are exacerbated by climate change, which will have significant environmental and socioeconomic impacts. Our analysis emphasizes the need for high-resolution observations in this rapidly evolving environment, where river dynamics and water quality undergo constant changes. Developing new tools capable of providing a holistic picture of a river’s state is crucial for securing water supply and ensuring environmental safety.
In this context, the international community is actively exploring the potential of innovative approaches and technologies, including satellite-based technologies, UASs, camera systems, big data analytics, sensor networks, and citizen science. The integration of multiple data sources and the utilization of innovative approaches offer new prospects for addressing data scarcity, enhancing spatial and temporal resolution, and advancing our comprehension of complex hydrological processes.
Combining remote sensing data with machine learning holds great potential for creating more comprehensive river monitoring systems (Maier and Keller Citation2019, Arias-Rodriguez et al. Citation2020). Global experiments across diverse basins highlight both challenges and advantages of this approach. We have actively participated in and developed initiatives showcasing the convenience and wide applicability of remote sensing coupled with image processing techniques. These experiences lay the groundwork for a new generation of sensors – from RGB to hyperspectral and thermal – unlocking the power of image processing to extract diverse hydraulic, hydromorphological, and water-quality-related parameters.
Reviewing existing activities and research reveals critical limitations and challenges in using innovative technologies for river monitoring:
Developing systems flexible enough to handle diverse hydraulic, environmental, and climatic conditions remains a key challenge. Different river cross-sections within the same basin can have unique characteristics due to upstream features or local specifics. This requires testing in diverse environments and sharing experiences and data openly with the research community.
Although satellites are powerful tools for hydrological and hydromorphological monitoring, their limited spatial resolution often hinders their use in narrower river networks worldwide. Proximity sensors, however, offer a promising alternative to overcome this limitation.
Image-based techniques are susceptible to local factors like illumination, surrounding environment, tree shadows, and cross-section background. Developing standardized pre-processing techniques is crucial to ensure consistent data quality and maximize information in each survey or measurement.
Individual pollutants and their combination within a specific location can complicate the interpretation of spectral signatures in any type of imagery, posing a significant challenge that needs to be addressed.
The substantial volume of data collected by these sensors may lead to information overload, which may not always be useful for specific purposes. Consequently, there is a need to synthesize the information and develop meaningful metrics capable of retaining essential data.
New techniques based on camera use or citizen participation can be susceptible to significant disturbances and procedural errors, potentially degrading the quality of the collected information. Therefore, establishing standardized protocols and sustainable systems for using such methods is critical.
There are still many issues that require further investigation to bring these methods to operational use. However, numerous opportunities exist for advancing hydrological monitoring using these innovative techniques. Here, we highlight some of the key opportunities:
Affordable commercial devices: The use of image-based techniques could lead to the development of cost-effective commercial devices that can be integrated into sensor networks, even in remote regions around the world.
Integration of crowd-sourced data: The integration of crowd-sourced data with image processing appears to be a natural progression for the evolution of new monitoring techniques.
Citizen-friendly tools: Creating user-friendly tools that could potentially be used on smartphones by the public may expand the overall number of hydrological sensors. This could have significant environmental benefits by fostering a community engaged in river monitoring, raising awareness about the state of aquatic ecosystems, and working towards their protection. Additionally, this approach could address some typical limitations often encountered in traditional techniques, such as theft, vandalism, reliance on a power supply, and high acquisition and running costs.
Multipurpose systems: Leveraging these innovative tools can yield a wealth of information regarding watercourse dynamics that surpasses the capabilities of traditional methods. Such data can be invaluable in bolstering the management of river systems, offering a comprehensive depiction of the river’s current condition.
Even with limitations and advantages considered, a critical challenge remains shifting from qualitative to quantitative assessments. This transition stands as arguably the biggest hurdle on our journey forward.
7 Conclusion
Advanced hydrological monitoring techniques and technologies enable the timely identification of hydrological and hydromorphological patterns, anomalies, and critical events like floods, droughts, pollution incidents, and debris flows. This facilitates proactive responses and the implementation of appropriate measures to mitigate risks and minimize extreme event impacts on water resources. In addition, integrating citizen involvement in monitoring may encourage responsible behaviour. This information guides the development of adaptive water management strategies that account for uncertainties and future challenges.
Conventional approaches have historically been limited by technical and financial constraints, hindering their ability to provide the needed detail on river dynamics, water conditions, and other hydrological variables. In contrast, the innovative technologies explored in this manuscript offer a range of advantages, presenting opportunities to complement and integrate existing traditional systems. Furthermore, combining remote and proximal sensing with crowd-sourced data holds immense potential for revolutionizing hydrological monitoring, enabling a comprehensive understanding of river systems. AI algorithms could further enhance the insights gleaned from this vast amount of data.
We foresee exciting potential for initiatives like the IAHS MOXXI working group (https://iahs.info/Initiatives/Working-Groups/MOXXI/) to accelerate the development of cutting-edge hydrological monitoring solutions. This international collaboration can act as a catalyst for extensive data sharing and foster groundbreaking joint ventures in innovative solutions. Ultimately, such collective efforts could significantly deepen our understanding of the intricate water cycle dynamics, paving the way for truly adaptive, integrated, inclusive, and sustainable water management.
Acknowledgements
The present research has been carried out within the project “OurMED: Sustainable water storage and distribution in the Mediterranean,” which is part of the PRIMA Programme supported by the European Union’s Horizon 2020 Research and Innovation Programme under Grant Agreement No. 2222; and the PRIN project 2022MMBA8X – “RiverWatch: A Citizen-Science Approach to River Pollution Monitoring” (CUP: J53D23002260006) funded by the Italian Ministry of University and Research. FT acknowledges support from Progetto ECS 0000024 Rome Technopole – (CUP: B83C22002820006) PNRR Mission 4 Component 2 Investment 1.5, funded by the European Union – NextGenerationEU.
Disclosure statement
No potential conflict of interest was reported by the author(s).
Additional information
Funding
References
- Acharya, B.S., et al., 2021. Unmanned aerial vehicles in hydrology and water management: applications, challenges, and perspectives. Water Resources Research, 57(11), e2021WR029925. doi:10.1029/2021WR029925.
- Albertini, C., et al., 2022. Detection of surface water and floods with multispectral satellites. Remote Sensing, 14, 6005. 23. doi:10.3390/rs14236005.
- Alilou, H., et al., 2019. A novel approach for selecting sampling points locations to river water quality monitoring in data-scarce regions. Journal of Hydrology, 573, 109–122. doi:10.1016/j.jhydrol.2019.03.068.
- Allamano, P., Croci, A., and Laio, F. (2015). Toward the camera rain gauge. Water Resources Research, 51(3), 1744–1757. doi:10.1002/2014WR016298.
- Alongi, F., et al., 2023. An automatic ANN-based procedure for detecting optimal image sequences supporting LS-PIV applications for rivers monitoring. Journal of Hydrology, 626, 130233. doi:10.1016/j.jhydrol.2023.130233.
- Ansari, S., et al., 2023. RivQNet: deep learning based river discharge estimation using close‐range water surface imagery. Water Resources Research, 59(2), e2021WR031841. doi:10.1029/2021WR031841.
- Arias-Rodriguez, L.F., et al., 2020. Monitoring water quality of valle de bravo reservoir, Mexico, using entire lifespan of meris data and machine learning approaches. Remote Sensing, 12(10), 1586. doi:10.3390/rs12101586.
- Bahmanpouri, F., et al., 2022. Estimating the average river cross‐section velocity by observing only one surface velocity value and calibrating the entropic parameter. Water Resources Research, 58(10), e2021WR031821. doi:10.1029/2021WR031821.
- Baldantoni, D., et al., 2018. Biomonitoring of nutrient and toxic element concentrations in the Sarno River through aquatic plants. Ecotoxicology and Environmental Safety, 148, 520–527. doi:10.1016/j.ecoenv.2017.10.063.
- Balsamo, G., et al., 2018. Satellite and in situ observations for advancing global Earth surface modelling: a Review. Remote Sensing, 10(12), 2038. doi:10.3390/rs10122038.
- Baraniello, V.R., et al., 2021. The application of high altitude pseudo-satellites for a rapid disaster response. In 2021 IEEE International Geoscience and Remote Sensing Symposium IGARSS. Brussels, Belgium: IEEE, 8400–8403.
- Becker, A., et al., 2013. A description of the global land-surface precipitation data products of the global precipitation climatology centre with sample applications including Centennial (trend) analysis from 1901–present. Earth System Science Data, 5(1), 71–99. doi:10.5194/essd-5-71-2013.
- Belletti, B., et al., 2017. Characterising physical habitats and fluvial hydromorphology: a new system for the survey and classification of river geomorphic units. Geomorphology, 283, 143–157. doi:10.1016/j.geomorph.2017.01.032.
- Bertalan, L., et al., 2023. Monitoring river channel dynamics by unmanned aerial systems. In: Salvatore Manfreda and Eyal Ben Dor, eds. Unmanned aerial systems for monitoring soil, vegetation, and riverine environments. Amsterdam, The Netherlands: Elsevier, 271–292.
- Bhateria, R. and Jain, D., 2016. Water quality assessment of lake water: a review. Sustainable Water Resources Management, 2, 161–173. 2 doi:10.1007/s40899-015-0014-7.
- Biermann, L., et al., 2020. Finding plastic patches in coastal waters using optical satellite data. Scientific Reports, 10(1), 5364. doi:10.1038/s41598-020-62298-z.
- Blanch, X., et al., 2021. Multi-Epoch and Multi-Imagery (MEMI) photogrammetric workflow for enhanced change detection using time-lapse cameras. Remote Sensing, 13(8), 1460. doi:10.3390/rs13081460.
- Bodart, G., et al., 2022. Synthetic river flow videos for evaluating image‐based velocimetry methods. Water Resources Research, 58(12), e2022WR032251. doi:10.1029/2022WR032251.
- Boretti, A. and Rosa, L., 2019. Reassessing the projections of the world water development report. NPJ Clean Water, 2(1), 15. doi:10.1038/s41545-019-0039-9.
- Braca, G., et al., 2021: Il Bilancio Idrologico Gis BAsed a scala Nazionale su Griglia regolare – BIGBANG: metodologia e stime. Rapporto sulla disponibilità naturale della risorsa idrica. Rapporti n. 339/21. Roma: ISPRA.
- Brevis, W., Niño, Y., and Jirka, G.H., 2011. Integrating cross-correlation and relaxation algorithms for particle tracking velocimetry. Experiments in Fluids, 50, 135–147. 1 doi:10.1007/s00348-010-0907-z.
- Cammalleri, C., et al., 2020. Global warming and drought impacts in the EU. EUR 29956 EN. Luxembourg: Publications Office of the European Union. doi:10.2760/597045.
- Carbonneau, P.E., et al., 2020. UAV‐based training for fully fuzzy classification of Sentinel‐2 fluvial scenes. Earth Surface Processes and Landforms, 45(13), 3120–3140. doi:10.1002/esp.4955.
- Carbonneau, P.E. and Bizzi, S., 2023. Global mapping of river sediment bars. Earth Surface Processes and Landforms. 48 (6), 1152–1175 doi:10.1002/esp.5540.
- Carrivick, J.L. and Smith, M.W., 2019. Fluvial and aquatic applications of structure from motion photogrammetry and unmanned aerial vehicle/drone technology. Wiley Interdisciplinary Reviews: Water, 6(1), e1328. doi:10.1002/wat2.1328.
- Chen, L. and Wang, L., 2018. Recent advance in earth observation big data for hydrology. Big Earth Data, 2(1), 86–107. doi:10.1080/20964471.2018.1435072.
- Cicchella, D., et al., 2014. Assessment of the topsoil heavy metals pollution in the Sarno River basin, south Italy. Environmental Earth Sciences, 71, 5129–5143.
- Coney, J., et al., 2022. How useful are crowdsourced air temperature observations? An assessment of Netatmo stations and quality control schemes over the United Kingdom. Meteorological Applications, 29(3), e2075. doi:10.1002/met.2075.
- Constantin, S., Doxaran, D., and Constantinescu, Ș., 2016. Estimation of water turbidity and analysis of its spatio-temporal variability in the Danube River plume (Black Sea) using MODIS satellite data. Continental Shelf Research, 112, 14–30. doi:10.1016/j.csr.2015.11.009.
- Corbari, L., et al., 2020. Indoor spectroradiometric characterization of plastic litters commonly polluting the Mediterranean Sea: toward the application of multispectral imagery. Scientific Reports, 10(1), 19850. doi:10.1038/s41598-020-74543-6.
- Crivellaro, M., et al., 2024. Characterization of active riverbed spatiotemporal dynamics through the definition of a framework for remote sens procedures. Remote Sens. 16(1), 184. doi:10.3390/rs16010184.
- de Vos, L.W., et al., 2019. Quality control for crowdsourced personal weather stations to enable operational rainfall monitoring. Geophysical Research Letters, 46(15), 8820–8829. doi:10.1029/2019GL083731.
- Deidda, R., et al., 2007. An automatic system for rainfall signal recognition from tipping bucket gage strip charts. Journal of Hydrology, 333(2–4), 400–412. doi:10.1016/j.jhydrol.2006.09.011.
- Demarchi, L., Bizzi, S., and Piégay, H., 2017. Regional hydromorphological characterization with continuous and automated remote sensing analysis based on VHR imagery and low‐resolution LiDAR data. Earth Surface Processes and Landforms, 42(3), 531–551. doi:10.1002/esp.4092.
- Detert, M., Johnson, E.D., and Weitbrecht, V., 2017. Proof‐of‐concept for low‐cost and non‐contact synoptic airborne river flow measurements. International Journal of Remote Sensing, 38(8–10), 2780–2807. doi:10.1080/01431161.2017.1294782.
- Dietrich, J.T., 2017. Bathymetric structure‐from‐motion: extracting shallow stream bathymetry from multi‐view stereo photogrammetry. Earth Surface Processes and Landforms, 42(2), 355–364. doi:10.1002/esp.4060.
- Dolcetti, G., et al., 2022. Using noncontact measurement of water surface dynamics to estimate river discharge. Water Resources Research, 58(9), e2022WR032829. doi:10.1029/2022WR032829.
- Ehmann, K., Kelleher, C., and Condon, L.E., 2019. Monitoring turbidity from above: deploying small unoccupied aerial vehicles to image in‐stream turbidity. Hydrological Processes, 33(6), 1013–1021. doi:10.1002/hyp.13372.
- Elias, M., Kehl, C., and Schneider, D., 2019. Photogrammetric water level determination using smartphone technology. The Photogrammetric Record, 34(166), 198–223. doi:10.1111/phor.12280.
- Eltner, A., et al., 2021a. Hydro‐morphological mapping of river reaches using videos captured with UAS. Earth Surface Processes and Landforms, 46(14), 2773–2787. doi:10.1002/esp.5205.
- Eltner, A., et al., 2021b. Using deep learning for automatic water stage measurements. Water Resources Research, 57(3), e2020WR027608. doi:10.1029/2020WR027608.
- Eltner, A., et al., 2021c. Using thermal and RGB UAV imagery to measure surface flow velocities of rivers. The International Archives of the Photogrammetry, Remote Sensing and Spatial Information Sciences, 43, 717–722. doi:10.5194/isprs-archives-XLIII-B2-2021-717-2021.
- Eltner, A., et al. eds., 2022. UAVs for the Environmental Sciences: methods and Applications. Darmstadt, Germany: WBG Academic.
- Eltner, A., Sardemann, H., and Grundmann, J., 2020. Flow velocity and discharge measurement in rivers using terrestrial and unmanned-aerial-vehicle imagery. Hydrology and Earth System Sciences, 24(3), 1429–1445. doi:10.5194/hess-24-1429-2020.
- ESA, 2023. Mission Navigator [online]. Available from: https://www.esa.int/ESA/Our_Missions [ Accessed 13 October 2023].
- Etter, S., et al., 2020. Value of crowd‐based water level class observations for hydrological model calibration. Water Resources Research, 56(2), e2019WR026108. doi:10.1029/2019WR026108.
- Ferreira, E., et al., 2017. Automated extraction of free surface topography using SfM-MVS photogrammetry. Flow Measurement and Instrumentation, 54, 243–249. doi:10.1016/j.flowmeasinst.2017.02.001.
- Feurer, D. and Vinatier, F., 2018. Joining multi-epoch archival aerial images in a single SfM block allows 3-D change detection with almost exclusively image information. ISPRS Journal of Photogrammetry and Remote Sensing, 146, 495–506. doi:10.1016/j.isprsjprs.2018.10.016.
- Flener, C., et al., 2013. Seamless mapping of river channels at high resolution using mobile LiDAR and UAV-photography. Remote Sensing, 5(12), 6382–6407. doi:10.3390/rs5126382.
- Fraser, R.N., 1998. Multispectral remote sensing of turbidity among Nebraska Sand Hills lakes. International Journal of Remote Sensing, 19(15), 3011–3016. doi:10.1080/014311698214406.
- Fujita, I., 2017. Discharge measurements of snowmelt flood by space-time image velocimetry during the night using far-infrared camera. Water, 9(4), 269. doi:10.3390/w9040269.
- Fujita, I., Muste, M., and Kruger, A., 1998. Large-scale particle image velocimetry for flow analysis in hydraulic engineering applications. Journal of Hydraulic Research, 36(3), 397–414. doi:10.1080/00221689809498626.
- Fujita, I., Watanabe, H., and Tsubaki, R., 2007. Development of a non‐intrusive and efficient flow monitoring technique: the space‐time image velocimetry (STIV). International Journal of River Basin Management, 5(2), 105–114. doi:10.1080/15715124.2007.9635310.
- Garg, V., Aggarwal, S.P., and Chauhan, P., 2020. Changes in turbidity along Ganga River using Sentinel-2 satellite data during lockdown associated with COVID-19. Geomatics, Natural Hazards and Risk, 11(1), 1175–1195. doi:10.1080/19475705.2020.1782482.
- GESAMP, 2019. Guidelines for the monitoring and assessment of plastic litter and microplastics in the ocean (eds Kershaw P.J., Turra A. and Galgani F.). London: GESAMP Joint Group of Experts on the Scientific Aspects of Marine Environmental Protection, 130 pp. (GESAMP Reports and Studies, No. 99).
- GEWEX, 2018. Gewex. Available from: https://www.gewex.org/ [ Accessed 13 October 2023].
- Gholizadeh, M.H., Melesse, A.M., and Reddi, L., 2016. A comprehensive review on water quality parameters estimation using remote sensing techniques. Sensors, 16(8), 1298. doi:10.3390/s16081298.
- Gnann, N., Baschek, B., and Ternes, T.A., 2022. Close-range remote sensing-based detection and identification of macroplastics on water assisted by artificial intelligence: a review. Water Research, 222, 118902. doi:10.1016/j.watres.2022.118902.
- Goddijn, L.M. and White, M., 2006. Using a digital camera for water quality measurements in Galway Bay. Estuarine, Coastal and Shelf Science, 66(3–4), 429–436. doi:10.1016/j.ecss.2005.10.002.
- Gonçalves, G. and Andriolo, U., 2022. Operational use of multispectral images for macro-litter mapping and categorization by Unmanned Aerial Vehicle. Marine Pollution Bulletin, 176, 113431. doi:10.1016/j.marpolbul.2022.113431.
- González-Fernández, D., et al., 2021. Floating macrolitter leaked from Europe into the ocean. Nature Sustainability, 4(6), 474–483. doi:10.1038/s41893-021-00722-6.
- González-Fernández, D., et al., 2023. Diverging estimates of river plastic input to the ocean. Nature Reviews Earth & Environment, 4(7), 424–426.
- Gonzalo, J., et al., 2018. On the capabilities and limitations of high altitude pseudo-satellites. Progress in Aerospace Sciences, 98, 37–56. doi:10.1016/j.paerosci.2018.03.006.
- Graf, M., et al., 2021. Rainfall estimates from opportunistic sensors in Germany across spatio-temporal scales. Journal of Hydrology: Regional Studies, 37, 100883.
- Groisman, P.Y. and Legates, D.R., 1995. Documenting and detecting long-term precipitation trends: where we are and what should be done. Climatic Change, 31(2–4), 601–622. doi:10.1007/BF01095163.
- Hannah, D.M., et al., 2022. Illuminating the ‘invisible water crisis’ to address global water pollution challenges. Hydrological Processes, 36(3). doi:10.1002/hyp.14525.
- Harley, M.D., et al., 2019. Shoreline change mapping using crowd-sourced smartphone images. Coastal Engineering, 150, 175–189. doi:10.1016/j.coastaleng.2019.04.003.
- Haseler, M., et al., 2018. Monitoring methods for large micro-and meso-litter and applications at Baltic beaches. Journal of Coastal Conservation, 22, 27–50. doi:10.1007/s11852-017-0497-5.
- Hauet, A., et al., 2008. Experimental system for real-time discharge estimation using an image-based method. Journal of Hydrologic Engineering, 13(2), 105–110. doi:10.1061/(ASCE)1084-0699(2008)13:2(105).
- Herold, C. and Mouton, F.: Global flood hazard mapping using statistical peak flow estimates, Hydrol. Earth Syst. Sci. Discuss., 8, 305–363, 2011.
- Hsu, W.L., et al., 2003. October. Real-time vehicle tracking on highway. In Proceedings of the 2003 IEEE International Conference on Intelligent Transportation Systems (Vol. 2, pp. 909–914). Shanghai, China: IEEE.
- Hurley, R., et al., 2023. Measuring riverine macroplastic: methods, harmonisation, and quality control. Water Research, 119902. 235 doi:10.1016/j.watres.2023.119902.
- IAHS, 2023. HELPING Working Groups [online]. IAHS. Available from: https://iahs.info/Initiatives/Topic-for-the-Next-IAHS-decade/helping-working-groups/ [ Accessed 12 October 2023].
- Jaklič, A., et al., 2016. Automatic digitization of pluviograph strip charts. Meteorological Applications, 23(1), 57–64. doi:10.1002/met.1522.
- Jambeck, J.R., et al., 2015. Plastic waste inputs from land into the ocean. Science, 347(6223), 768–771. doi:10.1126/science.1260352.
- James, M.R., et al., 2019. Guidelines on the use of structure‐from‐motion photogrammetry in geomorphic research. Earth Surface Processes and Landforms, 44(10), 2081–2084. doi:10.1002/esp.4637.
- James, M.R., Robson, S., and Smith, M.W., 2017. 3‐D uncertainty‐based topographic change detection with structure‐from‐motion photogrammetry: precision maps for ground control and directly georeferenced surveys. Earth Surface Processes and Landforms, 42(12), 1769–1788. doi:10.1002/esp.4125.
- Jiang, S., et al., 2019. Advancing opportunistic sensing in hydrology: a novel approach to measuring rainfall with ordinary surveillance cameras. Water Resources Research, 55(4), 3004–3027. doi:10.1029/2018WR024480.
- Jocher, G., Chaurasia, A., and Qiu, J., 2023. Ultralytics YOLO version 8. [online]. Ultralytics. [online] https://github.com/ultralytics/ultralytics [Accessed 1 Oct 2023].
- Johnson, E.D. and Cowen, E.A., 2017. Remote determination of the velocity index and mean streamwise velocity profiles. Water Resources Research, 53(9), 7521–7535. doi:10.1002/2017WR020504.
- Kavian, A., et al., 2018. Simulated raindrop’s characteristic measurements. A new approach of image processing tested under laboratory rainfall simulation. Catena, 167, 190–197. doi:10.1016/j.catena.2018.04.034.
- Kidd, C., et al., 2017. So, how much of the Earth’s surface is covered by rain gauges? Bulletin of the American Meteorological Society, 98(1), 69–78. doi:10.1175/BAMS-D-14-00283.1.
- Kinzel, P.J. and Legleiter, C.J., 2019. sUAS-based remote sensing of river discharge using thermal particle image velocimetry and bathymetric lidar. Remote Sensing, 11(19), 2317. doi:10.3390/rs11192317.
- Kirchner, J.W., 2006. Getting the right answers for the right reasons: linking measurements, analyses, and models to advance the science of hydrology. Water Resources Research, 42(3). doi:10.1029/2005WR004362.
- Koparan, C., et al., 2018. In situ water quality measurements using an unmanned aerial vehicle (UAV) system. Water, 10(3), 264. doi:10.3390/w10030264.
- Koparan, C., et al., 2020. Temperature profiling of waterbodies with a UAV-integrated sensor subsystem. Drones, 4(3), 35. doi:10.3390/drones4030035.
- Krüger, R., Karrasch, P., and Eltner, A., 2023. Calibrating low-cost rain gauge sensors for their applications in IoT infrastructures to densify environmental monitoring networks. Geoscientific Instrumentation, Methods and Data Systems Discussions, 2023, 1–20.
- Lacaux, J.P., et al., 2007. Classification of ponds from high-spatial resolution remote sensing: application to Rift Valley Fever epidemics in Senegal. Remote Sensing of Environment, 106(1), 66–74. doi:10.1016/j.rse.2006.07.012.
- Lang, N., et al., 2021. GRAINet: mapping grain size distributions in river beds from UAV images with convolutional neural networks. Hydrology and Earth System Sciences, 25(5), 2567–2597. doi:10.5194/hess-25-2567-2021.
- Latella, M., et al., 2024. Short-term biogeomorphology of a gravel-bed river: integrating remote sensing with hydraulic modelling and field analysis. Earth Surface Processes and Landforms, 49(3), 1156–1178. doi:10.1002/esp.5760.
- Le Coz, J., et al., 2016. Crowdsourced data for flood hydrology: feedback from recent citizen science projects in Argentina, France and New Zealand. Journal of Hydrology, 541, 766–777. doi:10.1016/j.jhydrol.2016.07.036.
- Lebreton, L.C., et al., 2017. River plastic emissions to the world’s oceans. Nature Communications, 8(1), 15611. doi:10.1038/ncomms15611.
- Leduc, P., Ashmore, P., and Sjogren, D., 2018. Stage and water width measurement of a mountain stream using a simple time-lapse camera. Hydrology and Earth System Sciences, 22(1), 1–11. doi:10.5194/hess-22-1-2018.
- Lee, I. and Lee, K., 2015. The Internet of Things (IoT): applications, investments, and challenges for enterprises. Business Horizons, 58(4), 431–440. doi:10.1016/j.bushor.2015.03.008.
- Legleiter, C.J., 2021. The optical river bathymetry toolkit. River Research and Applications, 37(4), 555–568. doi:10.1002/rra.3773.
- Lewis, Q.W. and Rhoads, B.L., 2018. LSPIV measurements of two‐dimensional flow structure in streams using small unmanned aerial systems: 2. Hydrodynamic mapping at river confluences. Water Resources Research, 54(10), 7981–7999. doi:10.1029/2018WR022551.
- Lin, D., Grundmann, J., and Eltner, A., 2019. Evaluating image tracking approaches for surface velocimetry with thermal tracers. Water Resources Research, 55(4), 3122–3136. doi:10.1029/2018WR024507.
- Livoroi, A.H., et al., 2021. On the deployment of out-of-the-box embedded devices for self-powered river surface flow velocity monitoring at the edge. Applied Sciences, 11(15), 7027. doi:10.3390/app11157027.
- Ljubičić, R., Dal Sasso, S.F., and Zindović, B., 2024. SSIMS-Flow: image velocimetry workbench for open-channel flow rate estimation. Environmental Modelling & Software, 173, 105938. doi:10.1016/j.envsoft.2023.105938.
- Lofrano, G., et al., 2015. Which lesson can be learnt from a historical contamination analysis of the most polluted river in Europe? Science of the Total Environment, 524, 246–259. doi:10.1016/j.scitotenv.2015.04.030.
- Lu, Y., et al., 2019. Assessment of global drought propensity and its impacts on agricultural water use in future climate scenarios. Agricultural and Forest Meteorology, 278, 107623. doi:10.1016/j.agrformet.2019.107623.
- Maas, H.G., 2015. On the accuracy potential in underwater/multimedia photogrammetry. Sensors, 15(8), 18140–18152. doi:10.3390/s150818140.
- Maier, P.M. and Keller, S., 2019. September. Application of different simulated spectral data and machine learning to estimate the chlorophyll a concentration of several inland waters. In 2019 10th Workshop on Hyperspectral Imaging and Signal Processing: Evolution in Remote Sensing (WHISPERS). Athens, Greece: IEEE, 1–5.
- Mandlburger, G., et al., 2021. BathyNet: a deep neural network for water depth mapping from multispectral aerial images. PFG–Journal of Photogrammetry, Remote Sensing and Geoinformation Science, 89(2), 71–89. doi:10.1007/s41064-021-00142-3.
- Mandlburger, G., 2022. A Review of Active and Passive Optical Methods in Hydrography. The International Hydrographic Review, (28), 8–52. doi:10.58440/ihr-28-a15.
- Manfreda, S., 2018. On the derivation of flow rating-curves in data-scarce environments. Journal of Hydrogy, 562, pp. 151–154. doi:10.1016/j.jhydrol.2018.04.058.
- Manfreda, S., et al., 2018. On the use of unmanned aerial systems for environmental monitoring. Remote Sensing, 10(4), 641. doi:10.3390/rs10040641.
- Manfreda, S., et al., 2019. New insights offered by UAS for river monitoring. In Applications of small unmanned aircraft systems. Boca Raton, Florida: Taylor & Francis, 211–234.
- Manfreda, S. and Ben Dor, E. eds., 2023. Unmanned Aerial Systems for Monitoring Soil, Vegetation, and Riverine Environments. Amsterdam, The Netherlands: Elsevier.
- Mapiam, P.P., et al., 2022. Citizen rain gauges improve hourly radar rainfall bias correction using a two-step Kalman filter. Hydrology and Earth System Sciences, 26(3), 775–794. doi:10.5194/hess-26-775-2022.
- Marchetti, G., et al., 2022. Mapping riverbed sediment size from Sentinel‐2 satellite data. Earth Surface Processes and Landforms, 47(10), 2544–2559. doi:10.1002/esp.5394.
- Marchetti, G., Manconi, A., and Comiti, F., 2023. Limitations in the use of Sentinel-1 data for morphological change detection in rivers. International Journal of Remote Sensing, 44:21, pp. 6642–6669. doi:10.1080/01431161.2023.2274317.
- Mariani, S. and Bussettini, M., 2021. I dati Sentinel per monitorare i corsi d’acqua (in Italian). In Ecoscienza No. 5. Emilia Romagna, Italy: ARPAE, 28–30.
- Marino, P., et al., 2023. Prototype of an IoT-based low-cost sensor network for the hydrological monitoring of landslide-prone areas. Sensors, 23(4), 2299. doi:10.3390/s23042299.
- McCabe, M.F., et al., 2017. The future of Earth observation in hydrology. Hydrology and Earth System Sciences, 21(7), 3879–3914. doi:10.5194/hess-21-3879-2017.
- Meijer, L.J., et al., 2021. More than 1000 rivers account for 80% of global riverine plastic emissions into the ocean. Science Advances, 7(18), p.eaaz5803. doi:10.1126/sciadv.aaz5803.
- Mekonnen, M.M. and Hoekstra, A.Y., 2016. Four billion people facing severe water scarcity. Science Advances, 2(2), e1500323. doi:10.1126/sciadv.1500323.
- Metzger, J.C., et al., 2017. Vegetation impacts soil water content patterns by shaping canopy water fluxes and soil properties. Hydrological Processes, 31(22), 3783–3795. doi:10.1002/hyp.11274.
- Miglino, D., et al., 2022. Monitoring Water Turbidity Using Remote Sensing Techniques. Environmental Sciences Proceedings, 21(1), 63.
- Montanari, A., et al., 2013. “Panta Rheieverything flows”: change in hydrology and societythe IAHS scientific decade 2013–2022. Hydrological Sciences Journal, 58(6), 1256–1275. doi:10.1080/02626667.2013.809088.
- Montuori, P., et al., 2013. Metals loads into the Mediterranean Sea: estimate of Sarno River inputs and ecological risk. Ecotoxicology, 22, 295–307. 2 doi:10.1007/s10646-012-1026-9.
- Moramarco, T., et al., 2013. An entropy-based method for determining the flow depth distribution in natural channels. Journal of Hydrology, 497, 176–188. doi:10.1016/j.jhydrol.2013.06.002.
- Mosley, M.P. and McKerchar, A.I., 1993. Chapter 8-Streamflow, and D.R. Maidment (Ed.). Handbook of hydrology. New York: McGraw-Hill, 1–8.
- Muste, M., Fujita, I., and Hauet, A., 2008. Large‐scale particle image velocimetry for measurements in riverine environments. Water Resources Research, 44(4). doi:10.1029/2008WR006950.
- Nardi, F., et al., 2022. Citizens AND HYdrology (CANDHY): conceptualizing a transdisciplinary framework for citizen science addressing hydrological challenges. Hydrological Sciences Journal, 67(16), 2534–2551. doi:10.1080/02626667.2020.1849707.
- NASA, 2023. Featured Missions & Projects - Earth Sciences Division (610) [online]. Washington, NASA. Available from: https://science.gsfc.nasa.gov/sed/index.cfm?fuseaction=projects.featured&navOrgCode=610&navTab=nav_about_us [ Accessed 13 October 2023].
- Niedzielski, T., Witek, M., and Spallek, W., 2016. Observing river stages using unmanned aerial vehicles. Hydrology and Earth System Sciences, 20(8), 3193–3205. doi:10.5194/hess-20-3193-2016.
- Niu, C., et al., 2021. Deep learning based regression for optically inactive inland water quality parameter estimation using airborne hyperspectral imagery. Environmental Pollution, 286, 117534. doi:10.1016/j.envpol.2021.117534.
- Noto, S., et al., 2022. Low-cost stage-camera system for continuous water-level monitoring in ephemeral streams. Hydrological Sciences Journal, 67(9), 1439–1448. doi:10.1080/02626667.2022.2079415.
- Outram, F.N., et al., 2014. High-frequency monitoring of nitrogen and phosphorus response in three rural catchments to the end of the 2011–2012 drought in England. Hydrology and Earth System Sciences, 18(9), 3429–3448. doi:10.5194/hess-18-3429-2014.
- Pearce, S., et al., 2020. An evaluation of image velocimetry techniques under low flow conditions and high seeding densities using unmanned aerial systems. Remote Sensing, 12(2), 232. doi:10.3390/rs12020232.
- Peña-Haro, S., et al., 2021. Robust image-based streamflow measurements for real-time continuous monitoring. Frontiers in Water, 3, 175. doi:10.3389/frwa.2021.766918.
- Pereira, B., et al., 2019. Assessment of the geometry and volumes of small surface water reservoirs by remote sensing in a semi-arid region with high reservoir density. Hydrological Sciences Journal, 64(1), 66–79. doi:10.1080/02626667.2019.1566727.
- Perks, M.T., 2020. KLT-IV v1. 0: image velocimetry software for use with fixed and mobile platforms. Geoscientific Model Development, 13(12), 6111–6130. doi:10.5194/gmd-13-6111-2020.
- Perks, M.T., Russell, A.J., and Large, A.R., 2016. Advances in flash flood monitoring using unmanned aerial vehicles (UAVs). Hydrology and Earth System Sciences, 20(10), 4005–4015. doi:10.5194/hess-20-4005-2016.
- Perks, M.T., et al., 2020. Towards harmonisation of image velocimetry techniques for river surface velocity observations. Earth System Science Data, 12(3), 1545–1559. doi:10.5194/essd-12-1545-2020.
- Perumal, T., Sulaiman, M.N., and Leong, C.Y., 2015. October. Internet of Things (IoT) enabled water monitoring system. In 2015 IEEE 4th Global Conference on Consumer Electronics (GCCE) (pp. 86–87). Osaka, Japan: IEEE.
- Peters-Lidard, C.D., et al., 2017. Scaling, similarity, and the fourth paradigm for hydrology. Hydrology and Earth System Sciences, 21(7), 3701–3713. doi:10.5194/hess-21-3701-2017.
- Piégay, H., et al., 2020. Remotely sensed rivers in the Anthropocene: state of the art and prospects. Earth Surface Processes and Landforms, 45(1), 157–188. doi:10.1002/esp.4787.
- Pizarro, A., Dal Sasso, S.F., and Manfreda, S., 2020. Refining image‐velocimetry performances for streamflow monitoring: seeding metrics to errors minimization. Hydrological Processes, 34(25), 5167–5175. doi:10.1002/hyp.13919.
- Poghosyan, A. and Golkar, A., 2017. CubeSat evolution: analyzing CubeSat capabilities for conducting science missions. Progress in Aerospace Sciences, 88, 59–83. doi:10.1016/j.paerosci.2016.11.002.
- Ramírez, S.B., van Meerveld, I., and Seibert, J., 2023. Citizen science approaches for water quality measurements. Science of the Total Environment, 165436. 897 doi:10.1016/j.scitotenv.2023.165436.
- Rango, A., 1994. Application of remote sensing methods to hydrology and water resources. Hydrological Sciences Journal, 39(4), 309–320. doi:10.1080/02626669409492752.
- Redmon, J., et al., 2016. You only look once: unified, real-time object detection. In Proceedings of the IEEE conference on computer vision and pattern recognition, Las Vegas, USA. 779–788.
- Rinaldi, M.et al. 2015. A methodological framework for hydromorphological assessment, analysis and monitoring (IDRAIM) aimed at promoting integrated river management. Geomorphology, 251, 122–136.
- Rode, M., et al., 2016. Sensors in the stream: the high-frequency wave of the present. Environmental Science & Technology 50 19 10297–10307 doi:10.1021/acs.est.6b02155.
- Rodríguez‐Iturbe, I., et al., 2006. Space‐time modeling of soil moisture: stochastic rainfall forcing with heterogeneous vegetation. Water Resources Research, 42(6). doi:10.1029/2005WR004497.
- Roebroek, C.T., et al., 2021. Plastic in global rivers: are floods making it worse? Environmental Research Letters, 16(2), 025003. doi:10.1088/1748-9326/abd5df.
- Roebroek, C.T., et al., 2022. The quest for the missing plastics: large uncertainties in river plastic export into the sea. Environmental Pollution, 312, 119948. doi:10.1016/j.envpol.2022.119948.
- Ross, A. and Chang, H., 2020. Socio-hydrology with hydrosocial theory: two sides of the same coin? Hydrological Sciences Journal, 65(9), 1443–1457. doi:10.1080/02626667.2020.1761023.
- Rossi, D., et al., 2023. Monitoring Braided River-Bed Dynamics at the Sub-Event Time Scale Using Time Series of Sentinel-1 SAR Imagery. Remote Sens. 15, p. 3622. doi:10.3390/rs15143622. 14
- Rowan, G.S. and Kalacska, M. 2021. A review of remote sensing of submerged aquatic vegetation for non-specialists. Remote Sensing, 13(4), 623. doi:10.3390/rs13040623.
- Sabrina, S., Lewis, Q., and Rhoads, B., 2021. Large‐scale particle image velocimetry reveals pulsing of incoming flow at a stream confluence. Water Resources Research, 57(9), e2021WR029662. doi:10.1029/2021WR029662.
- Schmidt, C., Krauth, T., and Wagner, S., 2017. Export of plastic debris by rivers into the sea. Environmental Science & Technology, 51(21), 12246–12253. doi:10.1021/acs.est.7b02368.
- Schreyers, L., et al., 2021. A field guide for monitoring riverine macroplastic entrapment in water hyacinths. Frontiers in Environmental Science, 9, 716516. doi:10.3389/fenvs.2021.716516.
- Seibert, J., et al., 2019. Virtual staff gauges for crowd-based stream level observations. Frontiers in Earth Science, 7, 70. doi:10.3389/feart.2019.00070.
- Sergeant, C.J. and Nagorski, S., 2015. The implications of monitoring frequency for describing riverine water quality regimes. River Research and Applications, 31(5), 602–610. doi:10.1002/rra.2767.
- Sermet, Y., et al., 2020. Crowdsourced approaches for stage measurements at ungauged locations using smartphones. Hydrological Sciences Journal, 65(5), 813–822. doi:10.1080/02626667.2019.1659508.
- Shi, J., et al., 2016. July. The water cycle observation mission (WCOM): overview. In 2016 IEEE International Geoscience and Remote Sensing Symposium (IGARSS). Beijing, China: IEEE, 3430–3433.
- Strelnikova, D., et al., 2023. River flow monitoring with unmanned aerial system. In Unmanned aerial systems for monitoring soil, vegetation, and riverine environments. The Netherlands: Elsevier, 231–269.
- Strobl, B., et al., 2019. The CrowdWater game: a playful way to improve the accuracy of crowdsourced water level class data. PLoS One, 14(9), e0222579. doi:10.1371/journal.pone.0222579.
- Stumpf, A., et al., 2016. Photogrammetric discharge monitoring of small tropical mountain rivers: a case study at Rivière des Pluies, Réunion Island. Water Resources Research, 52(6), 4550–4570. doi:10.1002/2015WR018292.
- Taramelli, A., et al., 2020. An interaction methodology to collect and assess user-driven requirements to define potential opportunities of future hyperspectral imaging sentinel mission. Remote Sensing, 12(8), 1286. doi:10.3390/rs12081286.
- Tauro, F., et al., 2018a. Measurements and Observations in the XXI century (MOXXI): innovation and multi-disciplinarity to sense the hydrological cycle. Hydrological Sciences Journal, 63(2), 169–196. doi:10.1080/02626667.2017.1420191.
- Tauro, F., et al., 2018b. Optical tracking velocimetry (OTV): leveraging optical flow and trajectory-based filtering for surface streamflow observations. Remote Sensing, 10(12), 2010. doi:10.3390/rs10122010.
- Tauro, F., et al., 2022. Assessing the Optimal Stage-Cam Target for Continuous Water Level Monitoring in Ephemeral Streams: experimental Evidence. Remote Sensing, 14(23), 6064. doi:10.3390/rs14236064.
- Tauro, F., Piscopia, R., and Grimaldi, S., 2017. Streamflow observations from cameras: large‐scale particle image velocimetry or particle tracking velocimetry? Water Resources Research, 53(12), 10374–10394. doi:10.1002/2017WR020848.
- Tauro, F., Porfiri, M., and Grimaldi, S., 2016. Surface flow measurements from drones. Journal of Hydrology, 540, 240–245. doi:10.1016/j.jhydrol.2016.06.012.
- Tmušić, G., et al., 2020. Current practices in UAS-based environmental monitoring. Remote Sensing, 12(6), 1001. doi:10.3390/rs12061001.
- Tosi, F., et al., 2020. Enabling image-based streamflow monitoring at the edge. Remote Sensing, 12(12), 2047. doi:10.3390/rs12122047.
- Tramblay, Y., et al., 2020. Challenges for drought assessment in the Mediterranean region under future climate scenarios. Earth-Science Reviews, 210, 103348.
- van Calcar, C.V. and van Emmerik, T.H.M., 2019. Abundance of plastic debris across European and Asian rivers. Environmental Research Letters, 14(12), 124051. doi:10.1088/1748-9326/ab5468.
- van Emmerik, T.H.M. and Schwarz, A., 2020. Plastic debris in rivers. Wiley Interdisciplinary Reviews: Water, 7(1), e1398. doi:10.1002/wat2.1398.
- van Emmerik, T.H.M., et al., 2022. Rivers as plastic reservoirs. Frontiers in Water, 3, 212. doi:10.3389/frwa.2021.786936.
- van Lieshout, C., et al., 2020. Automated river plastic monitoring using deep learning and cameras. Earth and Space Science, 7(8), e2019EA000960. doi:10.1029/2019EA000960.
- Vandaele, R., Dance, S.L., and Ojha, V., 2021. Deep learning for automated river-level monitoring through river-camera images: an approach based on water segmentation and transfer learning. Hydrology and Earth System Sciences, 25(8), 4435–4453. doi:10.5194/hess-25-4435-2021.
- Wang, W., et al., 2022. Content-oriented or persona-oriented? A text analytics of endorsement strategies on public willingness to participate in citizen science, Information Processing & Management, 59(2), 102832. doi:10.1016/j.ipm.2021.102832.
- Wang, C.Y., Bochkovskiy, A., and Liao, H.Y.M., 2023. YOLOv7: trainable bag-of-freebies sets new state-of-the-art for real-time object detectors. In Proceedings of the IEEE/CVF Conference on Computer Vision and Pattern Recognition, Vancouver, Canada/Virtual. 7464–7474.
- Wang, M. and Shi, W., 2007. The NIR-SWIR combined atmospheric correction approach for MODIS ocean color data processing. Optics Express, 15(24), 15722–15733. doi:10.1364/OE.15.015722.
- Wang, X. and Yang, W., 2019. Water quality monitoring and evaluation using remote sensing techniques in China: a systematic review. Ecosystem Health and Sustainability, 5(1), 47–56. doi:10.1080/20964129.2019.1571443.
- Waterbase - Water Quality ICM, 2022. European Environment Agency. https://www.eea.europa.eu/en/datahub/datahubitem-view/fbf3717c-cd7b-4785-933a-d0cf510542e1 [Accessed October 2023].
- Westoby, M.J., et al., 2012. ‘Structure-from-Motion’photogrammetry: a low-cost, effective tool for geoscience applications. Geomorphology, 179, 300–314. doi:10.1016/j.geomorph.2012.08.021.
- Wheater, H.S. and Gober, P., 2015. Water security and the science agenda. Water Resources Research, 51(7), 5406–5424. doi:10.1002/2015WR016892.
- Wollschläger, U., et al., 2017. The Bode hydrological observatory: a platform for integrated, interdisciplinary hydro-ecological research within the TERENO Harz/Central German Lowland Observatory. Environmental Earth Sciences, 76, 1–25. 1 doi:10.1007/s12665-016-6327-5.
- Young, D.S., Hart, J.K., and Martinez, K., 2015. Image analysis techniques to estimate river discharge using time-lapse cameras in remote locations. Computers & Geosciences, 76, 1–10. doi:10.1016/j.cageo.2014.11.008.
- Zacharias, S., et al., 2011. A network of terrestrial environmental observatories in Germany. Vadose Zone Journal, 10(3), 955–973. doi:10.2136/vzj2010.0139.
- Zanella, A., et al., 2023. January. Internet of things for hydrology: potential and challenges. In 2023 18th Wireless On-Demand Network Systems and Services Conference (WONS). Madonna di Campiglio, Italy: IEEE, 114–121.
- Zhang, C., et al., 2016. October. On estimating air pollution from photos using convolutional neural network. In Proceedings of the 24th ACM international conference on Multimedia, Amsterdam, The Netherlands. 297–301.