?Mathematical formulae have been encoded as MathML and are displayed in this HTML version using MathJax in order to improve their display. Uncheck the box to turn MathJax off. This feature requires Javascript. Click on a formula to zoom.
Abstract
The adoption of agricultural technologies like irrigation is influenced by complex contextual and socio-psychological factors. This study used the socio-psychological RANAS framework to examine the factors impacting irrigation adoption in Maharashtra (India). Logistic regression modelling was conducted based on cross-sectional surveys in 2019 and 2022, with interim interventions promoting risk-awareness and irrigation technology training. Effects of the interventions on the psychological variables in 2022 were corrected using instrumental variable regression. While micro-irrigation adoption rose from 36.9% to 62.8%, overall irrigation counterproductively decreased from 81.6% to 70.4%. Results indicated that wealth and risk-aversion remained relevant, while self-perceived ability and attitude towards irrigation became non-significant to irrigation adoption. This study highlights the unintended consequences of interventions and the necessity to also transform attitudes, and promote psychological ownership and trust to sustain irrigation technology adoption behaviour. These results could support stakeholders (policy makers, water authorities, NGOs) in designing and implementing more sustainable interventions.
Disclaimer
As a service to authors and researchers we are providing this version of an accepted manuscript (AM). Copyediting, typesetting, and review of the resulting proofs will be undertaken on this manuscript before final publication of the Version of Record (VoR). During production and pre-press, errors may be discovered which could affect the content, and all legal disclaimers that apply to the journal relate to these versions also.1. Introduction
The world population was 8 billion in 2022 and is expected to rise up to 8.2 billion by 2025 (United Nations, 2022). This implies an ever growing pressure on food production and water resources both for agricultural and other uses such as for domestic and industrial purposes, which is further exacerbated by changing climate and variability in the availability of water worldwide. Agriculture uses nearly 70% of global freshwater resources (World Bank, 2022), making it by far the main user of water. Further, due to the growing agricultural demand for water and increasing uncertainty about water availability, water saving practices and technologies such as efficient irrigation have been proposed among key demand side adaptation mechanisms (Garrick et al., 2020). However this adaptation strategy critically depends on solutions being taken up by large numbers of farmers.
Farmers are key decision makers in the adoption of agricultural best practices, such as irrigation (among others). They are also the most influential stakeholders. Agriculture employs about 866 million people (about 27% of the global workforce in 2021), many of them being smallholders, with an overall value addition of 3.6 trillion USD in 2020 (FAO, 2022). Understanding the barriers of successful adoption and the effectiveness of interventions to ameliorate such barriers are therefore key to improved planning and dissemination of farm management technologies (Mariano et al., 2012), such as irrigation. Often these barriers are socioeconomic such as income level, availability of dependents or labour, and smaller land sizes (Hatch et al., 2022; Tesfaye et al., 2021; Wang et al., 2016).
Factors such as education, age, family size, social capital (via formal and informal networks), land ownership status and access to credit have been reported as significant for the adoption of different irrigation technologies (Gautam et al., 2024; Jordán & Speelman, 2020; Wang et al., 2016; He et al., 2007; Kulshreshtha and Brown, 1993). The importance of access to and quality of extension services has been highlighted by several studies (Abdulai et al., 2011; Wang et al., 2016, He et al., 2007), while it has also been claimed that extension service can be more effective during the initial phase of technology adoption (Gautam et al., 2024).
Yet many deeper cognitive factors (such as farmer attitudes towards behavioural outcome) have also been identified as factors that influence farmers in adopting irrigation (Castillo et al., 2021; Kulshreshtha and Brown, 1993). Positive attitudes towards technology adoption, risk perceived about water scarcity as well as new technologies, perceived control over the behaviour, and norms have also explained adoption of different irrigation technologies (Gautam et al., 2024; Nair and Thomas, 2022; Castillo et al., 2021; Jordán & Speelman, 2020; He et al., 2007; Kulshreshtha & Brown, 1993).
Among more behavioural science driven studies, Castillo et al. (2021) used the Theory of Planned (TBP) to explain the adoption of pressurized irrigation technology. The TPB claims that the ‘intention of a behaviour acts as a mediator of’ attitude (towards behavioural outcomes), subjective norms (perceptions about social pressure) and perceived behavioural control (of the ability to carry out a particular behaviour) (Castillo et al., 2021; Fishbein and Ajzen, 2011). Adoption was affected by intention, which mediates the effect of (social) norms, attitudes and perceived control (Castillo et al., 2021). Nejadrezaei et al. (2018) used the Unified Theory of Acceptance and Use of Technology (UTAUT, Venkatesh et al., 2003, 2016) to also explain pressurized irrigation technology adoption. The UTAUT explains the user’s intention to use a technology and usage behaviour, and integrates constructs across eight models (Nejadrezaei et al., 2018). For behavioural intentions, performance expectancy of the system as well as social influence of others on one’s behaviour was found to be significant, and for the behaviour itself, facilitating conditions related to the availability of resources, support, and infrastructure were important (Nejadrezaei et al., 2018).
A review considering studies on micro-irrigation technology adoption in India has reported different types of factors such as household (e.g., demographic, socioeconomic and behavioural characteristics), farm (including cultivation practices and equipment) and institutional (such as financial and technical support) specific factors (Nair and Thomas, 2022). In a study conducted earlier, Hatch et al. (2022) found that, in addition to socioeconomic characteristics, awareness related factors influence decisions to adopt. Other factors could include farmers’ perception of drought risk, their perception of what other farmers in their neighbourhood think are good practices, confidence in their own ability and discipline to use related technology or practices regularly.
Beyond understanding the barriers to successful adoption, behavioural evidence-based interventions are often missing in attempts to improve adoption (Balasubramanya & Stifel, 2020). By evidence-based interventions it is meant that the interventions incorporate learnings about the various factors that inhibit farmers from using the technology (e.g., irrigation). For example, interventions such as special training, subsidies or transferring of institutional arrangements such as property rights or “ways to do things” from one country to another are often put in place to encourage the adoption of irrigation practices (Balasubramanya & Stifel, 2020, Meinzen-Dick, 2014). However, such interventions may temporarily build trust in the agencies that are implementing interventions and hide the needs to change attitudes and abilities that are needed towards sustained irrigation adoption. For example, it has been argued that Chinese government led environmental governance has led to serious dependence of the public on such government initiatives (psychology of dependence) and as a result lower community adoption of conservation interventions in the long run when the government support would no longer be around (Ni et al., 2021). As a result, sustainable adoption may not be realized if the trust is not converted back to, individual or collective, psychological ownership of farmers. This can be achieved by building their capacities and abilities to continue using the (e.g., irrigation) technology (Contzen et al., 2023).
The role of community participation towards ownership has been observed in the cases of water kiosks and other rural water supply infrastructures such as piped water systems in Kenya (Contzen & Marks, 2018, Marks & Davis, 2012). In the case of irrigation systems it has been similarly argued that any institutional change towards successful community wide adoption should be more organic (Meinzen-Dick, 2014). That is, it should build on existing norms and practices. More appropriate would be the interventions that encourage peer-to-peer communication between adopters and non-adopters, publicize the utility of adopting practices such as irrigation in the face of higher chances of drought, or continued focus on strategies to build psychological ownership.
One key challenge to put such knowledge into practice is to use appropriate methods to understand farmer behaviour and to incorporate the understanding in designing the interventions to improve adoption (Balasubramanya & Stifel, 2020, López-Felices et al., 2023). This paper focuses on a model based on socio-psychological theories of farmers’ water use behaviour to understand the barriers to adoption and whether interventions that are deemed to improve adoption actually ameliorate the barriers. Instead of assuming farmers to be rational decision makers, this paper assumes farmers are driven by cognitive factors such as perceptions of risk, ability and norms (Hatch et al., 2022). By using two cross sectional surveys on statistically similar samples, intervened by a set of standard interventions designed before the cross-sectional surveys, this paper deploys methods to understand the factors behind the adoption of irrigation and the effects of the interventions on factors that facilitate the adoption. It then discusses how the interventions could be better designed based on the lessons thus learned.
2. Methodology
The model of choice to understand the factors behind the adoption of irrigation is the RANAS (Risk- Attitude- Norms - Ability- Self regulation) model, which subsumes other behavioural models such as the Theory of Planned Behaviour (Callejas Moncaleano et al., 2021; see however e.g., Contzen et al., 2023 for its shortcomings and Hatch et al., 2022 for applications of other behavioural theories). The model is populated by two cross sectional surveys conducted in 2019 and 2022 in four districts of the state of Maharashtra in India, intervened by a set of standard interventions designed before the cross-sectional surveys to improve adoption. The paper also uses a methodological innovation to filter out any effect of the interventions that promote adoption, on the cognitive factors themselves, so that the effect of the latter on the former could be estimated with less bias.
This section first describes the surveys and the RANAS model populated by the data collected from the survey. It then discusses logistic regression that is used to implement the RANAS model in order to interpret adoption behaviour across the two surveys. Additionally, the analysis of the second cross sectional survey uses a two-stage, so called instrumental variable, regression to filter out the effect of reverse causality of adoption on factors driving the behaviour itself. This is then explained. Parts of the overall methodology are modified from a protocol developed to conduct RANAS based sociohydrological surveys (Adla et al., 2023).
2.1. Study area
The study area comprises Vidarbha region in the eastern part of Maharashtra state of India, which is characterized primarily by semi-arid climate (Aher & Yadav, 2021). The study area is described in detail by van Wirdum et al. (2019), with respect to its geology and hydrology, climate, and agricultural practices. Maharashtra’s geology is typically characterized by igneous basaltic aquifers, which can store water only in secondary permeable structures (like fractured spaces), thus limiting the availability of groundwater. The four major rivers running through Maharashtra (Narmada, Tapti, Godavari and Krishna) are non-perennial, monsoonal rivers. The average annual rainfall is around 800 mm, most of which may occur in the summer monsoon season (June through September), and may vary locally (van Wirdum et al., 2019).
A mapping of soil characteristics conducted in the study area using a 5 km ✕ 5 km gridded dataset from the Indian Space Research Organization https://bhuvan.nrsc.gov.in/) reveals that the dominant soils textural classes in the study area are clay, clay loam, and sandy loam (van Wirdum et al., 2019). These soils, and the study region, are well-known for cotton cultivation, and also grow other crops such as cereals, pulses, oilseeds and sugarcane (Pande and Savenije, 2016; Mishra, 2006). India is the largest cotton producer in the world and Maharashtra is the largest cotton producing state in India (USDA ERS, 2022; ICAR-CICR, 2018). However, both India as well as specifically Maharashtra have relatively low cotton yields (Khadi et al., 2010). In this context, it is notable that 67% of India’s cotton cultivation is rainfed (Ministry of Textiles, 2022), and within Maharashtra, this increases to 90% (Blaise, 2017). Cotton is primarily grown in the monsoon season, and is water intensive, needing between 700-1200 mm/year (Hussain et al., 2020; Wirdum et al., 2019). Hence, the lack of supplemental irrigation (in combination with other factors) can lead to severe agricultural distress, particularly in smallholder farmers (Pande and Savenije, 2016). Within Maharashtra, Vidarbha is challenged by difficult environmental conditions for agriculture, which includes drought-proneness (Swain et al., 2022; Somni et al., 2021), and low farmer incomes, often below the poverty line (Hatch et al., 2022).
This study used data from two surveys conducted in Vidarbha in 2019 and 2022 respectively. Four districts were chosen in the region - Amravati, Yavatmal, Nagpur and Wardha ().
2.2. Cross sectional surveys
In 2019, Hatch et al. (2022) conducted semi-structured interviews of 345 households to understand behavioural and socio-economic drivers of irrigation adoption. Interventions were implemented from 2019 onwards aimed towards achieving water-efficient, sustainable cotton production via the adoption of improved agricultural practices (RVO, 2022). The interventions were designed to raise awareness about the consequences of water scarcity and encompassed comprehensive training on best practices in organic cotton cultivation, alongside the adoption of efficient agricultural water use techniques.
In 2022, semi-structured interviews were conducted in 419 households in November and December to understand changes in farmer perspectives towards irrigation adoption. Both samples were randomly selected, with the inclusion criteria stipulated that selected farmers were exposed to the investigated intervention. Both the samples were representative of the farmers in the region who have been part of these interventions, with similar farm sizes (p-value = 0.78) and annual farm incomes (p-value = 0.77).
Both questionnaires were developed in English and translated into Marathi (the regional language). They were digitized into mobile phone based applications using the Kobo ToolBox/Kobo collect (Lakshminarasimhappa, 2022). The complete survey questionnaire for 2022 is included in Appendix A; for the survey questionnaire of 2019 the readers are referred to Hatch et al. (2022). Independent Marathi-speaking surveyors conducted a trial run of the questionnaire, and their feedback was incorporated into the final questionnaire. A questionnaire was developed with both quantitative and qualitative questions about demographic details (family members, education, etc.), socio-economic details (land area and tenure, etc.), agricultural inputs (seeds, water, fertilizers, pesticides, labour, etc.), agricultural outputs (yields, selling prices, etc.), and financial information such as income (on and off-farm), expenditures, loans and insurance. Detailed questions were asked about water sources and the irrigation technology used by the farmer if they irrigated their cotton farms. Questions were also asked about the farmers’ perceptions - about adoption of irrigation systems, factors leading to crop failure and success, and their views about relevant agricultural institutions (such as agricultural extension providers). The final survey was conducted in Marathi on a voluntary basis with the only precondition that farmers were cultivating cotton.
Data related to prolonged and consecutive dry years (which might influence irrigation adoption, was included via the Standardized Evapotranspiration Index (SPEI-12, Vicente-Serrano et al., 2010) computed using an open-source Python package (Vonk, 2024). Further, to indicate consecutive dry years, the 5-year moving average of SPEI-12 was also computed. These two indicators were calculated for each farm location by interpolating and (inverse-distance-weighted) averaging the three nearest gridded data points derived from the Power dataset from National Aeronautics and Space Administration (NASA) Langley Research Center (LaRC) (NASA, 2023).
The overall behavioural outcome was the adoption of irrigation; 280 (81.6%) and 295 (70.4%) farmers adopted irrigation based on the 2019 and 2022 surveys, respectively. The variables which were used to describe factors that might lead to adoption included financial literacy and access. Particularly for smallholders, financial literacy and access can limit the capacity to invest in technologies (e.g., for irrigation), which can increase yields and incomes (World Bank, 2014). They were gauged via questions on securing agricultural loans (in particular identifying ‘safe’ sources of loans such as government banks) and availing crop insurance.
Variables were treated appropriately as numerical or categorical (nominal or ordinal), based on their variation. For example, income was treated as a numerical variable, water sources were treated as nominal-categorical variables, and educational levels were treated as ordinal-categorical variables. All perception-based questions were scored on a five-point Likert scale. The outcome variable of adoption/non-adoption of irrigation had only two possible outcomes and was also treated as an ordinal categorical variable. The following sections outline details of the data collected during the 2022 survey, which were compared with the corresponding data collected in the 2019 survey (Hatch et al., 2022).
2.3. Descriptive statistics
Descriptive statistics of RANAS factors were generated, prior to building a logistic regression model, to estimate the change in these factors within the three years (between the surveys) during which the various interventions were implemented. For every RANAS factor, the means of the Likert-scale measures were calculated. Subsequently, the means of the RANAS factors from the 2019 and 2022 surveys were compared. Statistical t-tests were used to identify variables whose respective means were significantly different at the 99% confidence level (i.e., α = 0.01), and only these variables were subsequently discussed.
2.4. RANAS psychological factors
According to psychological theories, all human behaviour is determined by the processes in people’s minds. Knowledge is activated, beliefs and emotions rise to the fore, and an intention to perform a particular behaviour emerges, eventually resulting in observable behaviour (Mosler, 2012). In other words, these processes, also termed as behavioural factors, determine behaviour. The Risks, Attitudes, Norms, Abilities, and Self-regulation (RANAS) model is an approach to evaluate influential behavioural factors and design behaviour change strategies to change influential factors of specific behaviours in specific populations (Mosler, 2012). The model is divided into five factor blocks favourable to the behaviour of interest that consist of risk factors, attitudinal factors, normative factors, ability factors, and self-regulation factors.
The risk factors block contains all factors that deal with an individual’s understanding and awareness of the risk of not having enough water for agriculture. Attitude factors express a positive or negative stance toward a behaviour (in this case, the adoption of irrigation technologies). Norm factors represent convictions about the incidence of a behaviour and how the social network thinks about the behaviour. Ability factors represent attitudes an individual believes they must have to acquire the behaviour. Attitudinal, norm and ability factors are described by The Theory of Planned Behaviour (Ajzen, 1991). Self-regulation factors (Albarracin et al., 2005) are responsible for the continuance and maintenance of the behaviour.
Within the Risk factors, a distinction is made between perceived vulnerability and perceived severity (Floyd et al., 2000). Perceived vulnerability is a farmer’s personal belief about the possibility of facing water scarcity themselves. Perceived severity is the farmer’s judgment of how severe the consequences of water scarcity could be. Additionally, a farmer should also have an understanding (through their knowledge) of how they could be affected by the lack of available water for farming, e.g., knowing the possibilities for potential yield loss.
The attitudinal factors encompass instrumental beliefs or outcome expectancies, such as the costs in money, time, and effort, as well as the benefits, such as savings or other advantages, associated with adopting a new behaviour, such as using a specific irrigation system (Mosler and Contzen, 2016;). Attitudes also have an affective component (Mosler, 2013). Affective appraisals or beliefs are the feelings that emerge when someone performs or thinks about a particular behaviour.
Various types of norms are relevant when considering norm factors. Descriptive norms pertain to people’s perceptions of the behaviours that others typically exhibit, while injunctive norms concern people’s perceptions of what behaviours are typically approved or disapproved of by their relatives, friends, or neighbors (Cialdini et al., 2006, Schultz et al., 2007). Personal norms represent an individual’s beliefs about what they ought to do (Schwartz, 1977), and may contradict the other norms.
Ability factors refer to an individual’s level of confidence in their ability to perform a particular behaviour. To meet this condition, a person must possess action knowledge, which means they know how to perform the behaviour (Frick et al., 2004). Moreover, a positive self-efficacy is essential: the belief in one’s capacity to plan and execute the necessary actions to manage potential situations (Locke, 1997). Two additional types of self-efficacy are significant in this category. Maintenance or coping self-efficacy involves beliefs about one’s ability to overcome obstacles that arise during the maintenance of the behaviour, and recovery self-efficacy relates to the experience of failure and the ability to recover from setbacks (Schwarzer, 2008).
Lastly, self-regulation or self-management factors (Albarracín et al., 2005, Bandura, 2004, Schwarzer, 2008) help individuals deal with conflicting goals and distracting cues when attempting to initiate and sustain a behaviour (Gollwitzer & Sheeran, 2006). Action control refers to a tactic where the ongoing behaviour is continually assessed based on a predetermined standard (Schwarzer, 2008). On the other hand, action planning involves thoughts on how to establish the behaviour by identifying when, where, and how to execute it (Gollwitzer & Sheeran, 2006). Coping planning refers to anticipating potential barriers and devising ways to overcome them (Schwarzer, 2008). To maintain the behaviour, an individual must remember it and make a commitment to continue it (Tobias, 2009).
The RANAS based survey questions designed to collect information regarding perception at a sub-factor level are listed in . The 2019 survey collected data on fourteen RANAS sub-factors, whereas the 2022 survey collected data on seventeen RANAS sub-factors. Hence, the comparative analysis between two years of data was done based on the fourteen common questions.
2.5. Logistic regression
The statistical method selected for this classification problem (of adoption/non-adoption of irrigation) was logistic regression, which is used to predict a binary outcome (yes/no; 0/1; etc.). This prediction is based on a set of independent variables, which in this case were the socio-economic and psychological RANAS characteristics of the surveyed farmers. Logistic regression predicts the likelihood of ‘yes’ or ‘no’ outcomes. The dependent variable was classified as either ‘yes’, if a farmer stated that they are using any type of irrigation (i.e., sprinkler, drip, or flood irrigation), and ‘no’, if they relied only on rainfall.
After data pre-processing, two assumptions of logistic regression were checked. First, the assumption of minimal correlation between the independent predictor variables was verified by calculating Pearson correlation coefficients between different pairs of predictor variables. Next, to ensure large enough sample sizes for meaningful results, low events per variable (EPV) can lead to problems such as biased regression coefficients (Peduzzi et al., 1996). Hence, the “one in ten” rule was checked: for every ten events, one predictive variable can be studied; where an event is defined as the size of the smallest of the outcome categories (Peduzzi et al., 1996). The number of events for 2019 and 2022 were 62 and 124 respectively, which implies 6 and 12 predictors respectively, according to the thumb rule. However, this rule has been challenged by studies that have mentioned it as too conservative (Vittinghoff & McCulloch, 2007) or identified total sample size as other factors which lead to low EPV issues (van Smeden et al., 2016). Considering this and the reasonable sample sizes (n=343 and n=419 in 2019 and 2022, respectively), 14 variables were used as predictors in the logistic regression.
A logistic regression model was created using Python libraries (Kramer, 2016, Seabold & Perktold, 2010) which computed the odds ratio of adoption (relative to non-adoption) of the behaviour in question (irrigation adoption). The significant predictors were detected at significance level, α = 0.05. The logistic regression was conducted in the following manner; a schematic is provided in .
The relationship between the independent variables () and the binary outcome (, with two possible outcomes: adoption and non-adoption) was modeled with a linear equation:
where are regression coefficients corresponding to
,
is a constant term, and
is the number of independent variables (or predictors). The weighted sum (from the right-hand side of Equationequation 2)
(2)
(2) was transformed into a probability using a logistic function (Kumar & Rath, 2016):
where is the probability of occurrence of an event given the set of predictors. The logistic regression model is a linear model for the logarithm of the odds associated with an event (Murat, 2019). The log odds ratio was used to observe the effect of a unit change in any particular predictor (
in the following equation):
The outputs of the logistic regression model were logits (or log-odds) and were obtained by building a logistic regression model using the Scikit-learn library of the Python programming language (Pedregosa et al., 2011).
2.6. Endogeneity in irrigation adoption behaviour
In regression, endogeneity (or reverse causality) occurs when the dependent variable influences the independent predictor variables (see ). This can lead to a correlation between the independent variables and the error terms (Daniel et al., 2022), result in biased regression coefficients, and consequently lead to incorrect interpretation of results (Daniel et al., 2022, Hill et al., 2021). Since the interventions implemented to encourage adoption of irrigation and other best practices between the 2019 and 2022 surveys influence the adoption, it in turn may affect the RANAS psychological factors leading to possible reverse causality.
The instrumental variable (IV) approach was used to address endogeneity and avoid bias in estimating regression coefficients (Hill et al., 2021). Previous studies have claimed that culture and institutions can influence economic and technological development. Particularly, institutions can be vital in shaping individuals’ motivations to innovate and invest (Tabellini, 2010). Influenced by geography, historical events, or political systems, they underline how the characteristics of each place could affect people’s psychology and generate regularity in behaviour (Alesina & Giuliano, 2015, Greif, 2006). Institutions are interpreted to represent social norms, but since they are long lasting, they can be considered as “slow-moving variables” which can influence individual perceptions (Legros & Cislaghi, 2020, Pande et al., 2020, Tabellini, 2010). For example, Daniel et al. (2022) used “quality” of institutions as measured via multi-dimensional governance indicators (Kaufmann et al., 2010) as influencing individual perceptions of risks and attitudes directly, and adoption of household water treatment technology indirectly, to break the reverse causality effect of the latter on the former. Particularly, World Governance Indicators (WGI) (Kaufmann et al., 2010) were used as IVs in the comparative study of HWT adoption in eight studies, where the WGI indicator values were available at country level. This study, however, designed questions at household level to populate various IVs based on three relevant dimensions of governance - governance effectiveness, regulatory quality, and voice and accountability based on the findings of Daniel et al., (2022). provides the variables and related questions introduced in the 2022 surveys.
The IV approach was implemented using a two-stage regression process. In the first stage, IVs are used to predict RANAS variables () via ordinary least squares (OLS) linear regression. The predicted RANAS variables (
) for each RANAS factor (
) were obtained as follows:
Here and
represent the
RANAS factor (e.g.
represents) and its predicted value respectively. and
represent the regression constant and coefficients corresponding to the
instrument variable
for the
RANAS factor and
represents the residual terms of the regression.
In the second stage (called “instrumentalized” logistic regression), the predicted RANAS variables are used to estimate the impact on the dependent outcome variable, i.e., irrigation adoption, as given in EquationEquation (10)(10)
(10) .
IVs that are valid need to satisfy two conditions, (i) relevance: they should affect the endogenous predictors (i.e., RANAS factors), and (ii) exogeneity: IVs should not directly influence behaviour (Hill et al., 2021). Relevance was verified by testing the correlation between the IVs and the RANAS factors. Exogeneity was tested by examining the significance of IVs in the second stage of the regression, by verifying if they were not significant predictors in the results of the “instrumentalized” logistic regression. Since the IVs were designed prior to any interviews with farmers, to test their validity, these empirical tests identify IVs that are valid (that satisfy the two conditions) from the set of originally designed (intended) IVs.
2.7. Logistic regression performance metrics
The performances of the models developed for both surveys (including the two-stage regression model in 2022) were assessed using indicators commonly employed for classification problems (Edo et al., 2023). The data were partitioned into training and testing sets using simple random sampling, with each data point having an equal probability of being included in each set. 80% and 20% data were randomly assigned for training and testing respectively, for both surveys.
The performance indicators (Edo et al., 2023; Witten et al., 2011) were based on the prediction of positives (irrigation adopters) and negatives (non-adopters) and how they compared with observations from the data. Accuracy indicates the proportion of the total predictions that are correct. Precision is the proportion of true positive predictions. Recall is the proportion of true positives that are correctly predicted as positive. The F1-score is the harmonic mean of precision and recall, and hence represents a trade-off between the two indicators. The range of possible values and ideal measure of each of these indicators is between 0 and 1, and 1, respectively.
3. Results
3.1. Descriptive statistics of the 2019 and 2022 surveys
presents the descriptive statistics of the data collected during both surveys.
3.1.1. Financial literacy and access
In 2019 (n=343) and 2022 (n=419) respectively, about 98% and 98.5% of the respondents were male with an average age of 46±13 and 49±12 years respectively. The mean total area owned and used for farming was 7 acres and most farmers were below 10 acres in both surveys. Out of this, an average of nearly 5 acres and 4 acres was used for cotton growing respectively. Of those who responded in both surveys, about 96% of all farmers grew other crops besides cotton (which included legumes like lentils and soybean and different vegetables). From crops alone, the average farmer reported earning more than 2,20,900 INR/year (INR is the Indian national currency, rupees; 1 INR ≈ 0.01 €) and 2,09,911 INR/year respectively, with total annual crop expenses of just over 1,25,254 INR and 1,26,495 INR respectively, in 2019 and 2022. About 84% and 88% of the farmers reported that they had accrued loans in 2019 and 2022, respectively. The median cotton yield was 6 quintal/acre (1 quintal = 100 kg) in 2019, and 13 quintal/acre and 5 quintal/acre for conventional and organic cotton in 2022 (when this distinction was made).
3.1.2. Outcomes related to irrigation behaviour
There was a marked increase in the adoption of sprinkler systems, from 31.6% in 2019 to 49% in 2022 (). The reported average cost of the sprinkler irrigation system was 33,289 INR/acre. Additionally, this cost was also split into its components, and the average reported yearly costs of installation, maintenance, and repair were 2,847 INR/acre/year, 1,327 INR/acre/year, and 1,498 INR/acre/year, respectively. The corresponding reported percentage of drip irrigation systems among the respondents increased from 5.3% to 13.8%. The average total cost of purchasing a new drip irrigation system was reported as 42,090 INR/acre. The average reported yearly costs of its components were 11,482 INR/acre/year for installation, 1,515 INR/acre/year for maintenance, and 1,601 INR/acre/year for repair. Interestingly, rainfed agriculture reportedly increased from 17.3% to 28.1%.
The overall increase in the adoption of reported micro-irrigation systems from 36.9% to 62.8% was balanced by a reduction in the reported frequency of usage of furrow irrigation technology, which decreased from 44.8% to 7.7%. This perhaps was a consequence of the intervention activities, which included training of efficient irrigation techniques, including the adoption of micro-irrigation. Overall, it is apparent that better cultivation practices (related to the adoption of more efficient micro-irrigation technology) were adopted by more farmers in general.
3.2. Changes in RANAS factors from 2019 to 2022
The significant changes in the perceived psychological variables moving from 2019 towards the 2022 survey data are shown in . Farmers’ perception of severity of the effect of water scarcity on crop loss reduced in 2022 as compared to 2019 (e.g., there was a perceived increase in water supply as compared to the amount needed for agriculture). Farmers perceived a stronger social norm about the adoption of irrigation technologies by others. Farmers also perceived that yield improvements were lower in 2022 compared to 2019. That is, while the perception of the supplied water amount increased along with the perception of the proportion of people using irrigation and of lower crop loss due to water shortage, the perceived increase in yield achieved by irrigation declined significantly.
The perceived self-responsibility of the farmer to organize their own water source increased. However, the perceived confidence in operating irrigation systems slightly decreased and the perceived time taken for irrigation increased. This may imply that the interventions in the form of training have led to more realistic self-perception of farmers’ perceived self-ability to operate the irrigation systems (i.e., they may have been overconfident of their own abilities to operate such systems during the 2019 survey before the interventions). Another implication could be that there is a need to ensure long-term uptake of the training objectives.
3.3 Logistic regression results based on 2019 and 2022 surveys
The data from the 2022 survey were treated with a two-stage, instrumental variable approach to account for the endogenous effect of the intervention on the psychological variables. Section 3.3.1. presents the results of the logistic regression without considering endogeneity, as well as testing the exogeneity assumption of the instrument variable approach. Section 3.3.2. presents the results of the first stage regression. Finally, a comparison of logistic regression results of the 2019 and (two-stage, instrumentalized) 2022 data is given in Section 3.3.3.
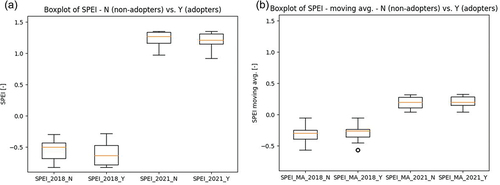
The two drought related indicators, SPEI and their corresponding moving averages taken for the 5 previous years including the current year (SPEI_MA), which were computed at a farm level, were also included in all the following analyses. The variation of SPEI and SPEI_MA for both farmers who adopted irrigation (adopters) and those who didn’t (non-adopters) corresponding to both the surveys is depicted in Figure A1. SPEI increased (significantly) from the 2019 survey (2018 data) to the 2022 survey (2021 data), for both SPEI and SPEI_MA, while irrigation adoption decreased significantly. Within each survey, non-adopters had significantly higher mean SPEI (and mean SPEI_MA) than adopters except the difference between the SPEI_MA of adopters and non-adopters in 2018, based on t-test conducted for unequal variances.
Moreover, when SPEI and SPEI_MA were introduced in both regressions, they were both found not significant (α=0.05) in explaining adoption. Hence, it was concluded that (prolonged) drought was not a significant factor in explaining irrigation adoption.
3.3.1. Logistic regression on 2022 survey without considering endogeneity
presents the results of three logistic regressions for irrigation adoption based on the 2022 survey data: the standard regression without considering IVs, second stage regression (considering updated RANAS factors), as well as testing the exogeneity condition for the instrument variable approach. It presents the regression coefficients () along with the level at which they were significant (***significant<0.01, **significant<0.05, and *significant<0.10), categorized into socio-economic variables (SECs), exogenous RANAS factors, endogenous predicted RANAS factors (only for the second stage and exogeneity testing), and instrument variables (only for exogeneity testing).
3.3.2. Updating RANAS factors for 2022 survey considering endogeneity
presents the results of the first stage linear regressions performed using the 2022 survey data on each RANAS sub-factor on instrument variables (IVs). Two regressed sub-factors had significant coefficients of determination (, i.e., R4 (‘confidence of having enough water in the future’,
) and At1 (‘increase in yield achieved by irrigation’,). Out of these, only one sub-factor, R4, was significant during the standard regression performed without considering endogeneity (in ). Hence this was then regressed on all the IVs. Subsequently, updated predictions for R4 were used along with other RANAS and SEC variables in their original form (as collected during the survey), to then conduct the second stage logistic regression, with irrigation adoption as the outcome variable ().
Based on , the impact of the risk sub-factor R4: “Confidence in having enough water in the future” on the adoption remained relatively unaffected by the second stage regression, with the β values being 0.40 for the standard logistic regression. Once this variable was treated as endogenous and controlled for by predicting new values using assigned IVs, the β value became 0.41. Hence, “Confidence of having enough water in the future” was endogenous in irrigation adoption behaviour with a relatively low biased estimation, by 2.5%.
The effect of the risk sub-factor (R1: “Perception of water supply decrease”) as well as the ability sub-factor (Ab3: “Difficulty to get water (previous 10 years) decrease”) were overestimated (in terms of their absolute values) by the first stage regression results. The value for the decrease in perception of water supply was -0.47 in the standard regression, and relatively increased to -0.43 in the second stage regression. The value for the decrease in perceived ability to get water (in the previous 10 years) decreased from 0.47 to 0.42 (from the standard regression to the second stage regression), respectively.
By correcting the endogeneity of irrigation adoption influencing farmers’ psychology, another risk sub-factor became dominant (R3: “Responsibility of securing own water source decrease”), which illustrated how responsible farmers felt towards securing their irrigation water source.
The exogeneity condition was also satisfied as none of the instrument variables on being included in the logistic regression along with the other second-stage regression variables (SECs, exogenous RANAS factors, predicted endogenous RANAS factors) were found to be significant.
3.3.3. Logistic regression performance metrics
details some details of the performance indicators accuracy, precision, recall and F1-score, as well as indicating the performance of the models developed for both surveys via the same.
Both models performed adequately, with accuracy of 0.83 and 0.73, precision of 0.84 and 0.78, recall of 0.95 and 0.87, and F1-scores of 0.89 and 0.82, for 2019 and 2022, respectively. This performance was comparable to similar studies investigating the adoption of different technologies (Edo et al., 2023; Chauhan et al., 2021). When only those farmers were considered who adopted irrigation, the recall values were 0.87 and 0.90 in 2019 and 2022, respectively.
3.3.4. Comparison of logistic regression results based on 2019 and 2022 surveys
presents the results obtained from the binary logistic regression model for both the surveys, highlighting the significant SECs and RANAS factors. The results report the impact of each independent RANAS variable that is significant at p< 0.05 on the odds ratio of the observed event of interest, while keeping other variables constant (Sperandei, 2014). The results for 2022 were generated from the second stage of the two-stage regression performed to address endogeneity. It could be observed that the influential factors and the magnitude of their effects on the adoption behaviour, and corresponding sensitivities (defined as % change = (OR-1)*100, where OR is the odds ratio) denoting the magnitude of the effects, changed.
Within the socio-economic characteristics (SECs), the total annual income was significant in 2019, but was replaced by other factors such as land area, livestock and educational level in 2022. In 2019, a unit increase in total annual income led to an increase in the likelihood of adoption by 244%. In 2022, a unit increase in scaled land area (1 scaled unit area = 7.73 acres), scaled livestock owned (1 scaled unit of livestock = 3.74 livestock animals), and educational level (across seven levels from no education to a master’s degree) led to an increase in likelihood of adoption of 93%, 45% and 27% respectively. Almost all these SECs (except educational level) represented indicators of wealth, so it could be concluded that wealth continued to play a role in the adoption of irrigation systems for farmers. The relevance of educational level could indicate that the interventions may have had more influence on educated farmers.
Among the RANAS factors, the following differences were observed. In 2019, if the farmer perceived a decrease in their water supply (in comparison to the crop water demand) from ‘supply meets demand’ to ‘less than I need’, the likelihood of the adoption decreased by 48%. With reference to perceptions regarding the irrigation behaviour itself, as farmers perceived lesser effort in irrigation (decreasing from ‘significantly more effort’ to ‘significantly less effort’), the likelihood of adoption increased by 106%. Farmers’ perception of decreases in crop yields due to irrigation (moving from ‘significant increase in yield’ to ‘significant decrease in yield’) led to the likelihood of adoption dropping by 159%. The farmers’ perception of people using irrigation systems in their village was also an important factor; as it increased (from 0% to 100%), the likelihood of adoption increased by 51%. Lastly, as perceived self-confidence in operating irrigation systems decreased (from ‘completely confident’ to ‘not confident at all’), farmers were 72% less likely to adopt irrigation.
In 2022, a perceived decrease in water supply for crops (from ‘supply meets demand’ to ‘less than I need’) decreased the likelihood of adoption by 35% (compared 48% in 2019). As farmers perceived lower vulnerability (from ‘very confident’ to ‘confident’), in terms of having enough water for the next 5 years, their likelihood of adoption increased by 50%. Decrease in farmers’ self-perceived responsibility for their water source from ‘mostly my responsibility’ to ‘not my responsibility at all’ led to decrease in the likelihood of the adoption by 38%. Lastly, when farmers’ abilities to get water in the previous 10 years increased (from ‘easier’ to ‘much easier’), their likelihood of adopting irrigation increased by 52%.
Among the RANAS factors, self-regulation did not appear as an influential factor in both years. In 2019, one SEC, one risk-related sub-factor, two attitude-related sub-factors, one norm-related sub-factor and one abilities-related subfactor appeared to be influential. In 2022, three SECs, three risk-related sub-factors and one abilities-related sub-factor were influential towards adoption behaviour.
It appears that farmers were driven by their risk perception towards adopting irrigation behaviour throughout the intervention. In 2019, attitude and norm factors played a role in adoption. However, during the course of the interventions in between the two surveys, these influences seem to have reduced. The adoption decisions of farmers are influenced by a combination of the RANAS psychological sub-factors (and not a function of individual sub-factors), which points towards the complexity in understanding the drivers of adoption behaviour.
4. Discussion
In 2019, the RANAS factors that were significant towards adoption (along with the number of questions/variables) were attitude (two in number), risk, norms, and abilities (one each). This was aligned with previous studies. Positive attitudes towards irrigation technology, which may include a conviction about the advantages of such technology (e.g., across economic and environmental aspects), has led to more likely adoption behaviour, or an intention towards it (Hatch et al., 2022; Nair & Thomas, 2022; Castillo et al., 2021; Nejadrezaei et al., 2018; He et al., 2007; Azizi Khalkheili & Zamani, 2009; Kulshreshtha & Brown, 1993). Risk aversion towards water scarcity (such as via the perceived water availability) and new technology (including the aspect of investment decision-making) can influence adoption behaviour (Gautam et al., 2024; Hatch et al., 2022; Nair & Thomas, 2022; Jordán & Speelman, 2020). Social influence via (injunctive) norms has influenced irrigation technology adoption or a corresponding intention to adopt (Castillo et al., 2021; Nejadrezaei et al., 2018). Perceived control over the behaviour, which corresponds to a perception of one’s ability to perform the behaviour, has also been seen as significant to adoption (Castillo et al., 2021).
The interventions were designed based on risk perception (awareness about water scarcity and its effects) and abilities (water efficient techniques including irrigation adoption) directly, and norms indirectly (adoption of water efficient techniques itself altered the farmers’ norm perceptions). The standardized nature of the interventions may not have sufficiently targeted influence attitudinal factors such as affective beliefs (e.g., feelings about irrigation behaviour), and instrumental beliefs (e.g., costs and benefits of irrigation).
The behavioural changes from 2019 and 2022 reflect the same. In terms of risk perceptions, farmers felt an increase in the supply of water (compared to their needs), a decrease in the perceived crop loss due to water shortage, and a perception of higher responsibility for their water source. This implied that there was a continued perception of risk surrounding the supply of water itself. In previous studies, the perception of reliability on the water supply has been a significant factor to adoption (Jordán & Speelman), also in the Indian context (Nair & Thomas, 2022). There was also an increase in the perception of people in their village adopting irrigation, which meant that the interventions influenced norms positively. Previous studies have also highlighted the positive influence of social influence (via injunctive norms) on adoption (Nejadrezaei et al., 2018). However, notably there was an attitudinal shift in farmers towards the benefits of irrigation for crop production; in 2022 they felt that irrigation led to lower increases in yield as compared to 2019, which implies a reduction in their attitude towards irrigation adoption. Moreover, their ability factors also decreased; farmers felt that their confidence to irrigate had reduced, and the time that it took to irrigate had increased. This observation was counterproductive to the goals of the intervention (to improve farmers’ abilities to adopt water saving techniques). However, one argument is that the interventions targeted the abilities of the farmers in adopting irrigation without focusing adequately on their attitudes towards adopting irrigation (which was a significant influencing factor observed in 2019 regression results before the interventions). Overall, one resulting hypothesis is that including training aspects that change attitude is essential for the success of any ability-based intervention (Duflo et al., 2011, Gaffney et al., 2019) if attitude is observed to be a significant behavioural factor prior to the intervention. Only ability-based interventions may lead to counterproductive results (even in improving farmers’ self-perceived abilities themselves) if attitudinal aspects are not well accounted for (assuming attitude was significant apriori).
There was still an increase in micro-irrigation adoption from 2019 (36.9%) to 2022 (62.8%), during the intervention period. describes the relevant RANAS factors during the 2019 and 2022 surveys (in the rounded rectangles with solid boundaries), as well as potentially relevant factors for sustainable adoption long after the interventions, as explained further. The rounded rectangles with dashed boundaries are interpretations of potentially relevant factors, based on the literature.
Based on the surveys, farmers continued to be risk averse during the intervention; the perception of available water supply (compared to the crop water requirement) and the confidence in having adequate water after five years continued to remain significant for adoption in 2022. Hence, the interventions did continue to highlight the importance of risk averse behaviour in water scarcity, which is particularly relevant for India, where it is an under-acknowledged barrier to adoption (Nair & Thomas, 2022). Moreover, the perceived responsibility of securing their water sources also became significant once reverse causality was accounted for in the regression. However, factors such as the attitude of farmers towards the effects of irrigation on crop yields, and the ability to irrigate became non-significant in explaining adoption behaviour going from 2019 to 2022. This is particularly concerning for the Indian context, where potential adopters need to be convinced about the advantages of, and need to shift towards irrigation technologies, and develop a positive attitude towards technological change (Nair & Thomas, 2022).
Farmers not being convinced about the value of irrigation could be interpreted as having a lack of trust in the technology itself, as per the recently expanded conception of RANAS which includes trust in the technology as a factor relevant to adoption (Contzen et al., 2023). Perhaps, with the presence of the intervening agency, attitude and ability factors were transferred into trust in operators (the intervening agency), without real ownership and trust in the technology (Contzen et al., 2023). This may lead to an increase in adoption which is unsustainable beyond the intervention, since capacity development entails not only the development of abilities (e.g., to operate technology), but also a change of attitudes and mindsets (UNDP, 2015).
Similar interventions (where attitude and ability factors are significant apriori) may perhaps seem to be successful during the period of interventions but not later. This may be because their attitude and ability related aspects are transferred towards increased trust in operators and an unintentional (and invisible) decrease in psychological ownership felt by the farmer towards the technology (Contzen et al., 2023). This may have partly contributed to the decline in adoption during the intervention itself. Further, to ensure that the favourable behavioural adoption lasts beyond the intervention period itself, it is important that this loss of relevant attitude and ability factors (compensated by the trust in operators) is regained via interventions targeting not only attitude and ability factors, but also transforming the trust in operators towards psychological ownership towards the technology, and trust in the technology itself. Psychological ownership can be a key mediating factor between the participation of beneficiaries in developmental interventions and the sustainability of the intervention itself (Aga et al., 2018). Future studies could account for factors such as trust and ownership to more holistically identify the socio-psychological drivers and barriers to adoption. Further, it becomes even more important if the monitoring and maintenance of the technology is challenging (Contzen et al., 2023), which could be the case in irrigation adoption.
Technological adoption, rather than being a binary decision (yes/no), is a multi-stage process, and different stages can be associated with different psychological factors driving adoption behaviour (Weersink & Fulton, 2020). One theory is that humans first become aware of the technology, then evaluate it for their circumstances, adopt it, and then revise or dis-adopt based on changing circumstances. While social and cognitive factors could be more influential in the earlier stages, economic factors could become more important in the later stages (Weersink & Fulton, 2020). One model used to study this is the Stage model of Self-regulated Behavioural Change (SSBC; Bamberg, 2013), which proposes four qualitative stages of adoption: predecisional, preactional, actional and postactional. This theory proposes that interventions are not “one-size-fits-all”, and can be made more effective by first identifying the current stage, and then suitably pairing them to the specific needs of the individuals within each stage of behavioural change. In the future, models such as the SSBC could be used to gather a more nuanced understanding of adoption vs. non-adoption and could be compared or combined with models such as RANAS. Future studies could integrate such models together to develop a subtler understanding of adoption behaviour of water resilient technologies in agriculture.
Policy based support for agriculture in India includes subsidies for agricultural inputs like fertilizers, electricity, and irrigation water minimum support prices for certain crops, as well as direct income transfer via the PM-KISAN program (OECD, 2023). In particular for irrigation, support has been provided to expand access to electricity, lowering irrigation costs. This has had impacts such as increased agricultural production (Badiani & Jessoe, 2011) and rural incomes (Briscoe & Malik, 2006), while also contributing to financial insolvency and unreliability of electricity services (World Bank, 2002), and environmental costs such as excessive groundwater depletion (Badiani et al., 2012; Badiani & Jessoe, 2011). Within irrigation systems, micro-irrigation systems have been incentivized more recently by subsidies, increasing coverage from 2.3 Mha in 2005-2006 to 11.4 Mha in 2018-19, assuming widespread adoption of efficient technologies would lead to lowered water usage and hence a reduction in electricity consumption (Nair & Thomas, 2022; Reddy, 2016). Still, uncertain governmental guidelines, delays in subsidy distributions and loan sanctioning processes are often considered challenges to micro-irrigation adoption (Gupta et al., 2022, Namara et al., 2007). Further, subsidies alone may not lead to widespread adoption as irrigation technology adoption related decision making is shaped by farm, household, and institutional factors (Nair and Thomas, 2022). This highlights that achieving systemic impacts can involve three types of scaling - scaling up (by changing institutions at the policy level), scaling deep (by changing values and beliefs to impact cultural roots), and scaling out (by replicating and disseminating among more communities) (Moore et al., 2015). Nonetheless, the results from this and previous studies (Hatch et al., 2022) in such contexts imply that policymakers could establish contextual and socio-psychological ‘baselines’, and if appropriate, strategically design irrigation corresponding extension services to focus on sustaining positive attitudes towards adoption, highlight water security related risks and leverage existing societal norms.
It is important to note that efforts focused on increasing efficiency in agricultural water management may not always lead to effective and/or equitable water allocations (Grafton et al., 2018), and could lead to a counterproductive increase in water use (Birkenholtz, 2017), or power dynamics adversely affecting marginalized or tail-end farmers (Linstead, 2018). This is also observed specifically regarding irrigation technologies in India (Nair and Thomas, 2022). Hence it is important to account human-water feedbacks and consider potential negative externalities to prevent supporting existing inequalities (based on financial capital, knowledge or gender) and natural resource degradation (Adla et al., 2023). This study focuses on irrigation adoption as one specific technology that was promoted during the overall intervention (on sustainable cotton production practices).
Transferability and generalizability of such results would require a comparative analysis of similar studies across different geographies and contexts. This would require a comparability of such studies (with standardized explanatory and dependent variables, similar theoretical underpinnings, scopes and methodological components). Such comparative global studies exist in the scope of household water treatment (Daniel et al., 2022). However, studies related to the adoption of irrigation technologies are different in several aspects. Dependent variables vary, from water saving technologies which include rainwater harvesting (He et al., 2007), to pressurized irrigation technologies (Castillo et al., 2021; Nejadrezaei et al., 2018; Wang et al., 2016; Friedlander et al., 2013) and furrow irrigation (Gautam et al., 2024). Often dependent variables could include other associated farm management choices, such soil moisture monitoring based irrigation scheduling, land levelling or soil water conservation practices (Jordán & Speelman, 2020). Farmer participation in irrigation management schemes could also be a dependent variable (Azizi Khalkheili & Zamani, 2009). The scopes of the investigations can vary widely, with their own theoretical frameworks. Some studies have aimed at identifying technical constraints to irrigation adoption (Friedlander et al., 2013), while most have identified demographic, socio-economic, farm and extension related factors (Gautam et al., 2024; Jordán & Speelman, 2020; Wang et al., 2016; Abdulai et al., 2011; He et al., 2007).
These results reinforce some of the results of studies in similar climatic (He et al., 2007) and socio-economic contexts of middle income countries like Iran (Nejadrezaei et al., 2018) and India (Nair & Thomas, 2022). Factors influencing micro-irrigation technology adoption in India can be broadly categorized into three levels - household level, farm level and institutional (Nair & Thomas, 2022). Studies which have used behavioural science frameworks have identified factors explaining the adoption related intention and behaviour (Castillo et al., 2021; Nejadrezaei et al., 2018). While there is relatively lower variability in the methodologies adopted, with many studies using different types of regression analyses applied to primary data (Gautam et al., 2024; Castillo et al., 2021; Nejadrezaei et al., 2018; Wang et al., 2016; Abdulai et al., 2011), the differences in dependent variables would make a reasonable comparison challenging.
5. Conclusions
This study used the socio-psychological RANAS approach to systematic behaviour change in the drivers and barriers of adoption of irrigation behaviour. This was tested on an intervention towards increased irrigation adoption, implemented between 2019 and 2022 in four districts of Maharashtra (India). Data from two statistically similar surveys (n=343, and n=419 in 2019 and 2022, respectively) were used as inputs for logistic regression models developed with independent socio-economic variables and RANAS psychological factors and the dependent binary variable of irrigation adoption.
There was an overall increase of micro-irrigation adoption from 36.9% to 62.8% which corresponds with the interventions which promoted micro-irrigation, but with a reduction in overall irrigation adoption, from 81.6% to 70.4%. In terms of socio-economic characteristics, the wealth of the farmer continued to influence irrigation adoption, via the total annual income in 2019, and land area and livestock in 2022, respectively. However, RANAS psychological factors seemed to be more influential in determining irrigation adoption in both years. While the contribution of each RANAS factor may be too difficult to isolate, the risk-averseness of farmers (against water scarcity) seemed to be a significant factor towards irrigation adoption. Furthermore, the impact of risk-aversion on irrigation adoption was underestimated by standard logistic regression and could be correcting for the endogenous influence of the behaviour on the RANAS risk factor.
Farmers also felt that there were more people surrounding them who were irrigating, which may have resulted from the intervention efforts. However, farmers felt that their self-perceived abilities to irrigate decreased during the intervention (perhaps due to a more accurate self-assessment) which was counterproductive to the goals of the interventions. While this factor was significant in driving adoption behaviour in 2019, it ceased to be so during 2022. This may have been due to the fact that while farmer attitudes towards irrigation were influential before 2019, the interventions were shaped more by perceptions of risk (raising awareness about water scarcity) and abilities (training of irrigation behaviour), and not adequately about necessary attitudinal shifts. Hence, the attitude towards adoption became non-influential after the interventions as revealed by the 2022 survey. Moreover, interventions could be designed more towards transforming the trust in the operator (inculcated during the interventions) towards psychological ownership and trust in the technology itself, to ensure more sustainable interventions overall. Technology adoption can also be a multi-stage process, which can potentially need commensurate, more nuanced modelling to understand the adoption of water resilient agricultural technologies.
Table 1. Psychological questions asked in the two surveys with their corresponding RANAS factor and subfactors.
Table 2. Questions used as instrument variables (IVs) to address endogeneity (reverse causality), along with their corresponding RANAS factors.
Table 3. Descriptive statistics for surveys conducted in 2019 and 2022. SD stands for standard deviation.
Table 4. Results from various logistic regression analyses for irrigation adoption based the 2022 survey data: standard regression (without IVs), second stage regression (considering predicted values of endogenous RANAS factors), and for testing the exogeneity assumption for the instrument variables from .
Table 5. First stage regression results for RANAS sub-factor ‘R4’ (‘confidence of having enough water in the future’), illustrating significant variables. The IV index is taken from , is the regression coefficient, SE() is the standard error in the coefficient, and p-value corresponds to an
.
Table 6. Performance indicators of the logistic regression models, randomly sampled into 80% training and 20% testing datasets, for both the 2019 and 2022 surveys.TP - True Positive; TN - True Negative; FP - False Positive; FN - False Negative.
Table 7. Significant socio-economic (SEC) and psychological (RANAS) factors in the logistic regression for the 2019 the probability of occurrence of an event given the set of predictorsand 2022 survey data. is the regression coefficient, OR is the odds ratio, % change = (OR-1)*100, and p-value corresponds to an
.
Figure 1. An agro-ecological map of India, highlighting the four districts in Maharashtra state selected for the surveys, i.e., A - Amravati, N - Nagpur, W - Wardha and Y - Yavatmal. The districts lie in the hot semi-arid and hot subhumid zones. Map modified from the Open Government Data Platform (Govt. of India, 2022).
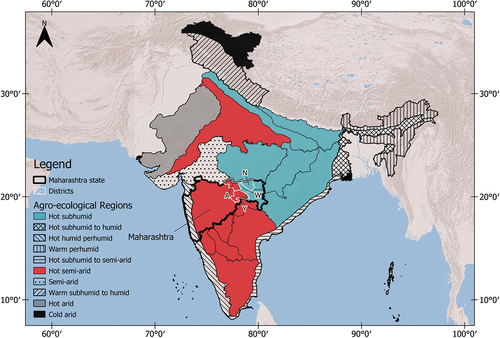
Figure 2. Schematic for the logistic regression used in the study (image from Šaponjić, 2023). Multiple socio-economic characteristics and psychological factors are independent predictor variables, and irrigation adoption is the dependent outcome behaviour, modelled by logistic regression for both surveys.
Figure 3. Endogeneity (reverse causality) between the dependent outcome variable (behaviour) and the independent variable (individual psychology) addressed by the instrument variable approach. Figure modified from Daniel et al. (2022).
Figure 4. Changes from 2019 to 2022 in the adoption of different irrigation technologies.
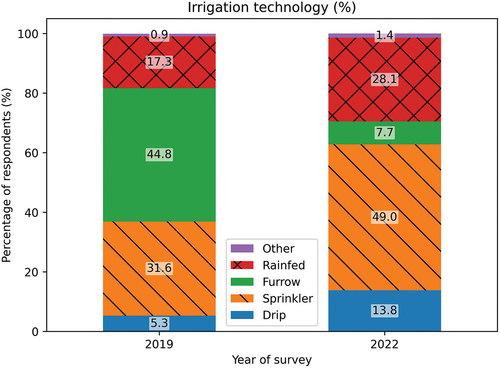
Figure 5. Comparison of RANAS psychological factors between the surveys in 2019 and 2022. The alphanumeric combination at the beginning of the x-axis labels denotes the RANAS factor (‘R’, ‘At’, ‘N’, ‘Ab’, and ‘S’) followed by an index (see ) within the particular RANAS factor (e.g., the second ‘Risk’ factor is ‘R2’). The bars represent the average Likert scale perception with the respective standard deviations represented as error bars.
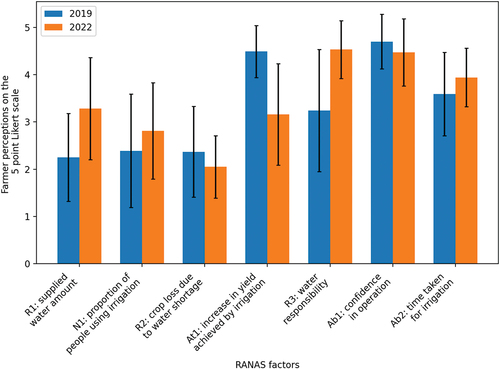
Figure 6. Relevant RANAS factors during 2019, 2022 and (potentially) beyond the intervention. The rounded rectangles with solid boundaries are based on data analysis, and those with dashed boundaries represent interpretations and suggestions based on the literature.
Acknowledgments
The authors thank the support of Solidaridad Network Asia Limited (SNAL) and Rijksdienst voor Ondernemend Nederland (RVO). They are grateful for the support from SNAL colleagues, including Dr. Prashant Rajankar, as well as researchers, Dr. D. Daniel and Mr. Md. Faiz Alam for their support. They are also grateful to Mr. Martin Vonk, creator of Python SPEI library, for their helpful and timely support. The authors declare no conflict of interest between the donors and research activities detailed in this manuscript.
Additional information
Funding
References
- Abdulai, A. Owusu, V. & Bakang, J.-E. A. (2011) Adoption of safer irrigation technologies and cropping patterns: Evidence from Southern Ghana. Ecological Economics Special Section: Ecological Economics and Environmental History 70(7), 1415–1423. doi:10.1016/j.ecolecon.2011.03.004
- Adla, S. Callejas Moncaleano, D. C. Alam, M. F. Daniel, D. & Pande, S. (2023) Guidelines to conduct RANAS based socio-hydrological (SH) surveys to understand behaviour (Protocol). Protocols.io. Retrieved from 10.17504/protocols.io.rm7vzb725vx1/v1
- Adla, S. Pande, S. Vico, G. Vora, S. Alam, M. F. Basel, B. Haeffner, M. et al. (2023) Place for sociohydrology in sustainable and climate-resilient agriculture: Review and ways forward. Cambridge Prisms: Water 1, e13. doi:10.1017/wat.2023.16
- Aga, D. A. Noorderhaven, N. & Vallejo, B. (2018) Project beneficiary participation and behavioural intentions promoting project sustainability: The mediating role of psychological ownership. Development Policy Review 36(5), 527–546. doi:10.1111/dpr.12241
- Aher, M. C. & Yadav, S. M. (2021) Assessment of rainfall trend and variability of semi-arid regions of Upper and Middle Godavari basin, India. Journal of Water and Climate Change 12(8), 3992–4006. doi:10.2166/wcc.2021.044
- Ajzen, I. (1991) The theory of planned behaviour. Organizational Behaviour and Human Decision Processes Theories of Cognitive Self-Regulation 50(2), 179–211. doi:10.1016/0749-5978(91)90020-T
- Albarracín, D. Gillette, J. C. Earl, A. N. Glasman, L. R. Durantini, M. R. & Ho, M.-H. (2005) A test of major assumptions about behaviour change: a comprehensive look at the effects of passive and active HIV-prevention interventions since the beginning of the epidemic. Psychol Bull 131(6), 856–897. doi:10.1037/0033-2909.131.6.856
- Albarracin, D. Johnson, B. T. Zanna, M. P. & Kumkale, G. T. (2005) Attitudes: Introduction and Scope. In: The Handbook of Attitudes. Lawrence Erlbaum Associates Publishers.
- Albrecht, D. & Ladewig, H. (2019) Adoption of Irrigation Technology: The Effects of Personal, Structural, and Environmental Variables. Journal of Rural Social Sciences 03(1). Retrieved from https://egrove.olemiss.edu/jrss/vol03/iss1/6
- Alesina, A. & Giuliano, P. (2015) Culture and Institutions. Journal of Economic Literature 53(4), 898–944. doi:10.1257/jel.53.4.898
- Azizi Khalkheili, T. & Zamani, G. H. (2009) Farmer participation in irrigation management: The case of Doroodzan Dam Irrigation Network, Iran. Agricultural Water Management 96(5), 859–865. doi:10.1016/j.agwat.2008.11.008
- Badiani, R. & Jessoe, K. K. (2011) Electricity subsidies for agriculture: Evaluating the impact and persistence of these subsidies in India. San Diego, USA. Retrieved from https://econweb.ucsd.edu/cee/papers/Jessoe_4april.pdf
- Badiani, R. Jessoe, K. K. & Plant, S. (2012) Development and the Environment: The Implications of Agricultural Electricity Subsidies in India. The Journal of Environment & Development 21(2), 244–262. Sage Publications, Inc.
- Balasubramanya, S. & Stifel, D. (2020) Viewpoint: Water, agriculture & poverty in an era of climate change: Why do we know so little? Food Policy 93, 101905. doi:10.1016/j.foodpol.2020.101905
- Bamberg, S. (2013) Changing environmentally harmful behaviours: A stage model of self-regulated behavioural change. Journal of Environmental Psychology 34, 151–159. doi:10.1016/j.jenvp.2013.01.002
- Bandura, A. (2004) Health promotion by social cognitive means. Health Educ Behav 31(2), 143–164. doi:10.1177/1090198104263660
- Birkenholtz, T. (2017) Assessing India’s drip-irrigation boom: efficiency, climate change and groundwater policy. Water International 42(6), 663–677. doi:10.1080/02508060.2017.1351910
- Blaise, D. (2017) Cotton based cropping systems. In: Emhancing nutrient use efficiency, 369–384. New Delhi: New India Publishing Agency (NIPA).
- Briscoe, J. & Malik, R. P. S. (2006) India’s Water Economy : Bracing for a Turbulent Future. World Bank Publications - Books. The World Bank Group. Retrieved from https://ideas.repec.org//b/wbk/wbpubs/7238.html
- Brouwer, C. Prins, K. & Heibloem, M. (1989) Annex I: Irrigation efficiencies. In: Irrigation Water Management: Irrigation Scheduling. Rome, Italy: Food and Agricultural Organization of the United Nations. Retrieved from https://www.fao.org/3/t7202e/t7202e08.htm
- Callejas Moncaleano, D. C. Pande, S. & Rietveld, L. (2021) Water Use Efficiency: A Review of Contextual and Behavioural Factors. Frontiers in Water 3. Retrieved from https://www.frontiersin.org/articles/10.3389/frwa.2021.685650
- Castillo, G. M. L. Engler, A. & Wollni, M. (2021) Planned behaviour and social capital: Understanding farmers’ behaviour toward pressurized irrigation technologies. Agricultural Water Management 243, 106524. doi:10.1016/j.agwat.2020.106524
- Chauhan, S. Mittal, M. Woźniak, M. Gupta, S. & Pérez de Prado, R. (2021) A Technology Acceptance Model-Based Analytics for Online Mobile Games Using Machine Learning Techniques. Symmetry 13(8), 1545. Multidisciplinary Digital Publishing Institute. doi:10.3390/sym13081545
- Cialdini, R. B. Demaine, L. J. Sagarin, B. J. Barrett, D. W. Rhoads, K. & Winter, P. L. (2006) Managing social norms for persuasive impact. Social Influence 1(1), 3–15. Routledge. doi:10.1080/15534510500181459
- Contzen, N. Kollmann, J. & Mosler, H.-J. (2023) The importance of user acceptance, support, and behaviour change for the implementation of decentralised water technologies. Nature Water 1–13.
- Contzen, N. & Marks, S. J. (2018) Increasing the regular use of safe water kiosk through collective psychological ownership: A mediation analysis. Journal of Environmental Psychology 57, 45–52. doi:10.1016/j.jenvp.2018.06.008
- Daniel, D. Pande, S. & Rietveld, L. (2022) Endogeneity in water use behaviour across case studies of household water treatment adoption in developing countries. World Development Perspectives 25, 100385. doi:10.1016/j.wdp.2021.100385
- Duflo, E. Kremer, M. & Robinson, J. (2011) Nudging Farmers to Use Fertilizer: Theory and Experimental Evidence from Kenya. American Economic Review 101(6), 2350–2390. doi:10.1257/aer.101.6.2350
- Edo, O. C. Etu, E.-E. Tenebe, I. Oladele, O. S. Edo, S. Diekola, O. A. & Emakhu, J. (2023) Fintech adoption dynamics in a pandemic: An experience from some financial institutions in Nigeria during COVID-19 using machine learning approach. Cogent Business & Management 10(2), 2242985. Cogent OA. doi:10.1080/23311975.2023.2242985
- FAO. (2022) World Food and Agriculture – Statistical Yearbook 2022. Rome: Food and Agricultural Organization of the United Nations. Retrieved from 10.4060/cc2211en
- Fishbein, M. & Ajzen, I. (2009) Predicting and Changing Behaviour: The Reasoned Action Approach. New York: Psychology Press. doi:10.4324/9780203838020
- Floyd, D. L. Prentice-Dunn, S. & Rogers, R. W. (2000) A Meta-Analysis of Research on Protection Motivation Theory. Journal of Applied Social Psychology 30(2), 407–429. doi:10.1111/j.1559-1816.2000.tb02323.x
- Frick, J. Kaiser, F. G. & Wilson, M. (2004) Environmental knowledge and conservation behaviour: exploring prevalence and structure in a representative sample. Personality and Individual Differences 37(8), 1597–1613. doi:10.1016/j.paid.2004.02.015
- Friedlander, L. Tal, A. & Lazarovitch, N. (2013) Technical considerations affecting adoption of drip irrigation in sub-Saharan Africa. Agricultural Water Management 126, 125–132. doi:10.1016/j.agwat.2013.04.014
- Gaffney, A. Slakie, E. Anderson, C. L. & Gugerty, M. K. (2019) Why Attitudes Matter: Measuring Farmer Attitudes in Agricultural Development. Gates Open Res 3(740), 740. F1000 Research Limited. doi:10.21955/gatesopenres.1115397.1
- Garrick, D. E. Hanemann, M. & Hepburn, C. (2020) Rethinking the economics of water: an assessment. Oxford Review of Economic Policy 36(1), 1–23. doi:10.1093/oxrep/grz035
- Gautam, T. K. Paudel, K. P. & Guidry, K. M. (2024) Determinants of Irrigation Technology Adoption and Acreage Allocation in Crop Production in Louisiana, USA. Water 16(3), 392. Multidisciplinary Digital Publishing Institute. doi:10.3390/w16030392
- Gollwitzer, P. M. & Sheeran, P. (2006) Implementation Intentions and Goal Achievement: A Meta‐analysis of Effects and Processes. In: Advances in Experimental Social Psychology, Vol. 38, 69–119. Academic Press. doi:10.1016/S0065-2601(06)38002-1
- Govt. of India. (2022) Boundaries of Agro-Ecological regions. Open Government Data(OGD_ Platform India. Department of Water Resources, River Development & Ganga Rejuvenation, Ministry of Jal Shakti. Retrieved from: https://data.gov.in/resource/boundaries-agro-ecological-regions
- Grafton, R. Q. Williams, J. Perry, C. J. Molle, F. Ringler, C. Steduto, P. Udall, B. et al. (2018) The paradox of irrigation efficiency. Science 361(6404), 748–750. American Association for the Advancement of Science.Greif, A. (2006) Institutions and the Path to the Modern Economy: Lessons from Medieval Trade. Political Economy of Institutions and Decisions. Cambridge: Cambridge University Press. doi:10.1017/CBO9780511791307
- Gupta, A. Singh, R. K. Kumar, M. Sawant, C. P. & Gaikwad, B. B. (2022) On-farm irrigation water management in India: Challenges and research gaps*. Irrigation and Drainage 71(1), 3–22. doi:10.1002/ird.2637
- Hatch, N. R. Daniel, D. & Pande, S. (2022) Behavioural and socio-economic factors controlling irrigation adoption in Maharashtra, India. Hydrological Sciences Journal 67(6), 847–857.
- Hill, A. D. Johnson, S. G. Greco, L. M. O’Boyle, E. H. & Walter, S. L. (2021) Endogeneity: A Review and Agenda for the Methodology-Practice Divide Affecting Micro and Macro Research. Journal of Management 47(1), 105–143. SAGE Publications Inc. doi:10.1177/0149206320960533
- He, X.-F. Cao, H. & Li, F.-M. (2007) Econometric analysis of the determinants of adoption of rainwater harvesting and supplementary irrigation technology (RHSIT) in the semiarid Loess Plateau of China. Agricultural Water Management 89(3), 243–250. doi:10.1016/j.agwat.2007.01.006
- Hunecke, C. Engler, A. Jara-Rojas, R. & Poortvliet, P. M. (2017) Understanding the role of social capital in adoption decisions: An application to irrigation technology. Agricultural Systems 153, 221–231. doi:10.1016/j.agsy.2017.02.002
- Hussain, S. Ahmad, A. Wajid, A. Khaliq, T. Hussain, N. Mubeen, M. Farid, H. U. et al. (2020) Irrigation Scheduling for Cotton Cultivation. In: Cotton Production and Uses: Agronomy, Crop Protection, and Postharvest Technologies (S. Ahmad & M. Hasanuzzaman, eds.), 59–80. Singapore: Springer. doi:10.1007/978-981-15-1472-2_5
- Jordán, C. & Speelman, S. (2020) On-farm adoption of irrigation technologies in two irrigated valleys in Central Chile: The effect of relative abundance of water resources. Agricultural Water Management 236, 106147. doi:10.1016/j.agwat.2020.106147
- Kaufmann, D. Kraay, A. & Mastruzzi, M. (2010) The Worldwide Governance Indicators : Methodology and Analytical Issues. doi:10.1596/1813-9450-5430
- Khadi, B. M. Santhy, V. & Yadav, M. S. (2010) Cotton in India. In: Cotton - Biotechnological Advances Biotechnology in Agriculture and Forestry, Vol. 65, 15–44. Berlin, Heidelberg: Springer Berlin Heidelberg. doi:10.1007/978-3-642-04796-1_2
- Kramer, O. (2016) Scikit-Learn. In: Machine Learning for Evolution Strategies Studies in Big Data (O. Kramer, ed.), 45–53. Cham: Springer International Publishing. doi:10.1007/978-3-319-33383-0_5
- Kulshreshtha, S. N. & Brown, W. J. (1993) Role of farmers’ attitudes in adoption of irrigation in Saskatchewan. Irrig Drainage Syst 7(2), 85–98. doi:10.1007/BF00880869
- Kumar, M. & Rath, S. K. (2016) Chapter 15 - Feature Selection and Classification of Microarray Data Using Machine Learning Techniques. In: Emerging Trends in Applications and Infrastructures for Computational Biology, Bioinformatics, and Systems Biology Emerging Trends in Computer Science and Applied Computing (Q. N. Tran & H. R. Arabnia, eds.), 213–242. Boston: Morgan Kaufmann. doi:10.1016/B978-0-12-804203-8.00015-8
- Lakshminarasimhappa, M. C. (2022) Web-Based and Smart Mobile App for Data Collection: Kobo Toolbox/Kobo Collect. Journal of Indian Library Association 57(2), 72–79.
- Legros, S. & Cislaghi, B. (2020) Mapping the Social-Norms Literature: An Overview of Reviews. Perspect Psychol Sci 15(1), 62–80. SAGE Publications Inc. doi:10.1177/1745691619866455
- Linstead, C. (2018) The Contribution of Improvements in Irrigation Efficiency to Environmental Flows. Frontiers in Environmental Science 6. Retrieved from https://www.frontiersin.org/articles/10.3389/fenvs.2018.00048
- Locke, E. A. (1997) Self-efficacy: The exercise of control. Personnel Psychology 50(3), 801.
- López-Felices, B. Velasco-Muñoz, J. F. Aznar-Sánchez, J. A. & Román-Sánchez, I. M. (2023) Factors influencing the use of rainwater for agricultural irrigation: the case of greenhouse agriculture in southeast Spain. AQUA - Water Infrastructure, Ecosystems and Society 72(2), 185–201. doi:10.2166/aqua.2023.205
- Mariano, M. J. Villano, R. & Fleming, E. (2012) Factors influencing farmers’ adoption of modern rice technologies and good management practices in the Philippines. Agricultural Systems 110, 41–53. doi:10.1016/j.agsy.2012.03.010
- Marks, S. J. & Davis, J. (2012) Does User Participation Lead to Sense of Ownership for Rural Water Systems? Evidence from Kenya. World Development 40(8), 1569–1576. doi:10.1016/j.worlddev.2012.03.011
- Meinzen-Dick, R. (2014) Property rights and sustainable irrigation: A developing country perspective. Agricultural Water Management Exploring some of the socio-economic realities of sustainable water management in irrigation 145, 23–31. doi:10.1016/j.agwat.2014.03.017
- Ministry of Textiles. (2022) Annexure-vii: Cotton sector. Govt. of India. Retrieved from https://www.texmin.nic.in/sites/default/files/Cotton%20Sector.pdf
- Mishra, S. (2006) Farmers’ Suicides in Maharashtra | Economic and Political Weekly XLI(16), 1538–1545.
- Moore, M.-L. Riddell, D. & Vocisano, D. (2015) Scaling Out, Scaling Up, Scaling Deep: Strategies of Non-profits in Advancing Systemic Social Innovation. The Journal of Corporate Citizenship (58), 67–84. Greenleaf Publishing.
- Mosler, H.-J. & Contzen, N. (2016) Systematic behaviour change in water, sanitation and hygiene. A practical guide using the RANAS approach. Version 1.1. Swiss Agency for Development and Cooperation SDC.
- Mosler, H.-J. (2012) A systematic approach to behaviour change interventions for the water and sanitation sector in developing countries: a conceptual model, a review, and a guideline. Int J Environ Health Res 22(5), 431–449. doi:10.1080/09603123.2011.650156
- Murat, M. (2019) Logistic Regression/Odds/Odds Ratio/Risk. Retrieved from https: //mmuratarat.github.io/2019-09-05/odds-ratio-logistic-regression
- Nair, J. & Thomas, B. K. (2022) Why is adoption of micro-irrigation slow in India? a review. Development in Practice 33, 1–11. doi:10.1080/09614524.2022.2059065
- Namara, R. E. Nagar, R. K. & Upadhyay, B. (2007) Economics, adoption determinants, and impacts of micro-irrigation technologies: empirical results from India. Irrig Sci 25(3), 283–297. doi:10.1007/s00271-007-0065-0
- NASA. (2023) Langley Research Center (LaRC), POWER Data Access Viewer, Single Point Data Access online resource. Retrieved from https://power.larc.nasa.gov/data-access-viewer
- Nejadrezaei, N. Allahyari, M. S. Sadeghzadeh, M. Michailidis, A. & El Bilali, H. (2018) Factors affecting adoption of pressurized irrigation technology among olive farmers in Northern Iran. Appl Water Sci 8(6), 190. doi:10.1007/s13201-018-0819-2
- Ni, Q. Cai, Y. Xu, T. & Zhao, M. (2021) ‘What if I feel it is mine?’ – The impact of psychological ownership on public participation in China’s transboundary watershed eco-compensation. Water Policy 23(3), 700–717. doi:10.2166/wp.2021.230
- OECD. (2023) Agricultural Policy Monitoring and Evaluation 2023: Adapting Agriculture to Climate Change. Agricultural Policy Monitoring and Evaluation. OECD. doi:10.1787/b14de474-en
- Pande, S. Roobavannan, M. Kandasamy, J. Sivapalan, M. Hombing, D. Lyu, H. & Rietveld, L. (2020) A Socio-Hydrological Perspective on the Economics of Water Resources Development and Management. In: Oxford Research Encyclopedia of Environmental Science. doi:10.1093/acrefore/9780199389414.013.657
- Pande, S. & Savenije, H. H. G. (2016) A sociohydrological model for smallholder farmers in Maharashtra, India. Water Resources Research 52(3), 1923–1947.
- Pedregosa, F. Varoquaux, G. Gramfort, A. Michel, V. Thirion, B. Grisel, O. Blondel, M. et al. (2011) Scikit-learn: Machine learning in Python. the Journal of machine Learning research 12, 2825–2830. JMLR. org.
- Peduzzi, P. Concato, J. Kemper, E. Holford, T. R. & Feinstein, A. R. (1996) A simulation study of the number of events per variable in logistic regression analysis. Journal of Clinical Epidemiology 49(12), 1373–1379. doi:10.1016/S0895-4356(96)00236-3
- Reddy, K. Y. (2016) Micro-Irrigation in Participatory Mode Pays Huge Dividends—Apmip Experiences, India. Irrigation and Drainage 65(S1), 72–78. doi:10.1002/ird.2039
- RVO. (2022) Water efficiency in sustainable cotton-based production systems in Maharashtra, India. Project Database (Sustainable Water Fund - FDW). Netherlands: Netherlands Enterprise Agency. Retrieved from https://projects.rvo.nl/project/nl-kvk-27378529-fdw17109in/
- Sani, L. I. (2017) Influence of Socio-economic characteristics of irrigation farmers to access and utilization of agricultural knowledge and information. Library Philosophy and Practice (e-journal) 1571.
- Šaponjić, A. (2023, August 31) Understanding farmers’ micro-irrigation adoption behaviour: a case study in Maharashtra, India (Master’s Thesis). Delft University of Technology, Delft.
- Schultz, P. W. Nolan, J. M. Cialdini, R. B. Goldstein, N. J. & Griskevicius, V. (2007) The constructive, destructive, and reconstructive power of social norms. Psychol Sci 18(5), 429–434. doi:10.1111/j.1467-9280.2007.01917.x
- Schwartz, S. H. (1977) Normative Influences on Altruism. In: Advances in Experimental Social Psychology (L. Berkowitz, ed.), Vol. 10, 221–279. Academic Press. doi:10.1016/S0065-2601(08)60358-5
- Schwarzer, R. (2008) Modeling Health Behaviour Change: How to Predict and Modify the Adoption and Maintenance of Health Behaviours. Applied Psychology 57(1), 1–29. doi:10.1111/j.1464-0597.2007.00325.x
- Seabold, S. & Perktold, J. (2010) Statsmodels: Econometric and Statistical Modeling with Python, 92–96. Presented at the Python in Science Conference, Austin, Texas. doi:10.25080/Majora-92bf1922-011
- Smeden, M. van, Groot, J. A. H. de, Moons, K. G. M. Collins, G. S. Altman, D. G. Eijkemans, M. J. C. & Reitsma, J. B. (2016) No rationale for 1 variable per 10 events criterion for binary logistic regression analysis. BMC Medical Research Methodology 16(1), 163. doi:10.1186/s12874-016-0267-3
- Somni, V. Kudale, N. Dhorde, A. & Desai, M. (2021) Assessment of Post-monsoon Drought Over Marathawada Region (Maharashtra, India) Using MODIS Data. Applied Ecology and Environmental Sciences 9(7), 656–679. Science and Education Publishing. doi:10.12691/aees-9-7-5
- Sperandei, S. (2014) Understanding logistic regression analysis. Biochem Med (Zagreb) 24(1), 12–18. doi:10.11613/BM.2014.003
- Swain, S. Mishra, S. K. & Pandey, A. (2022) Assessing spatiotemporal variation in drought characteristics and their dependence on timescales over Vidarbha Region, India. Geocarto International 37(27), 17971–17993. Taylor & Francis. doi:10.1080/10106049.2022.2136260
- Tabellini, G. (2010) Culture and Institutions: Economic Development in the Regions of Europe. Journal of the European Economic Association 8(4), 677–716. doi:10.1111/j.1542-4774.2010.tb00537.x
- Tesfaye, M. Z. Balana, B. B. & Bizimana, J.-C. (2021) Assessment of smallholder farmers’ demand for and adoption constraints to small-scale irrigation technologies: Evidence from Ethiopia. Agricultural Water Management 250, 106855. doi:10.1016/j.agwat.2021.106855
- Tobias, R. (2009) Changing behaviour by memory aids: a social psychological model of prospective memory and habit development tested with dynamic field data. Psychol Rev 116(2), 408–438. doi:10.1037/a0015512
- Trafimow, D. & Sheeran, P. (1998) Some Tests of the Distinction between Cognitive and Affective Beliefs. Journal of Experimental Social Psychology 34(4), 378–397. doi:10.1006/jesp.1998.1356
- UNDP. (2015) Capacity Development: A UNDP Primer | United Nations Development Programme (Advocacy primer). New York, USA.: United Nations Development Programme. Retrieved from https://www.undp.org/publications/capacity-development-undp-primer
- United Nations. (2022) Probabilistic Population Projections based on the World Population Prospects 2022. Retrieved from http://population.un.org/wpp/
- Van Halsema, G. E. & Vincent, L. (2012) Efficiency and productivity terms for water management: A matter of contextual relativism versus general absolutism. Agricultural Water Management 108, 9–15. doi:10.1016/j.agwat.2011.05.016
- Venkatesh, V. Morris, M. G. Davis, G. B. & Davis, F. D. (2003) User Acceptance of Information Technology: Toward a Unified View. MIS Quarterly 27(3), 425–478. Management Information Systems Research Center, University of Minnesota. doi:10.2307/30036540
- Venkatesh, V. Thong, J. & Xu, X. (2016) Unified Theory of Acceptance and Use of Technology: A Synthesis and the Road Ahead. Journal of the Association for Information Systems 17(5). doi:10.17705/1jais.00428
- Vicente-Serrano, S. M. Beguería, S. & López-Moreno, J. I. (2010) A Multiscalar Drought Index Sensitive to Global Warming: The Standardized Precipitation Evapotranspiration Index. Journal of Climate 23(7), 1696–1718. American Meteorological Society. doi:10.1175/2009JCLI2909.1
- Vittinghoff, E. & McCulloch, C. E. (2007) Relaxing the Rule of Ten Events per Variable in Logistic and Cox Regression. American Journal of Epidemiology 165(6), 710–718. doi:10.1093/aje/kwk052
- Vonk, M. (2024) SPEI: A simple Python package to calculate and visualize drought indices (v0.4.0). Python, . Retrieved from 10.5281/zenodo.10816741
- Wang, J. Bjornlund, H. Klein, K. K. Zhang, L. & Zhang, W. (2016) Factors that Influence the Rate and Intensity of Adoption of Improved Irrigation Technologies in Alberta, Canada. Water Econs. Policy 02(03), 1650026. World Scientific Publishing Co. doi:10.1142/S2382624X16500260
- Weersink, A. & Fulton, M. (2020) Limits to Profit Maximization as a Guide to Behaviour Change. Applied Economic Perspectives and Policy 42(1), 67–79. doi:10.1002/aepp.13004
- Wirdum, C. van, Hatch, N. R. Ali, M. Y. A. M. Raghunathan, P. & Willard, T. (2019) Multidisciplinary Project Cotton Water: Baseline study of designing sustainable instruments for smallholders in Maharashtra, India. Delft: Delft University of Technology. Retrieved from http://resolver.tudelft.nl/uuid:16fc0b0b-72e6-47da-9a91-2305adf65e58
- Witten, I. H. Frank, E. & Hall, M. A. (2011) Data mining: practical machine learning tools and techniques. Morgan Kaufmann series in data management systems, 3rd ed. Burlington, MA: Morgan Kaufmann.
- World Bank. (2002) Power Subsidies : A Reality Check on Subsidizing Power for Irrigation in India (No. 11350). World Bank Publications - Reports. World Bank. Retrieved from https://ideas.repec.org//p/wbk/wboper/11350.html
- World Bank. (2014) Access to Finance for Smallholder Farmers: Learning from the Experiences of Microfinance Institutions in Latin America. Washington, D.C.: International Finance Corporation, World Bank. Retrieved from https://openknowledge.worldbank.org/server/api/core/bitstreams/92de2eda-b138-5bea-8c5e-4b299a4adc37/content
- World Bank. (2022) Water in Agriculture. Water in Agriculture. Retrieved from https://www.worldbank.org/en/topic/water-in-agriculture
Appendix
Figure A1 Boxplots displaying the (a) Standardized Precipitation Evapotranspiration Index (SPEI) and the (b) moving average of SPEI (SPEI_MA) for non-adopters and adopters for both the surveys. The input data were taken from the year preceding the survey years (2018 for 2019, and 2021 for 2022) on the assumption that agricultural management decisions would be made based on previous experiences. Irrigation non-adopters are denoted by the suffix “_N” and adopters are denoted by “_Y”, respectiv