
ABSTRACT
Background
Draw-A-Scientist Test (DAST) has been one of the most used instruments to study conceptions of scientists and science. It has been especially useful for charting the conceptions of younger children who might lack the skills to express themselves in writing. However, recent studies suggest that instead of children’s conceptions of the appearance of scientists, their conceptions about the activities are more crucial in shaping children’s attitudes towards science.
Purpose
This study describes a new instrument, Draw-A-Science Comic (DASC), and examines the advantages and disadvantages of using a comic as a tool to collect data about children’s conceptions of scientists and science.
Sample
A total of 104 children aged 8 to 13 drew a comic while attending university’s science camps during the summer of 2017 and 2018.
Design and methods
Participants drew a comic about how science is made. The analysis of the drawings was based on four main categories: scientific activities, locations of research, appearance of scientists, and emotions and attitudes. Instances for each category were calculated by two researchers independently. Qualitative overviews of the categories and the methods used to convey information were formed.
Results
The children used sequential pictures to depict actions and processes, speech bubbles to depict dialogue between characters as well as text captions to provide additional details and clarifications. By drawing comics children were able to have more detailed illustrations of scientific activities than with a single picture. The sequential narratives were also used to depict emotions and attitudes related to science.
Conclusions
In contrast to DAST, the DASC provides information about children’s conceptions and stereotypes regarding scientific activities even without the use of additional or more explicit prompts.
Introduction
Drawing, especially Draw-A-Scientist Test (DAST), is a popular and an effective method for studying children’s conceptions of scientists and science (see Finson Citation2002; Miller et al. Citation2018). Drawings have also been used to study older students (e.g. Bayri, Koksal, and Ertekin Citation2016; Hillman et al. Citation2014; Hsieh and Tsai Citation2017), university students and pre-service teachers (e.g. Brown and Wang Citation2013; McCarthy Citation2015; Meyer, Guenther, and Joubert Citation2019; Miele Citation2014; Reinisch et al. Citation2017) about their views on scientists and science.
The DAST was created over 50 years ago to examine when students’ drawings began to exhibit stereotypic indicators of scientists (Chambers Citation1983). Even though the study was successful in fulfilling the original research purpose, many critiqued the test when it was applied to other research questions concerning children’s conceptions of scientists and science. Therefore, several researchers have modified the DAST by using alternative prompts (e.g. Farland-Smith Citation2012; Miele Citation2014; Symington and Spurling Citation1990), scoring systems or checklists (e.g. Farland-Smith Citation2012; Finson, Beaver, and Cramond Citation1995) and additional interviews or questionnaires (e.g. Ehrlen Citation2009; Reinisch et al. Citation2017; Türkmen Citation2008). Despite being popular for charting conceptions of scientists and science, the DAST and the various modified versions of the DAST have still received a fair amount of critique, and many researchers have highlighted the need for new or alternative research methods (e.g. Farland-Smith Citation2012; Finson Citation2002; Reinisch et al. Citation2017; Schibeci Citation2006).
To expand the field of study, we have developed a new research instrument, the Draw-A-Science-Comic (DASC), which uses student-drawn comics that could be used for mapping out children’s stereotypes, conceptions, and the attitudes towards scientists and science. This study describes the DASC instrument and examines some of the advantages and disadvantages of using a draw-a-comic task as a tool to collect data about children’s conceptions of scientists and science.
Theoretical background
Why study children’s conceptions and attitudes?
While most students acknowledged the importance of natural sciences, many still consider natural sciences, especially physics and chemistry, uninteresting or even off-putting (e.g. Kärnä, Hakonen, and Kuusela Citation2012). In a study by Jenkins and Nelson (Citation2005), English secondary school students stated that science is ‘rather easy to learn’ and it was seen as a subject that ‘everybody should learn at school’. However, both boys and girls clearly presented the dislike of sciences relative to other school subjects. As DeWitt and Archer (Citation2015) phrased: ‘students may enjoy doing science, but most do not aspire to be a scientist’ (p. 2173).
If you were to think of a scientist, you would most likely imagine a Caucasian male, with glasses and facial hair. He would be wearing a lab coat and working with some sort of chemistry equipment. This stereotype has long been a predominant way the children picture, or draw, a scientist (e.g. Cakmakci et al. Citation2011; Emvalotis and Koutsianou Citation2018; Finson Citation2002; Miller et al. Citation2018). These stereotypic images of scientists and science interact with children’s attitudes, self-image and self-efficacy (Archer et al. Citation2013; Christidou Citation2011; Dimopoulos and Smyrnaiou Citation2005; Finson Citation2002), and therefore affect their success in school as well as their subject and career choices (Fung Citation2002; DeWitt and Archer Citation2015; Britner Citation2008). In other words, it is unlikely that children would pursue a scientific career if their self-image does not correspond with that of a scientist or if they harbour negative images about scientists or science.
Research shows that these stereotypes and conceptions of scientists and science develop in the early years of primary school (DeWitt and Archer Citation2015; Arthur et al. Citation2008; Lee Citation2010) and many continue to exist through adulthood (Losh Citation2010; Rahm and Charbonneau Citation1997). Although several factors such as teachers and family shape children’s conceptions of science and scientists (DeWitt and Archer Citation2015; Calabrese Barton et al. Citation2013; Aschbacher, Li, and Roth Citation2010), notable factors also include television, movies and comics, which are filled with stereotypic views about scientists and science (Christidou Citation2011; Tan, Jocz, and Zhai Citation2017; Türkmen Citation2008; Weingart Citation2008). Profiling and addressing these stereotypes and conceptions early is crucial, because later students’ aspirations are unlikely to change dramatically (Aschbacher, Li, and Roth Citation2010; Maltese and Tai Citation2011; Archer et al. Citation2013).
To address this issue, we must have an accurate understanding of the stereotypes, conceptions and attitudes people, especially the younger students, possess (Campbell, Schwarz, and Windschitl Citation2016; Farland-Smith et al. Citation2012; Duit et al. Citation2012). Furthermore, researchers have underlined the need for systematic studies linking students’ images of scientists and science with science interventions, curriculum, and social and cultural aspects (e.g. Cakmakci et al. Citation2011; Christidou Citation2011).
Brief history of drawing scientists and science
Chambers (Citation1983) Draw-A-Scientist Test (DAST) was the first to illustrate the stereotypical portrait of scientists. The study showed that this image developed already during the second and the third grade of primary school. Since then, drawing has often been used to examine the conceptions and views of children and adults alike. Due to its simplicity, DAST has grown as one of the most used instruments to examine children’s conceptions of and views on scientists and science (see Finson Citation2002; Miller et al. Citation2018). One of the main advantages of the test is that it does not rely on verbal response. This allows the test to be utilized at an earlier age than written essays or questionnaires (see Chambers Citation1983; Finson, Beaver, and Cramond Citation1995). It also enables the comparison between different languages without problems. Because the prompt is so simple and intuitive, the data collection is easy and does not require expertise. This simplicity also creates some notable drawbacks, especially concerning the validity of interpretations made from the drawings. For example, Ehrlen (Citation2009) noticed that similar pictures reveal different underlying conceptions when the participants are interviewed, and she suggested using descriptions to specify what they had drawn.
After the introduction of DAST, many researchers have presented a range of methodological variations to improve the test. Symington and Spurling (Citation1990) proposed and tested the Draw-A-Scientist-Test Revised Prompt (DAST-R). They discovered that changing a prompt altered the image for majority of grade 5 pupils. This is not surprising because the original DAST prompt ‘Draw a picture of a scientist’ and the proposed ‘Do a drawing which tells me what you know about scientists and their work’ steer the image towards different directions. Both share the same fundamental elements but the first one focuses more on the appearance and the second one provides more insight about their work. In light of these findings Symington and Spurling (Citation1990) encouraged to explore alternative procedures.
In order to improve the objectivity and the interrater reliability, as well as widen the scope for stereotypical image, Finson, Beaver, and Cramond (Citation1995) devised a new scoring mechanism: DAST-Checklist. The checklist included a pointing system with added sub-categories to original DAST and new categories, such as gender and mythic stereotypes, to expand the image. The study examined the effect of an intervention and it was conducted on junior high students by using a pre-test and a post-test when taking part in science and technology-related courses.
Farland-Smith (Citation2012) introduced a modified DAST with more detailed prompt and the division of the scoring system into three categories: appearance, location and activity. This has been an important step towards understanding children’s conceptions as latest research suggests that conceptions and attitudes are more related to the activities of a scientist instead of the appearance (Emvalotis and Koutsianou Citation2018; Christidou, Bonoti, and Kontopoulou Citation2016).
In the end, the draw-a-picture approach has proved to be a rather versatile tool for researching student’s conceptions of scientists and science. Prosser and Burke (Citation2008) even stated that ‘Children have the ability to capture feelings and emotions through drawings and paintings while lacking an equally expressive written or spoken language’ (p. 266). Drawings of scientists have been used to study the effects of culture, ethnicity and gender (e.g. Christidou Citation2011; Christidou, Bonoti, and Kontopoulou Citation2016; Miller et al. Citation2018) as well as to measure the impact of interventions and different teaching methods (e.g. Cakmakci et al. Citation2011; Hillman et al. Citation2014; Miele Citation2014). The draw-a-picture approach has been used to examine students’ take on studying natural sciences and the use of ICT (e.g. Brown and Wang Citation2013; Selwyn, Boraschi, and Özkula Citation2009), as well as to differentiate differences between certain fields of science (e.g. Hansen et al. Citation2017; Oktay and Eryurt Citation2012). The approach has also been adopted to examine students’ understanding of scientific concepts (e.g. Cabe Trundle et al. Citation2010; Dikmenli Citation2010; Ehrlen Citation2009; Erduran and Kaya Citation2018).
Methodological challenges
Even though modifications have sought to improve the reliability and validity (e.g. Farland-Smith Citation2012), researchers have still highlighted several methodological challenges regarding the DAST and other drawing instruments. When prompted to draw another scientist, the depictions can also differ vastly from the first drawing (e.g. Losh, Wilke, and Pop Citation2008; Maoldomhnaigh and Hunt Citation1988). This has led the researchers to conclude that children can hold multiple conceptions of scientists. DAST has also received critique regarding the children’s ability to illustrate what they actually perceive (e.g. Losh, Wilke, and Pop Citation2008). Finson and Pederson (Citation2011) stated that children’s drawings often deviates from their perception of the world around them, because the drawings have a communicative purpose. In general, asking to draw a scientist might provoke the depiction of stereotypes and ignore additional existing conceptions. Thus, rather than producing a depiction representing their ingrained preconceptions, children might be inclined to produce a picture that they think is recognizable for the viewer.
The critique might be valid, but it does not render the recognition of these drawn stereotypes or common presentations from children’s drawing meaningless. In order to draw a recognizable characters or events, children must be aware of these stereotypes and common conceptions – whether they considered them true or not. This indicates that the children have an understanding of these stereotypes and common conceptions. Even when not fully believed as factual, such stereotypes can interact with children’s preconceptions and attitudes (e.g. Archer et al. Citation2013; Christidou Citation2011; Dimopoulos and Smyrnaiou Citation2005; Finson Citation2002).
Ball and Smith (Citation1992) note that symbols can have multiple meanings, like a flag presenting a nationality, patriotism or even a holiday. Similarly, Ehrlen (Citation2009) found that pictures resembling one another may have different underlying conceptions, and the exact meaning behind drawings can only be given by the artist (see Reinisch et al. Citation2017). Losh, Wilke, and Pop (Citation2008) argued that sex differences on many study variables suggest so many caveats that they recommended caution, when considering drawings of scientists as indicators of children’s internal constructs, like self-efficacy. For a more detailed history of methodological challenges and development of DAST, see studies by Finson (Citation2002), Losh, Wilke, and Pop (Citation2008), and Reinisch et al. (Citation2017).
Despite these challenges, drawing can still be considered as a viable alternative for researching children’s images of scientists and science, and even their underlying conceptions. To address the aforementioned challenges, most current studies use triangulation and utilize multiple research instruments, such as questionnaires or interviews, to accompany the drawing assignment (e.g. Reinisch et al. Citation2017; Tan, Jocz, and Zhai Citation2017; Walls Citation2012). This enables participants to explain the drawing and to give meaning to different symbols or elements. While some criticize the children’s ability to draw, other means of data gathering are not without problems. Questionnaires and interviews are appropriate and effective for older students and adults (e.g. Reinisch et al. Citation2017), but younger children may harbour stereotypes before being able to express them explicitly (Galdi, Cadinu, and Tomasetto Citation2014). Therefore, it can be argued that using an indirect implicit measurement instead of verbal or written response might be more effective (see Cvencek and Meltzoff Citation2015). Furthermore, especially when number of participants is high, collecting and analyzing interviews and questionnaires can be time consuming (Johnson and Onwuegbuzie Citation2011; McCusker and Gunaydin Citation2015).
Comic as a research tool
Lately, creating comics has been introduced as a research instrument. Comics have been studied as a technique to teach and learn by combining science and art in a form of a comic, and as a method for science communication (e.g. Spiegel et al. Citation2013; Tatalovic Citation2009; van der Veen Citation2017). Outside of natural sciences, comics have been used, for example, to describe how children of immigrants view their parents, students prejudices of different cultures, and student’s ideas on sustainable development (Mehlmann Citation2018).
The effectiveness of creating a comic for data collection stems from the ability to tell a story through a combination of words and images (McCloud Citation1994; Mehlmann Citation2018; Kuttner, Sousanis, and Weaver-Hightower Citation2017; Eisner Citation2008). Neither words nor images are required to a comic but in narrative these two complement each other by using the other to convey what the other does not (Kuttner, Sousanis, and Weaver-Hightower Citation2017). In respect to text or a single picture, the comics can be described as multimodal and they offer a wider array of modes of communication (Kress Citation2010). For example, a simple drop of sweat flying from a person’s forehead can portray emotions, or simple wiggly lines can represent a moving arm. Multiple frames also allow depicting a storyline more accurately by using both text and symbols to make the story understandable (cf. Hsieh and Tsai Citation2018; McCloud Citation1994; Mitchell et al. Citation2011). For example, series of pictures can show the use or the purpose of a research equipment or provide examples of the different aspects of scientific work (cf. Losh, Wilke, and Pop Citation2008; Reinisch et al. Citation2017). As comics are a concept that can be considered to be familiar to almost all primary school children, instruments based on comic form also allow testing across national and ethnic boundaries.
A comic offers the children an opportunity to illustrate their ideas as they see fit; they can use the wide array of pictorial elements and even add meaningful text of labels to ensure the readability of the story (cf. Ehrlen Citation2009). This makes the use of draw-a-comic tasks promising for charting children’s stereotypes and conceptions of science and scientists. Using sequential pictures might invite children to tell stories, which could help to illustrate the children’s stereotypes and conceptions of scientific activities (cf. Christidou, Bonoti, and Kontopoulou Citation2016; Emvalotis and Koutsianou Citation2018).
Aim and research question
The goal of developing the Draw-A-Science-Comic is to expand the field of testing and to help us better understand how children view the different aspects of science. The idea is not to diminish or undermine existing methods but to offer an alternative research instrument and to examine the advantages and disadvantages of using a draw-a-comic task. In light of the criticism, in the analysis we refrain from making far-reaching generalizations about children’s conceptions or attitudes based solely on their drawings. Instead, the study investigates how children can portray different aspects of science when drawing a comic rather than a single picture.
In some situations, drawing might enable the children to express themselves better than a written questionnaire (Prosser and Burke Citation2008). When children draw a comic, it also allows them to write explanatory sentences and labels or even meaningful dialogue. Whereas such things could be requested using an additional prompt, like has been done in modified versions of DAST (e.g. Farland-Smith Citation2012; Reinisch et al. Citation2017), the use of comic format and multiple pictures, text captions and speech bubbles gives the children the freedom to tell a story or describe a process as they see fit (see McCloud Citation1994; Mehlmann Citation2018).
As Farland-Smith (Citation2012) has pointed out, the simple prompt of ‘draw a scientists’ provides information about children’s conceptions of the appearance of scientists. However, these drawings do not usually provide researchers much information on children’s conceptions of the scientific activities or the location of research. Therefore, modified versions of DAST have been developed, which use interviews and explicit prompts to provide researchers with information about children’s conceptions of these aspects (e.g. Farland-Smith Citation2012; Reinisch et al. Citation2017). In addition to these three categories (activity, location and appearance), the preliminary analysis in this study also revealed several drawings depicting emotions and attitudes towards science and scientists. The hypothesis is that the comic format delivers us more detailed information about the activities than a single picture, but it also might offer additional information in other categories. The first research question aims to test this hypothesis with a simple prompt and to observe how often these categories are presented in the comics.
(RQ 1) What percentage of the comics present information about the scientific activities, emotions and attitudes towards science and scientists, research locations and appearance of scientists?
The second research question is more qualitative. As the comic format allows the use of multiple pictures, text captions and speech bubbles enable telling a story and describing a process (McCloud Citation1994; Kuttner, Sousanis, and Weaver-Hightower Citation2017), we are interested how the use of these elements affects the depictions.
(RQ 2) How the elements of comic format are used to depict scientific activities, emotions and attitudes towards science and scientists, research locations and appearance of scientists?
Methods
Prompt, sample and data collection
When using the DAST the children might be inclined to draw the common presentation of scientists instead of their own depiction (Dove, Everett, and Preece Citation1999; Finson and Pederson Citation2011). However, it has been pointed out that a more guided prompt might also affect the drawings (see Reinisch et al. Citation2017). In addition, the prompt should not limit the number of scientists or suggest a certain gender, location or activity (cf. Farland-Smith Citation2012; Reinisch et al. Citation2017). Keeping in mind these considerations from previous research, the following simple prompt was formed: ‘Draw a comic about how you think science is made’. As the children participating in this study were native Finnish speakers, the prompt was translated into Finnish.
Using this prompt, a total of 104 drawings were obtained from children aged 8 to 13 who attended science camps organized by the University of Turku in southern Finland during the summer of 2017 and 2018. The test was implemented at the beginning of the camp to avoid the impact of the science-related experiences students had during the camp. The method of data collection was based on the instructions by Mitchell et al. (Citation2011): The participants were given multiple sheets of paper, coloured pencils, crayons and other possible drawing tools (e.g. marker pens, rulers and erasers) to ensure that they could express themselves as they saw fit. The prompt was given in a written and a verbal form. After receiving the task, all participants were verbally reminded that the focus is in the content of the drawings not the quality, and that there are no right or wrong answers to the task. The time of the task was not limited to ensure that everyone could finish their comic without pressure.
Additional assistance was kept to a minimum to prevent the researchers from steering the children unnecessarily. If the children asked for assistance during the task, it was provided following these guidelines:
If there is uncertainty about the task, the prompt should be repeated.
Answering other questions related to the task should be always done in a way which avoids providing children with ideas what to draw.
After each answer, the children should be reminded that it is about their own views and that there are no right or wrong answers.
It must be noted that only few children asked for assistance, and re-reading the prompt was often enough to reassure children that they understood the task.
Method of analysis
The framework of analysis was based on the three categories: scientific activities, locations of research and appearance of scientists described by Farland-Smith (Citation2012) and used previously by Emvalotis and Koutsianou (Citation2018) as well as Reinisch et al. (Citation2017). Using these categories, we independently analysed 37 comics, discussed the results, and refined the framework of analysis. During this preliminary analysis we noticed that several comics included portrayals of spontaneous expressions of emotions related to doing science as well as attitudes towards science and scientists (cf. Hsieh and Tsai Citation2017). Thus, a fourth category was added for the analysis: emotions and attitudes. Short description of each category is provided in .
Table 1. The description of categories and examples of elements in each category.
To answer the first research question, each comic was independently analysed by both authors. We marked whether or not each comic included depictions of each of the four categories of analysis or not. To keep the unnecessary interpretations to a minimum, we marked only the instances in which elements of each category were clearly depicted. The full description of the categories used during the final analysis can be found in the following subsection. At the end, the results of analysis were compared with each other and differences were discussed until a consensus was reached. The inter-rater reliability was verified by calculating Cohen’s Kappa coefficient for inter-rater agreement in each category.
To answer the second research question, we inductively formed the descriptions of how the elements of the comic, such as multiple pictures describing activity or explanatory text captions and speech bubbles (McCloud Citation1994; Kuttner, Sousanis, and Weaver-Hightower Citation2017), were used to depict the four categories of analysis. To support the interpretations made, five comics are included to provide examples of the use of the comic format.
The categories of analysis
The activities category includes depictions or descriptions of how science is carried out. These include depictions of phases of research as well as scientists doing research-related activities such as hypothesising, conducting experiments, or presenting research results. As with other categories, unnecessary interpretations were kept to a minimum. Thus, only instances in which the activity is clearly depicted are included. For example, showing a computer in a laboratory does not qualify as an scientific activity because no clear use is assigned for the equipment (cf. Reinisch et al. Citation2017). To qualify as a scientific activity the comic should depict that the computer is used for something, like collecting data, sending emails or writing scientific papers. However, the picture of a computer or lab equipment alone could be counted as a depiction of the location of research.
The emotions and attitudes category includes instances in which drawings depict expressions of emotions that scientists feel while doing science or attitudes towards science and scientists. The emotions and attitudes include depictions of scientist’s frustration after a failed experiment and the relieved happiness after a success as well as expressions showing lack of interest in science by the non-scientist characters. Only the instances where these emotions and attitudes are clearly expressed are included. Such depictions include changes in facial expressions as well as expressing emotions and attitude through dialogue or written labels. However, unchanged facial expression of a character does not qualify as a depiction of emotions and attitudes as the expression can also be considered as a standard element of facial features.
The location category includes descriptions and portrayals of the surroundings or the work environment. These include depictions of laboratory equipment, scientific instruments, and outdoors. Also labels like ‘laboratory’ and ‘university’ are acceptable indicators. However, a table with no equipment does not qualify as information about the surroundings as it is not clearly science or task-related.
The appearance category includes depictions of the looks of the scientist or other characters involved in doing science. The category includes depictions of stereotypic features such as a lab coats, safety glasses, and messy hair, as well as elements like skirts, ponytails and other non-stereotypic features. However, a stick figure with no prominent features does not count as a depiction of the appearance of scientist.
Results
The results of the first round of analysis, including the Cohen’s Kappa for each category, are presented in . The descriptions of the way the elements of comic format were used in depictions are presented in four subsections, each focusing on one category of analysis: scientific activities, emotions and attitudes, locations of research and appearance of scientists.
Table 2. Instances and percentage of comics including analysable elements from each category of analysis (N = 104).
Scientific activities
Almost all analysed drawings included depictions of scientific activities. They were included in 95 of the evaluated 104 comics. Comics depicted scientists involved in various activities from thinking, evaluating and experimenting to discussing results and attending scientific conferences. Examples of how children portrayed the process of science can be seen in the following two comics ( and ).
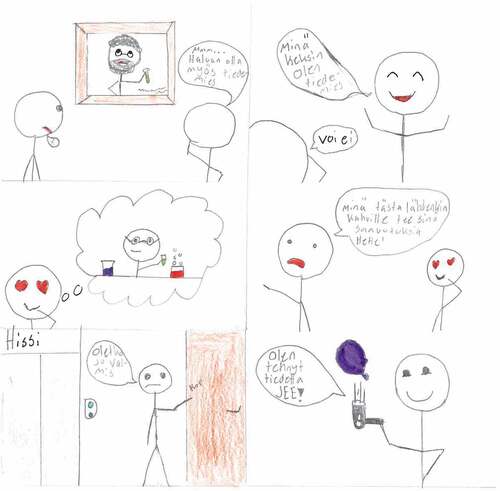
Figure 1. A comic titled ‘Scientific research’ depicting difficulties during research.NOTE: Mr. Doctor is working on a substance that will revolutionize the world, but suddenly it explodes. Next day he drives to work and he is frustrated and shares his feelings with a colleague who sympathises with the scientist. Later on, his third attempt he succeeds in creating the substance again without the explosion and he is happy with the result.
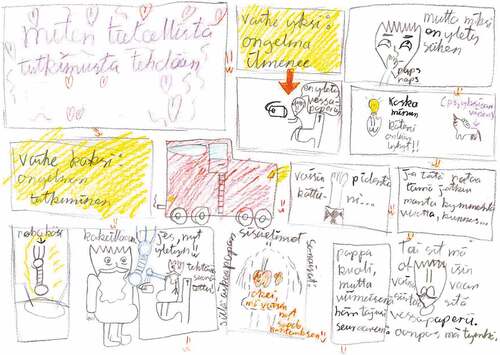
Figure 2. The development of a robotic arm with distinctive reserach phases.NOTE: While sitting on a toilet the scientist realizes that he can’t reach the toilet paper. He comes to a conclusion that his arm is too short and he spends decades trying to solve the problem. When he finally has created a solution – a robotic arm – he dies of old age and states that he could have just moved the paper closer.
The first comic () portrays science as process of creating something new through rounds of trial and error. In the comic, a stick figure scientist is working in a laboratory on a new substance which will ‘revolutionize the world’. However, for an unknown reason, the created substance is unstable and explodes leaving shards of glass on the counter. The next day he drives to work and another explosion goes off in the laboratory. Eventually, the third experiment is finally a success.
The second comic () illustrates that science can be made to answer people’s needs, even though it might not always be especially useful. Like in the previous comic (see ) the comic describes a process of scientific inquiry, but now with distinctive and labelled phases. During the first phase, the scientist encounters and identifies a problem. In the second phase, he begins to study the problem and come up with solutions for problem. This goes on for ‘many decades’ until he has reached a solution and created a robotic arm. But when the robotic arm is finally working, the scientist dies of old age.
In the analysed comics the scientific activities were depicted in a narrative format through the use of sequential pictures and speech bubbles (see Kuttner, Sousanis, and Weaver-Hightower Citation2017; McCloud Citation1994; Mehlmann Citation2018). In these narratives, texts captions were used to provide additional details or explanations. For example, the timeline was usually presumed to progress in its own pace between the frames (see Pratt Citation2009), but sometimes the time passed during the narrative was presented by using text captions. The first comic () uses two such text captions: ‘on the next day’ and ‘1 hour later’.
Emotions and attitudes
Over half of the comics (54.8%) included expressions of emotions related to doing science or attitudes towards science and scientists. These emotions were often linked to scientific activities and depicted both negative and positive emotions. The use of sequential nature of comics and use of speech bubbles were used in depictions of expression of emotions. As emotions are usually a response to something that happens (i.e., a sequence with a stimulus and a response) a single picture cannot convey emotions in a similar fashion as a sequence of pictures. For example, in the first comic () failing experiments cause the scientist stress and frustration, but in the end the hard work pays off. The speech bubbles and dialogue are used to express the emotions, from frustrated cry ‘Why always me!’ when experiment fails to a relieved ‘It works!’ when he finally succeeds.
Sequential storytelling and dialogue were also used to convey the perceived differences in attitudes towards science. In the third comic () two characters have a discussion, in which one of the characters clearly expresses lack of interest or even dislike towards science while the other character announces the desire to become a scientist. When the person decides to be a scientist, the other person leaves and comments this decision with a snide remark: ‘Oh no. Well, I’m going for a coffee. You do your accomplishments. Ha-ha.’ When the less interested character returns the other is in the middle of doing science by levitating a balloon on an air stream of a hair dryer.
Figure 3. Choosing sciences can lead to ridicule.NOTE: One person decides to become a scientist and the other leaves for coffee while mocking the other for this. When the person returns the other has made science by floating a balloon on a hair dryer.
The multimodal tools of comics were also frequently used to portray elements of danger. 45 (43.3%) comics included elements of danger (see and ), which were almost exclusively explosion after mixing liquids leading to explosion sounds, rising smoke and depictions of flying or bursting matter. Expressions of scientists varied from happily surprised to scared or disoriented as a result of the explosion.
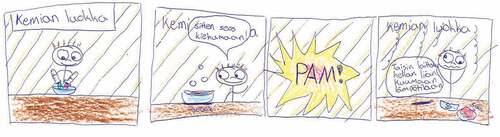
Figure 4. Explosion depicted as a results of mixing liquids.NOTE: Location is labelled as ‘chemistry class’. Two liquids are poured in and heated which leads to explosion. The scientist is analysing that the explosion was perhaps due to overheating the mixture.
Location of research
From the 104 evaluated comics 71 (68.3%) included a recognizable location or locations. Labels and captions, such as ‘laboratory’, ‘chemistry class’, and ‘shards of glass’ were used to indicate the location or provide a description of what was drawn (see and ). Use of sequential pictures also enabled depictions of several research locations in one comic. The locations drawn were mostly realistic laboratories, classrooms or outdoor locations, but few exceptions were found. In two cases the comic style encouraged to draw a fictional character, which in turn affected the location. One drew Donald Duck working in lab located in Scrooge’s money vault, and other drew Indiana Jones exploring an ancient temple.
Appearance of scientists
54 comics (51.9%) included elements related to the appearance of a scientist. In most comics the scientists were presented as the protagonists of the story. In addition to the protagonist of the study, some comics included other scientists or researchers in the roles of colleagues or supervisors (e.g. ). Often scientist were drawn with one or more indicators for the standard image of a scientist (see Chambers Citation1983), such as lab coat, safety goggles or eyeglasses and facial hair (see and ). To highlight the stereotypical nature of these indicators, one of the comics () depicted a stereotypical scientist with glasses, beard and a test tube in his hand as a painting on the wall.
In 63 comics (60.6%) the characters were drawn as stick figures (e.g. , , and ). However, captions and speech bubbles were frequently used to provide more information about the scientists. For example, in text caption specifies the gender of the stick figure by referring the scientist as ‘Mister Doctor’. Similarly in , the aging causes the scientist to grow a beard indicating that the scientist is a male.
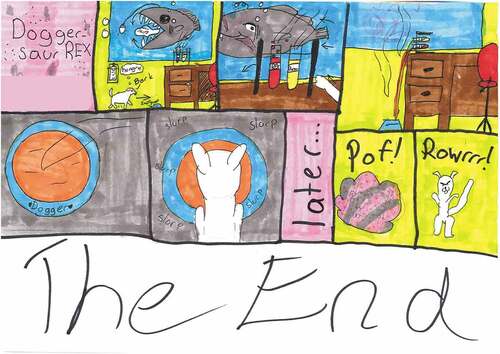
Comic books often use anthropomorphic animals as protagonists, but only 8 comics included fictional characters or talking, thinking or otherwise anthropomorphic animals. For example, depicts a dog walking in a laboratory or office, where test tubes are located on the table. Hungry dog knocks the test tubes over to its bowl and drinks it. Then he magically turns into a doggersaur rex, a hybrid between a dog and a tyrannosaurus rex.
Figure 5. Doggersaur rex illustrating how science is connected to serendipity.NOTE: A dog is walking in a laboratory or an office. For no apparent reason, an anglerfish is eating another fish on the background. The dog knocks two test tubes into his bowl and after eating it, the dog turns into a hybrid of a dog and a dinosaur.
Discussion
As expected, almost all analysed comics included depictions of scientific activities. Thus, the simple prompt used in the DASC seemed successful in providing analysable information about children’s conceptions of scientific activities without the need to resort to longer prompts or additional questionnaires. Sequential narratives seemed also to enable depicting the activities in more detailed way as well as rationales for them (cf. Reinisch et al. Citation2017). For example, in the liquids are intentionally mixed but in they are accidentally mixed by knocking them over. Such depictions could provide insights on how children perceive science as a process of investigation.
The sequential storytelling and the use of speech bubbles for depicting dialogue also enabled the expression of variety of science-related emotions and attitudes. For example, one of the emotions connected with the process of scientific inquiry was the frustration stemming from failed experiments (see ). Previous studies have shown that emotions such as failure and frustration as well as the joy of overcoming challenges are integral part of inquiry learning (e.g. Lamminpää and Vesterinen Citation2018; Veermans and Järvelä Citation2004). Even though low to moderate levels of some negative emotions such as anxiety can sometimes be seen as encouraging or even motivating by the students, some emotions and attitudes can have a detrimental effect on children’s willingness to study natural sciences (e.g. Archer et al. Citation2013; Tulis and Fulmer Citation2013). For example, in the one of the comics () the final thoughts of the scientists on his deathbed illustrate that perhaps he should have sacrificed less of his life to science. Such storylines show a belief that while scientists find science fascinating and are overtly devoted to their research, non-scientist find science uninteresting or even repulsive (see also ). Such attitudes might make children reluctant to show their interest in science, because they know their peers, friends or family might find it unpleasant or uninteresting (cf. DeWitt and Archer Citation2015; Jenkins and Nelson Citation2005; Kärnä, Hakonen, and Kuusela Citation2012; Rahm and Charbonneau Citation1997). On the other hand, some comics presented scientific discoveries merely through coincidences and serendipity (see ), which might illustrate a conception that succeeding in science depends on luck rather than hard work.
Various labels and text captions were frequently used to provide more information about scientific activities, emotions and attitudes, research locations as well as appearance of scientists. The labels were added most likely to ensure that the reader understands the drawing as it was intended. Thus, through the use of labels and text captions, in the DASC the participants might be able to compensate their lack of skill to illustrate their conceptions (cf. Losh, Wilke, and Pop Citation2008).
However, the comic might also invoke certain undesired aspects like added excitement or funny instances. Similarly, they might invite to draw explosions which were often displayed in the comics. In comparison, recent DAST studies have less elements of danger among primary school students varying from almost non-existent to 9.0% (e.g. Emvalotis and Koutsianou Citation2018; Türkmen Citation2008) whereas 43.3% of the comics included dangerous elements. Even though many mythic and dangerous elements have diminished during the last 50 years (see Finson Citation2002), many adults consider that scientific work is dangerous (NSB Citation2002). The children may well share the same stereotypic conception of science as dangerous, but in DAST the single picture favors the display of static indicators such as warning signs, dangerous chemicals and poison (see Chambers Citation1983). Therefore, DASC might be more suited to present dangerous elements that are related to scientist’s activities, like mixing liquids. Even though elements of danger are sometimes seen as a negative stereotype which might discourage students’ interest in science, it should also be noted that for children such elements can also be a source of excitement.
In depicting the appearance of scientists, the use of stick figures was rather prevalent. This was expected because drawing more detailed characters is more time-consuming than drawing a single picture, and stick figures were chosen to have more time to focus on the story itself. Even though text captions (see ) and progressing storyline (see ) provided more details about the scientists, the stick figures were mainly plain, and the only added information was usually the gender of the scientist.
Limitations of the DASC
Some limitations must be noted before drawing conclusions. Firstly, the sample has a bias as the participants are voluntarily taking part in a science camp. Secondly, no alternative tests were used to analyse the meaning of the drawings or the children’s attitudes towards science. We acknowledge that the sample might not present a general group of children and for more reliable results the data should be collected randomly from children, for example from different schools and different grades.
The DAST has received critique regarding the children’s ability to illustrate what they actually perceive (e.g. Losh, Wilke, and Pop Citation2008) and this applies also to the DASC. Especially with younger children, one should also take into account that some children are not confident enough in their skills to draw a comic or simply do not like to draw (e.g. Einarsdottir, Dockett, and Perry Citation2009). This is especially crucial since drawing a comic is a more complicated task than drawing a single picture. Comics offer the possibility to use text captions, speech balloons and sound effects to convey information, but no complex writing is required. This gives the children the freedom to choose what type of communication they prefer – written or drawn. For children aged 8 to 13 the task of drawing a comic is reasonable, but more research is needed to see if it is suited for the youngest primary school students. In the end, indirect measurement methods, such as the DASC, might still be advantageous as younger children may lack the skill to express themselves by writing (see Cvencek and Meltzoff Citation2015).
To comply with the prompt given, students are likely to draw something they consider recognizable for the viewer. This can lead students to illustrate heavily stereotypical situations and characters. Also using the word ‘comic’ in the prompt might invite children to draw elements typical for comics, such as cartoon characters, accidents, dangerous situations and funny instances. Thus, much like with DAST (see Finson and Pederson Citation2011; Toma, Greca, and Orozco Gómez Citation2018), researchers using DASC should be careful when making conclusions about students’ conceptions of science and scientists based solely on the drawings.
To help researchers in validating the interpretations made from drawings, more recent versions of DAST have adapted questionnaires and interviews as a part of the protocol (see Chang et al. Citation2020), and it would be advisable to use similar techniques with DASC. Due to the young age of the participants, an open interview would probably be the most viable option, as it also enables the children to assign meaning and value to their drawings (cf. Reinisch et al. Citation2017; Einarsdóttir Citation2007). Use of such interviews would allow the researcher to verify what is drawn and how the drawings reflect children’s actual conceptions. The use of alternative prompts not using the word ‘comic’, such as ‘draw a story about how you think science is made’, could also be used to reduce the number of elements typical for comics.
Conclusions
As we expected based on the previous studies (see Mehlmann Citation2018), the use of draw-a-comic task as a tool allowed and invited the children to tell stories about scientists and science (see Eisner Citation2008; McCloud Citation1994). In the analysed comics, the children used sequential pictures to depict actions and processes, speech bubbles to depict dialogue between characters as well as text captions to provide additional details and clarifications. This provided us with plenty of analysable information about scientific research as an activity as well as emotions and attitudes related to science. The children also used text captions, speech bubbles and explanations to provide additional details about research locations and appearance of scientists. However, although the use of sequential pictures enabled the depiction of several research locations within one comic, the types of the locations were similar to ones appearing the DAST studies (e.g. Emvalotis and Koutsianou Citation2018). It should also be pointed out, that the prevalence of stick figures and anthropomorphic animals makes the traditional draw-a-scientists task more suitable for studies focusing on children’s stereotypes about the appearance of a scientist.
Describing scientific research as an activity is difficult using only one static picture and therefore later modified versions of DAST have included an explicit prompt for a written description of what the scientists do (e.g. Farland-Smith Citation2012; Reinisch et al. Citation2017). In contrast to modified DAST, the DASC provides more information about children’s conceptions and stereotypes regarding scientific activities without the need for a longer and explicit prompt. These stereotypes include the traditional working in a chemistry laboratory (e.g. Emvalotis and Koutsianou Citation2018), but also indicate other possible stereotypes such as activity-related explosions. The activities are portrayed through sequential pictures which include additional information about the activities as they provide a timeline and add meaning to the instruments used (cf. Reinisch et al. Citation2017). The activities show a variety of conceptions related to making science, and a further study linking these different conceptions to children’s attitudes might help to understand why students are not considering to embark on scientific careers. As previous studies have suggested (Emvalotis and Koutsianou Citation2018; Christidou, Bonoti, and Kontopoulou Citation2016), it is probable that children’s conceptions about the activities scientists are more prominent in shaping their interest towards a scientific career than their conceptions about the appearance of scientists or the location of research.
Use of sequential storytelling also allowed the children to depict thought processes, activities during different phases of research as well as collaboration between scientists. As the closer analysis of such depictions could provide us more knowledge about how children perceive the process of scientific inquiry, the DASC might be also used to study children’s conceptions about scientific inquiry and nature of science. For example, the second comic () depicted science as a creative process seeking solutions to a practical problem. When studying such conceptions, the DASC could be used in conjunction with instruments such as the views about scientific inquiry (VASI) questionnaire (Lederman et al. Citation2014).
The DASC also provided analyzable information about the children’s conceptions of the emotions related to making science as well as the attitudes toward science and scientists. These emotions and attitudes were depicted by changes in facial expressions, in dialogue between characters as well as by explanations provided in text captions. For example, comics depicted expressions of frustration upon failure and joy of overcoming challenges during research, as well as attitudes towards science as a career, such as being mocked for being interested in science. As depicting such things in a single picture would be highly challenging, analytical frameworks used for DAST have not included such category. However, using a draw-a-comic task such depictions were rather prevalent and could probably be analyzed in even more detail.
According to previous research (e.g. Krapp and Prenzel Citation2011), affective components such as emotions and values related to science play central role in development of interest towards science. Thus, a closer analysis of depictions of such depictions might contribute to our understanding of the development of the various emotions and attitudes related to children’s interest in science. Even though DASC seems more suitable for observing scientific activities than DAST, we recommend applying both methods to a same sample and comparing the results. For future studies, we also propose using open interviews in conjunction with drawings to surpass the limitations related to making deductions about children’s actual conceptions of science and scientists. During the interview, the drawings would provide a platform on which the children can elaborate their conceptions. Finally, to verify the impact of the comic format, alternative prompts should be considered and tested.
Disclosure statement
No potential conflict of interest was reported by the author(s).
Additional information
Funding
References
- Archer, L., J. DeWitt, J. Osborne, J. Dillon, B. Willis, and B. Wong. 2013. “‘Not Girly, Not Sexy, Not Glamorous’: Primary School Girls’ and Parents’ Constructions of Science Aspirations.” Pedagogy, Culture and Society 21 (1): 171–194. doi:10.1080/14681366.2012.748676.
- Arthur, A. E., R. S. Bigler, L. S. Liben, S. A. Gelman, and D. N. Ruble. 2008. “Gender Stereotyping and Prejudice in Young Children: A Developmental Intergroup Perspective.” In Intergroup Attitudes and Relations in Childhood through Adulthood., edited by S. R. Levy and M. Killen, 66–86. New York, NY: Oxford University Press.
- Aschbacher, P. R., E. Li, and E. J. Roth. 2010. “Is Science Me? High School Students’ Identities, Participation and Aspirations in Science, Engineering, and Medicine.” Journal of Research in Science Teaching 47 (5): 564–582. doi:10.1002/tea.20353.
- Ball, M., and G. Smith. 1992. “Analyzing Visual Data.” Thousand Oaks, California. doi:10.4135/9781412983402.
- Bayri, N., M. S. Koksal, and P. Ertekin. 2016. “Investigating Gifted Middle School Students’ Images about Scientists: A Cultural Similarity Perspective.” Science Education International 27 (1): 136–150.
- Britner, S. L. 2008. “Motivation in High School Science Students: A Comparison of Gender Differences in Life, Physical, and Earth Science Classes.” Journal of Research in Science Teaching 45 (8): 955–970. doi:10.1002/tea.20249.
- Brown, G. T. L., and Z. Wang. 2013. “Illustrating Assessment: How Hong Kong University Students Conceive of the Purposes of Assessment.” Studies in Higher Education 38 (7): 1037–1057. doi:10.1080/03075079.2011.616955.
- Cabe Trundle, K., R. K. Atwood, J. E. Christopher, and M. Sackes. 2010. “The Effect of Guided Inquiry-Based Instruction on Middle School Students’ Understanding of Lunar Concepts.” Research in Science Education 40 (3): 451–478. doi:10.1007/s11165-009-9129-x.
- Cakmakci, G., O. Tosun, S. Turgut, S. Orenler, K. Sengul, and G. Top. 2011. “Promoting an Inclusive Image of Scientists among Students: Towards Research Evidence-Based Practice.” International Journal of Science and Mathematics Education 9 (3): 627–655. doi:10.1007/s10763-010-9217-4.
- Calabrese Barton, A., H. Kang, E. Tan, T. B. O’Neill, J. Bautista-Guerra, and C. Brecklin. 2013. “Crafting a Future in Science: Tracing Middle School Girls’ Identity Work over Time and Space.” American Educational Research Journal 50 (1): 37–75. doi:10.3102/0002831212458142.
- Campbell, T., C. Schwarz, and M. Windschitl. 2016. “What We Call Misconceptions May Be Necessary Stepping-Stones toward Making Sense of the World.” Science and Children 53 (7): 28–33.
- Chambers, D. W. 1983. “Stereotypic Images of the Scientist: The Draw-a-Scientist Test.” Science Education 67 (2): 255–265. doi:10.1002/sce.3730670213.
- Chang, H. Y., T. J. Lin, M. H. Lee, S. W. Y. Lee, T. C. Lin, A. L. Tan, and C. C. Tsai. 2020. “A Systematic Review of Trends and Findings in Research Employing Drawing Assessment in Science Education.” Studies in Science Education 56 (1): Routledge: 77–110. doi:10.1080/03057267.2020.1735822.
- Christidou, V. 2011. “Interest, Attitudes And Images Related To Science: Combining Students ’ Voices with the Voices of School Science, Teachers, and Popular Science.” International Journal of Environmental Science Education 6 (2): 141–159.
- Christidou, V., F. Bonoti, and A. Kontopoulou. 2016. “American and Greek Children’s Visual Images of Scientists: Enduring or Fading Stereotypes?” Science and Education 25 (5–6): Springer Netherlands: 497–522. doi:10.1007/s11191-016-9832-8.
- Cvencek, D., and A. N. Meltzoff. 2015. “Developing Implicit Social Cognition in Early Childhood: Methods, Phenomena, Prospects.” In The Routledge International Handbook of Young Children’s Thinking and Understanding, edited by S. Flannery Quinn and S. Robson, 43–53. Abingdon, England: Routledge.
- DeWitt, J., and L. Archer. 2015. “Who Aspires to A Science Career? A Comparison of Survey Responses from Primary and Secondary School Students.” International Journal of Science Education 37 (13): Taylor & Francis: 2170–92. doi:10.1080/09500693.2015.1071899.
- Dikmenli, M. 2010. “Misconceptions of Cell Division Held by Student Teachers in Biology: A Drawing Analysis.” Scientific Research and Essays 5 (2): 235–247. doi:10.1073/pnas.1306508110.
- Dimopoulos, K., and Z. Smyrnaiou. 2005. “Factors Related to Students’ Interest in Science Learning.” In Science Education at Cross Roads: Meeting the Challenges of the 21st Century, edited by D. Koliopoulos and A. Vavouraki, 135–142. Athens: Association for Science Education.
- Dove, J. E., L. A. Everett, and P. F. W. Preece. 1999. “Exploring a Hydrological Concept through Children’s Drawings.” International Journal of Science Education 21 (5): 485–497. doi:10.1080/095006999290534.
- Duit, R., H. Gropengießer, U. Kattmann, M. Komorek, and I. Parchmann. 2012. “The Model of Educational Reconstruction – A Framework for Improving Teaching and Learning Science.” In Science Education Research and Practice in Europe: Retrospective and Prospective, edited by D. Jorde and J. Dillon, 13–37. Rotterdam: SensePublishers. doi:10.1007/978-94-6091-900-8_2.
- Ehrlen, K. 2009. “Drawings as Representations of Children’s Conceptions.” International Journal of Science Education 31 (1): 41–57. doi:10.1080/09500690701630455.
- Einarsdóttir, J. 2007. “Research with Children: Methodological and Ethical Challenges.” European Early Childhood Education Research Journal 15 (2): 197–211. doi:10.1080/13502930701321477.
- Einarsdottir, J., S. Dockett, and B. Perry. 2009. “Making Meaning: Children’s Perspectives Expressed through Drawings.” Early Child Development and Care 179 (2): 217–232. doi:10.1080/03004430802666999.
- Eisner, W. 2008. Graphic Storytelling and Visual Narrative. Will Eisner Instructional Books. New York: W. W. Norton & Company.
- Emvalotis, A., and A. Koutsianou. 2018. “Greek Primary School Students’ Images of Scientists and Their Work: Has Anything Changed?” Research in Science and Technological Education 36 (1): Routledge: 69–85. doi:10.1080/02635143.2017.1366899.
- Erduran, S., and E. Kaya. 2018. “Drawing Nature of Science in Pre-Service Science Teacher Education: Epistemic Insight through Visual Representations.” Research in Science Education 48 (6): Research in Science Education: 1133–49. doi:10.1007/s11165-018-9773-0.
- Farland-Smith, D. 2012. “Development and Field Test of the Modified Draw-a-Scientist Test and the Draw-a-Scientist Rubric.” School Science and Mathematics 112 (2): 109–116. doi:10.1111/j.1949-8594.2011.00124.x.
- Farland-Smith, D., K. Finson, W. J. Boone, and M. Yale. 2012. “An Investigation of Media Influences on Elementary Students’ Representations of Scientists.” Journal of Science Teacher Education 25 (3): 36–40. doi:10.1007/s10972-012-9322-z.
- Finson, K., and J. Pederson. 2011. “What are Visual Data and What Utility Do They Have in Science Education?” Journal of Visual Literacy 30 (1): Routledge: 66–85. doi:10.1080/23796529.2011.11674685.
- Finson, K. D. 2002. “Drawing a Scientist: What We Do and Do Not Know after Fifty Years of Drawings.” School Science and Mathematics 102 (7): 335–345. doi:10.1111/j.1949-8594.2002.tb18217.x.
- Finson, K. D., J. B. Beaver, and B. L. Cramond. 1995. “Development and Field Test of a Checklist for the Draw-a-Scientist Test.” School Science and Mathematics 95 (4): 195–205. doi:10.1111/j.1949-8594.1995.tb15762.x.
- Fung, Y. Y. H. 2002. “A Comparative Study of Primary and Secondary School Students‘ Images of Scientists.” Research in Science & Technological Education 20 (2): 199–213. doi:10.1080/0263514022000030453.
- Galdi, S., M. Cadinu, and C. Tomasetto. 2014. “The Roots of Stereotype Threat: When Automatic Associations Disrupt Girls‘ Math Performance.” Child Development 85 (1): 250–263. doi:10.1111/cdev.12128.
- Hansen, A. K., H. A. Dwyer, A. Iveland, M. Talesfore, L. Wright, D. B. Harlow, and D. Franklin. 2017. “Assessing Children’s Understanding of the Work of Computer Scientists.” In Proceedings of the 2017 ACM SIGCSE Technical Symposium on Computer Science Education - SIGCSE ’17, 279–284. New York, NY: ACM Press. doi:10.1145/3017680.3017769.
- Hillman, S. J., K. H. Bloodsworth, C. E. Tilburg, S. I. Zeeman, and H. E. List. 2014. “K-12 Students’ Perceptions of Scientists: Finding a Valid Measurement and Exploring whether Exposure to Scientists Makes an Impact.” International Journal of Science Education 36 (15): 2580–95. Taylor & Francis. doi:10.1080/09500693.2014.908264.
- Hsieh, W. M., and C. C. Tsai. 2017. “Exploring Students’ Conceptions of Science Learning via Drawing: A Cross-Sectional Analysis.” International Journal of Science Education 39 (3): 274–98. Taylor & Francis. doi:10.1080/09500693.2017.1280640.
- Hsieh, W.-M., and C.-C. Tsai. 2018. “Learning Illustrated: An Exploratory Cross-Sectional Drawing Analysis of Students’ Conceptions of Learning.” The Journal of Educational Research 111 (2): Taylor & Francis: 139–50. doi:10.1080/00220671.2016.1220357.
- Jenkins, E. W., and N. W. Nelson. 2005. “Important but Not for Me: Students’ Attitudes Towards Secondary School Science in England.” Research in Science & Technological Education 23 (1): 41–57. doi:10.1080/02635140500068435.
- Johnson, R. B., and A. J. Onwuegbuzie. 2011. “Mixed Methods Research: A Research Paradigm Whose Time Has Come.” Educational Researcher 33 (7): 14–26. doi:10.3102/0013189X033007014.
- Kärnä, P., R. Hakonen, and J. Kuusela. 2012. Luonnontieteellinen Osaaminen Perusopetuksen 9. Luokalla 2011 [Natural Science Know-How in Finnish Basic Education, 9th Grade, 2011]. Tampere:Finnish National Agency for Education.
- Krapp, A., and M. Prenzel. 2011. “Research on Interest in Science: Theories, Methods, and Findings.” International Journal of Science Education 33 (1): 27–50. doi:10.1080/09500693.2010.518645.
- Kress, G. R. 2010. Multimodality: A Social Semiotic Approach to Contemporary Communication. New York: Routledge.
- Kuttner, P. J., N. Sousanis, and M. B. Weaver-Hightower. 2017. “How to Draw Comics the Scholarly Way.” In Handbook of Arts-Based Research, edited by P. Leavy, 396–422, London: Guilford Publications.
- Lamminpää, J., and V.-M. Vesterinen. 2018. “The Use of Humour during a Collaborative Inquiry.” International Journal of Science Education 40 (14): 1718–1735. Taylor & Francis. doi10.1080/09500693.2018.1508926.
- Lederman, J. S., N. G. Lederman, S. A. Bartos, S. L. Bartels, A. A. Meyer, and R. S. Schwartz. 2014. “Meaningful Assessment of Learners’ Understandings about Scientific Inquiry - the Views about Scientific Inquiry (VASI) Questionnaire.” Journal of Research in Science Teaching 51 (1): 65–83. doi:10.1002/tea.21125.
- Lee, T. R. 2010. “Young Children’s Conceptions of Science and Scientists.” PhD diss., University of Washington. https://search.proquest.com/docview/756262370.
- Losh, S. C., R. Wilke, and M. Pop. 2008. “Some Methodological Issues with ‘Draw a Scientist Tests’ among Young Children.” International Journal of Science Education 30 (6): 773–792. doi:10.1080/09500690701250452.
- Losh, S. C. 2010. “Stereotypes about Scientists over Time among US Adults: 1983 and 2001.” Public Understanding of Science 19 (3): 372–382. doi:10.1177/0963662508098576.
- Maltese, A. V., and R. H. Tai. 2011. “Pipeline Persistence: Examining the Association of Educational Experiences with Earned Degrees in STEM among U.S. Students.” Science Education 95 (5): 877–907. doi:10.1002/sce.20441.
- Maoldomhnaigh, M., and Á. Hunt. 1988. “Some Factors Affecting the Image of the Scientist Drawn by Older Primary School Pupils.” Research in Science & Technological Education 6 (2): 159–166. doi:10.1080/0263514880060206.
- McCarthy, D. 2015. “Teacher Candidates’ Perceptions of Scientists: Images and Attributes.” Educational Review 67 (4): Routledge: 389–413. doi:10.1080/00131911.2014.974510.
- McCloud, S. 1994. Understanding Comics: The Invisible Art. New York: HarperPerennial.
- McCusker, K., and S. Gunaydin. 2015. “Research Using Qualitative, Quantitative or Mixed Methods and Choice Based on the Research.” Perfusion (United Kingdom) 30 (7): 537–542. doi:10.1177/0267659114559116.
- Mehlmann, M. 2018. “Looking the Monster in the Eye: Drawing Comics for Sustainability.” In EarthEd - Rethinking Education on a Changing Planet, edited by E. Assadourian and L. Mastny, 117–128. Washington, DC: IslandPress.
- Meyer, C., L. Guenther, and M. Joubert. 2019. “The Draw-a-Scientist Test in an African Context: Comparing Students’ (Stereotypical) Images of Scientists across University Faculties.” Research in Science & Technological Education 37 (1): Routledge: 1–14. doi:10.1080/02635143.2018.1447455.
- Miele, E. 2014. “Using the Draw-a-Scientist Test for Inquiry and Evaluation.” Journal of College Science Teaching 43 (4): 36–40. doi:10.2505/4/jcst14_043_04_36.
- Miller, D. I., K. M. Nolla, A. H. Eagly, and D. H. Uttal. 2018. “The Development of Children’s Gender-Science Stereotypes: A Meta-Analysis of 5 Decades of U.S. Draw-A-Scientist Studies.” Child Development: 1–13. doi:10.1111/cdev.13039.
- Mitchell, C., L. Theron, J. Stuart, A. Smith, and Z. Campbell. 2011. “Drawings as a Research Method.” In Picturing Research: Drawing as Visual Methodology, edited by L. Theron, C. Mitchell, A. Smith, and J. Stuart, 19–36. Rotterdam: SensePublishers. doi:10.1007/s13398-014-0173-7.2.
- National Science Board. 2002. Science and Engineering Indicators 2002. Vol. 1. Arlington, VA: National Science Foundation.
- Oktay, O., and K. Eryurt. 2012. “How High School Students Represent the Image of Scientists in Their Minds.” Procedia - Social and Behavioral Sciences 46: 2482–2486. doi:10.1016/j.sbspro.2012.05.507.
- Pratt, H. J. 2009. “Narrative in Comics.” The Journal of Aesthetics and Art Criticism 67 (1): 107–117. doi:10.1111/j.1540-6245.2008.01339.x.
- Prosser, J., and C. Burke. 2008. “Image-Based Educational Research: Childlike Perspectives.” In Handbook of the Arts in Qualitative Research: Perspectives, Methodologies, Examples, and Issues, edited by J. G. Knowles and A. L. Cole, 1st ed., Vol. 4, 407–420. Thousands Oaks, CA: SAGE Publications. doi:10.4135/9781452226545
- Rahm, J., and P. Charbonneau. 1997. “Probing Stereotypes through Students’ Drawings of Scientists.” American Journal of Physics 65 (8): American Association of Physics Teachers: 774–78. doi:10.1119/1.18647.
- Reinisch, B., M. Krell, S. Hergert, S. Gogolin, and D. Krüger. 2017. “Methodical Challenges Concerning the Draw-A-Scientist Test: A Critical View about the Assessment and Evaluation of Learners’ Conceptions of Scientists.” International Journal of Science Education 39 (14): Taylor & Francis: 1952–75. doi:10.1080/09500693.2017.1362712.
- Schibeci, R. 2006. “Student Images of Scientists: What are They? Do They Matter?” Teaching Science 52 (2): 12–16.
- Selwyn, N., D. Boraschi, and S. M. Özkula. 2009. “Drawing Digital Pictures: An Investigation of Primary Pupils’ Representations of ICT and Schools.” British Educational Research Journal 35 (6): 909–928. doi:10.1080/01411920902834282.
- Spiegel, A. N., J. McQuillan, P. Halpin, C. Matuk, and J. Diamond. 2013. “Engaging Teenagers with Science through Comics.” Research in Science Education 43 (6): 2309–2326. doi:10.1007/s11165-013-9358-x.
- Symington, D., and H. Spurling. 1990. “The ‘Draw a Scientist Test’: Interpreting the Data.” Research in Science & Technological Education 8 (1): Routledge: 75–77. doi:10.1080/0263514900080107.
- Tan, A. L., J. A. Jocz, and J. Zhai. 2017. “Spiderman and Science: How Students’ Perceptions of Scientists are Shaped by Popular Media.” Public Understanding of Science 26 (5): 520–530. doi:10.1177/0963662515615086.
- Tatalovic, M. 2009. “Science Comics as Tools for Science Education and Communication: A Brief, Exploratory Study.” Journal of Science Communication 8 (4): 4. doi:10.22323/2.08040202.
- Toma, R. B., I. M. Greca, and M. L. O. Gómez. 2018. “Una Revisión Del Protocolo Draw-a-Scientist-Test (DAST) [A Review of the Draw-a-Scientist-Test (DAST) Protocol].” Revista Eureka Sobre Enseñanza y Divulgación de Las Ciencias 15 (3): 1–19. doi:10.25267/Rev_Eureka_ensen_divulg_cienc.2018.v15.i3.3104.
- Tulis, M., and S. M. Fulmer. 2013. “Students’ Motivational and Emotional Experiences and Their Relationship to Persistence during Academic Challenge in Mathematics and Reading.” Learning and Individual Differences 27: Elsevier Inc.: 35–46. doi:10.1016/j.lindif.2013.06.003.
- Türkmen, H. 2008. “Turkish Primary Students’ Perceptions about Scientist and What Factors Affecting the Image of the Scientists.” Eurasia Journal of Mathematics, Science and Technology Education 4 (1): 55–61. doi:10.12973/ejmste/75306.
- van der Veen, J. 2017. “Draw Your Physics Homework?: Art as a Path to Understanding and Assessment in Undergraduate Science Education.” Drawing for Science Education: An International Perspective 49 (2): 11–29. doi:10.1007/978-94-6300-875-4_2.
- Veermans, M., and S. Järvelä. 2004. “Generalized Achievement Goals and Situational Coping in Inquiry Learning.” Instructional Science 32 (4): 269–291. doi:10.1023/B:TRUC.0000026465.74406.47.
- Walls, L. 2012. “Third Grade African American Students’ Views of the Nature of Science.” Journal of Research in Science Teaching 49 (1): 1–37. doi:10.1002/tea.20450.
- Weingart, P. 2008. “The Ambivalence Towards New Knowledge: Science in Fiction Film.” In Science Images and Popular Images of the Sciences, edited by B. Hüppauf and P. Weingard, 267–282. 1st ed. New York: Routledge.