
ABSTRACT
Background
Intercoder reliability is a statistic commonly reported by researchers to demonstrate the rigour of coding procedures during data analysis. Its importance is debatable in the analysis of qualitative interview data. It raises a question on whether researchers should identify the same codes and themes in a transcript or they should produce different accounts in analyzing the transcript.
Purpose
This study reports how articles in four science education journals, International Journal of Science Education, Research in Science Education, Journal of Research in Science Teaching and Science Education report intercoder reliability in their analysis of interview data.
Methods
This article explores whether 103 papers published in these science education journals in a single year (2019) have reported intercoder reliability test when the authors analyse their interview data. It was found that 19 papers have reported the test results.
Findings
The authors of these studies have different interpretation towards a similar value of intercoder reliability. Moreover, the percentage of data used in the intercoder reliability test and the identity of intercoder vary across the studies. As a result, this paper aims to raise an issue on whether a replicability of coding can show the reliability of the results when researchers analyze interview data.
Conclusion
We propose two major principles when authors report the reliability of the analysis of interview data: transparency and explanatory. We also argue that only when the authors report intercoder reliability test results that are based on these two principles, the reliability statistics of studies are convincing to readers. Some suggestions are offered to authors regarding how to carry out, analyze and report the intercoder reliability test.
1. Introduction
Qualitative interview is an important method in science education research because it can be used to explore students’ understanding of scientific concepts (Cheung and Winterbottom Citation2021; Tai; CitationForthcoming) and teachers’ knowledge for teaching science in an in-depth manner. To enhance the reliability of data analysis of interview transcripts, researchers begin to use the intercoder reliability test. Intercoder reliability is ‘a numerical measure of the agreement between different coders regarding how the same data should be coded’ (O’Connor and Joffe Citation2020, 1).
Researchers commonly conflate intercoder reliability and interrater reliability (O’Connor and Joffe Citation2020). Interrater reliability can be applied to data rated on an ordinal or interval scale with a fixed scoring rubric, while intercoder reliability can be applied to nominal data, such as interview data (O’Connor and Joffe Citation2020). Some of the science education studies that use interviews begin to report the results of the intercoder reliability test. In quantitative research, interrater reliability ensures that two or more raters assign the same score to the same responses. However, the role of the intercoder reliability test is still unclear in qualitative research, especially in analysing interview data in science education research. Unlike questionnaire, interview data does not have a fixed number of codes. Different coders can segment or analyse interview data in different ways (Marques and McCall Citation2005).
In this study, we identify how researchers in science education conduct intercoder reliability tests. Until now, there is no specific article that recommends researchers in science education when and how to conduct and report intercoder reliability tests. Debates on the report of reliability statistics in science education arise. For example, Taber (Citation2018) reported that the reliability statistic, Cronbach’s alpha, was misused in science education studies. Researchers in science education did not report how they obtained Cronbach’s alpha and had various interpretations on Cronbach’s alpha. As readers, reviewers and authors of research studies in science education, we also noticed a similar issue in the analysis of interview data by different research studies in the field. We can see that some researchers in science education conflate interrater reliability and intercoder reliability. By discussing the examples from science education, this study will form a basis for discussion between researchers who are studying the methodological issues in interview data analysis in science education. The findings of this study can also be applied to other fields. However, we hope to locate the relevant literature in the field of science education. Therefore, the findings of this study are visible to researchers who are investigating ways to improve the trustworthiness of reliability statistics in science education research.
We also hope that our work can stimulate researchers who are working in specific areas of science education to discuss when and how intercoder reliability can be applied to their areas. Brock and Taber (Citation2017) contended that variability should not be seen as a hindrance when researchers were analysing the changes in students’ conceptual structures using the microgenetic method. The authors (2017) also thought that researchers should engage in small and unorganized changes in students’ conceptual structures. Therefore, applying intercoder reliability to these studies might not be suitable, as different coders might identify different tiny changes in students’ interview data.
In this paper, we present a review of science education research studies, which report qualitative interview data. By surveying articles in the year of 2019 from four leading science education journals, namely International Journal of Science Education, Research in Science Education, Journal of Research in Science Teaching and Science Education, we examine whether these studies have used intercoder reliability statistics as a means to establish reliability. Afterward, the ways of how these studies reported intercoder reliability will be analysed. The results aim to address the following research questions:
RQ1. Does qualitative interview data analysis in science education studies report the results of the intercoder reliability test?
RQ2(a). If the studies have carried out the intercoder reliability test, how do these studies use the terminology to name their test?
RQ2(b). If the studies have carried out the intercoder reliability test, how do these studies carry out the intercoder reliability test?
RQ2(c). If the studies have carried out the intercoder reliability test, how do these studies report the results of the intercoder reliability test?
2. Differences between intercoder reliability and interrater reliability
Intercoder reliability is calculated based on the extent to which two or more coders agree on the codes applied to a fixed set of units in qualitative data (Kurasaki Citation2000); interrater reliability measures the degree of the differences in ratings between independent raters on the same artefact (Tinsley & Weiss, Citation2000; Gwet Citation2014). In other words, interrater reliability refers to a situation where two researchers assign values that are already well defined, while intercoder reliability can be applied to measure the degree of agreement when two coders apply codes to related data units in a transcript to validate coding (Gwet Citation2014). Both terminologies have been used in some of the science education studies interchangeably which use interview as a primary data collection method.
For example, Zohar and Levy (Citation2019) measured the ‘inter-rater reliability’ of students’ conceptions of chemical bonding. However, the knowledge elements extracted from the transcripts are attraction, completion, sharing, distance between atoms (implicitly), distance between atoms (explicitly), repulsion and dynamics. The codes are not pre-defined and emerge from the dataset. In another study, Hecht, Knutson, and Crowley (Citation2019) were ‘testing for the inter-rater reliability’ but they identified different types of nature-related experiences. These studies conducted reliability for measuring the consensus of applying the same code to a data unit, instead of measuring the degree of differences in ratings between two raters. We can see that different science education studies use a terminology that differs from its referent.
3. The use of intercoder reliability in interview research
Intercoder reliability can reflect on how different coders agree on the themes that emerged from the data, so this can serve as a proxy for validating the constructs that emerged from the interview data (Ryan Citation1999). Hence, reliability or the consistency of the rating is seen as important because the results should be generalizable and not be the idiosyncratic result of a researcher’s judgment. However, the report of intercoder reliability can be disagreed by some researchers owing to the following factors: (1) intercoder reliability contradicts the paradigm of qualitative research as most qualitative reliability rejects the “single and ‘true’ reality (Braun and Clarke Citation2013; Hollway and Jefferson 2013); (2) there are not any fixed rules on the proportion of data to be coded, the ways of segmenting data and the level of interdependence of coders (O’Connor and Joffe Citation2020); (3) the studies do not provide a detailed explanation of how they obtain intercoder reliability indices, such as the levels of measurements, the ways of reporting reliability and the number of coders (Feng Citation2014);
Qualitative interview is one of the most common data sources, which is used in qualitative and mixed method research (Taber Citation2013). It often adopts an interpretivist approach. According to Taber (Citation2013), interpretivist research assumes that ‘the research relies upon the (inevitably somewhat subjective) interpretation of a particular human being who will necessarily bring his or her own idiosyncratic experiences and understanding to the interpretations made’ (p. 45). Typically, interviews can be analysed inductively and/or deductively. The deductive approach involves the use of structure, theory or predetermined concepts and categories to conduct the interview analysis, whereas the inductive approach entails little or no predetermined theory, structure or framework when analyzing the data (Spradley Citation1979). Formal interviews are typically divided into structured, semi-structured and open (Richards Citation2003). The semi-structured interviews are based on themes to address, but they are unstructured enough to leave room for the interview to ‘facilitate the open expression of the informant’s perspective on the world’ (Hammersley and Atkinson Citation2007, 129). The interviewer and interviewees are free in semi-structured interviews to deviate from the questions and engage in topics that arise in the course of the interaction. Alternatively, informal interviews can take place spontaneously rather than being scheduled with participants in advance. This contrasts with quantitative research, which assumes that the knowledge produced must be agreed by all observers (Taber Citation2013). If researchers adopt an interpretivist approach, it is unclear whether reporting the results of the intercoder reliability test can strengthen the subjective interpretation of the experiences and understandings of a human being.
Some qualitative methodologies, such as ethnography, use other means to reduce the threat of reliability. It is important to note that calculating and reporting intercoder reliability is not the only way to strengthen the reliability of the analysis of the interview data. For instance, ethnographic research occurs in natural settings and unique situations cannot be reconstructed accurately because human behaviour is never static (LeCompte and Goetz Citation1982). The individual and personal nature of the ethnographic process also prevents researchers from replicating the findings of another because ‘the flow of information is dependent on the social role held within the studied group and the knowledge deemed appropriate for incumbents of that role to possess’ (LeCompte and Goetz Citation1982, 37). In other words, collecting ethnographic data depends on the social relationship of the researcher with the participants and different researchers can potentially yield different findings. Hence, it is vital for ethnographers to acknowledge their role as a researcher and status within the community/group investigated. Additionally, researchers should describe the ethnographic accounts in sufficient detail in order to allow other researchers to assess the quality of the findings and check for logical and empirically supported claims. In this way, the source of analysis, as well as the analytic process, has to be described as much as possible in order to depict a faithful and accurate rendition of the participants’ lived experiences. Another strategy that is typically used by qualitative researchers is to adopt constant comparative methods to analyze interview data. The constant comparative method is a constant process of moving back and forth between the similarities and differences of the emerging categories against the data collected. Having identified a common feature that integrates instances of a phenomenon, the researcher needs to refocus on divergences within a category in order to distinguish any emerging subcategories. By doing so, this ensures that the researcher does not merely create categories but also divides them into smaller units of meaning. The ultimate goal of constant comparative analysis is to unite and integrate categories in a manner that all instances of variation can be captured by the emerging theory (Glaser and Strauss Citation1967).
As explained, intercoder reliability, often perceived as a function of standardizing research procedures, is a complex issue in qualitative research, and it has to be addressed by various strategies to reduce threats to reliability. Hence, in this paper, we argue that the necessity of calculating intercoder reliability depends on the nature of the qualitative studies and it is not always useful for some qualitative studies to include intercoder reliability rate.
4. Conducting intercoder reliability test
There is no review of science education studies on the practice of conducting intercoder reliability tests in analysing interview data. By comparing these studies and the methodology literature, we aim to identify the potential gap and provide suggestions for improving the use of intercoder reliability statistics in science education studies.
Jansen, Knippels, and Van Joolingen (Citation2019) conducted intercoder reliability when they analysed students’ understanding of concept-process models. The authorsstated that ‘Ten percent of the interviews were coded by a second independent coder. For this, the second coder received the transcribed interview in which the fragments that were coded by the first coder were highlighted’ (p. 987). Conducting intercoder reliability helps them examine if two coders can apply identical codes to the same transcript fragments. Three major problems may be arisen from this practice: (1) the reliability of segmenting interview transcripts into fragments is not established (Campbell et al. Citation2013); (2) this reliability value cannot enhance the reliability of the process of creating the coding scheme; (3) the test serves as a post-hoc test instead of improving the reliability of data analysis procedures (Morse et al. Citation2002). This kind of ‘ready-made’ data should theoretically yield a higher intercoder reliability because the coding scheme has been established and the interview transcripts have been well segmented.
Moreover, authors do not explain their choices of choosing the coder. In one example, Zohar and Levy (Citation2019) stated that ‘The first author and a research assistant independently coded the same quotes of five students (22% of the students)’ (p. 888). The expertise of the research assistant is unknown, and it is likely that a research assistant is directed by his or her supervisor during the process of resolving coding disagreements. The coding process is influenced by the coders’ prior experiences and expertise. Zohar and Levy (Citation2019) studied students’ understanding of chemical bonds. The interpretation by a research assistant without a degree in chemistry and experiences of teaching chemistry is different from that who has a degree in chemistry and has substantial teaching experiences.
Apart from deciding the choice of other raters, the choice of intercoder reliability indicators should be carefully considered. Common indicators are percentage agreement and Cohen’s kappa. In one of our study of interest, Hecht, Knutson, and Crowley (Citation2019) state that ‘After reviewing the life history codes as a team and testing for intercoder reliability (Cohen’s κ = 0.75), we began to layer in our interest development coding scheme, which also had several iterations.’ (p. 696). There are three authors in their study and the calculation of Cohen’s kappa usually involves a maximum of two coders (Sun Citation2011). They also did not point out whether there were fixed numbers of units of analysis in calculating Cohen’s kappa. It cannot ensure the reliability of the process of dividing data into idea units or the process of creating coding scheme.
5. Reporting the Results of Intercoder Reliability Test
A common trend in science education articles is that authors reported a ‘satisfactory’ intercoder reliability statistic and recorded that disagreements were discussed and resolved. One example is that ‘And after several discussions and consultation with the data, consensus between the two researchers was reached across all NOS aspects’ (Khishfe Citation2019, 1166). The article does not entail how a consensus is reached. In another example, Krell et al. (Citation2019) reported that ‘After κ was calculated, the differentially coded activities have been discussed by the first two authors in order to reach a consensus for further data analysis (consensual coding)’ (p. 1327). It is unclear how to reach a consensus and what the disagreements are. Hammer and Berland (Citation2014) argue that there should be more discussion of the borderline cases, for example, illustrating the complexity and difficulties in applying a code to an idea unit. This will enable readers to interpret whether a specific code can capture the information of that idea unit.
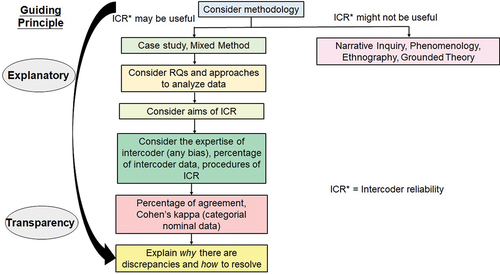
In summary, there should be careful considerations on the use of intercoder reliability statistics: (1) whether it aligns with the methodology and aims of research questions, (2) how to conduct intercoder reliability test as well as (3) how to report intercoder reliability test results. shows a framework that guides the decisions in using intercoder reliability test in science education research.
Figure 1. A framework that guides the decisions made in Intercoder Reliability (ICR*) in analyzing interview data.
6. Methodology
6.1 Search strategy and selection of papers
In order to reveal the trend of using and reporting intercoder reliability in science education, the authors decided to choose the four top journals in science education to be the focus of this study. These four journals are Journal of Research in Science Teaching (JRST), Science Education (SE), International Journal of Science Education (IJSE), Research in Science Education (RISE) (Chang, Chang, and Tseng Citation2009). These journals have the highest impact factors in the field of science education hence they are chosen for analysis. According to Taber (Citation2018), these four journals are recognized to be high-status research journals and they regularly publish empirical studies across science education. In his review of how empirical studies reported the use of Cronbach’s Alpha in Science Education, he chose these four journals for his analysis. The paper selection processes are shown in .
Figure 2. The procedures of selecting papers for analyzing the intercoder test.
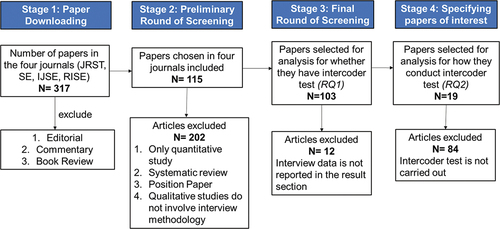
Stage 1: paper retrieving
Three hundred and seventeen papers in the issues in the year 2019 were downloaded from the search engine (Springer for RISE, Taylor and Francis for IJSE, Wiley for JRST and SE). The articles were downloaded in April 2020. Comments, book reviews, and editorials were not downloaded. In this downloading exercise, 56 articles in JRST, 47 articles in SE, 135 articles in IJSE and 79 in RISE were downloaded. In IJSE, there are 18 issues in Volume 41; in RISE, there are 6 issues in Volume 49; in JRST, there are 10 issues in Volume 10; in SE, there are 5 issues in Volume 103.
Stage 2: preliminary round of screening
We are interested in whether the studies have collected interview data. Therefore, we set out four criteria to eliminate papers: (1) papers with only quantitative data only; (2) studies that contain literature review only; (3) position papers and (4) qualitative studies that do not involve interviews. The first and second authors carefully examined the abstract and methodology section in the papers together and 115 articles were included in this round.
Stage 3: Final Round of Screening
This round of screening aims to answer the RQ1. Therefore, we further examined the results section of these papers and selected those with interview data reported. A total of 103 papers were included in this round.
Stage 4: specifying papers of interest
This round of specifying papers aims to answer the RQ2. We carefully examined the methodology section and the results section to see if an intercoder reliability indicator was reported. A total of 19 papers were included in this stage. One study was from JRST, 4 studies were from SE, 7 studies were from RISE and 7 studies were from IJSE. documents the details of these studies.
Table 1. Characteristics of 19 studies involving interview data with intercoder reliability test reported.
6.2 Data analysis
A coding protocol was designed to analyse the characteristics of studies with interview data. Our coding method is deductive coding because it is informed by pre-existing ideas and problems mentioned in the literature review section. The coding protocol is shown in .
Table 2. The codes for analysing the report of intercoder reliability in interview studies in science education research.
Two authors with rich experience in analyzing interview data reviewed 5 articles. This step examined whether the first draft of the coding protocol can be applied to the articles. It achieved 48% percentage agreement. We calculated the percentage agreement by adding up the identical codes that we applied and dividing the results by the total number of codes. We tended not to use Cohen’s kappa because of two reasons: (1) it involved a small sample of data and (2) there were different numbers of codes in different categories and the computation of Cohen’s kappa is difficult. Percentage agreement can reflect the reliability of the protocol as the protocol involves a simple coding task (Feng Citation2015).
The first draft of the protocol does not contain the ‘unknown’ codes for analyzing (3) the type of interview and (5) what coding methods these studies used. For example, some studies merely describe that their interview protocol has some guiding questions, but it is unclear how they structure their interview protocols. We also suggested that we could not infer the type of coding methods the studies used unless these studies have some clear clues in the methodology section. The study from Lane et al. (Citation2019) was classified as both inductive and deductive coding because their studies were guided by ‘prior theoretical frameworks’ and ‘open to the ideas emerging from our data’.
Moreover, some studies also reported they have carried out member cross-checking on the coding results. Due to its ambiguity, we reached a consensus that we only included those studies that carried out intercoder reliability test if they reported the numerical results of their test. We then applied the coding protocol to the same 5 articles again, and we obtained a percentage agreement of 69%. After several rounds of iteration and discussion, we applied the codes to 13 articles and obtained 87% of percentage agreement. After ensuring the reliability of the coding protocol, we individually coded the remaining articles. We cross-checked each other’s codes to ensure the results accurately reflect the use of intercoder reliability in science education studies.
7. Results
In this section, we will present the statistical results based on our data analysis.
RQ(1). Does qualitative interview data analysis in science education studies report the results of the intercoder reliability test?
shows the distribution of methodologies in qualitative studies that collect interview as a data source. It can be seen that the majority of the studies (81.6%) do not include intercoder reliability test in their data analysis. This is because qualitative researchers can adopt various strategies, other than doing intercoder reliability tests, in order to enhance reliability. It is noticeable that both case studies (8.7%) and mixed-method studies (5.8%) each have nine studies that have reported the intercoder reliability tests.
Figure 3. Distribution of methodologies in studies with interview data (with or without intercoder test).
It is understandable that studies that adopt ethnography, narrative inquiry, grounded theory do not report intercoder reliability tests. As mentioned in section 2, ethnographic studies typically record the processes of change within a research site and ethnographers collect multiple data sources in order to offer a holistic picture of a particular phenomenon in a specific social context through triangulation (LeCompte and Goetz Citation1982). Due to its personalistic and variable nature, it is not possible to conduct intercoder reliability tests and the findings cannot be replicated exactly, regardless of the methods or designs that are employed. Only three ethnographic studies were identified in our literature research (Fu and Clarke Citation2019; Martin Citation2019; Wade‐Jaimes and Schwartz Citation2019). Fu and Clarke (Citation2019) investigated how physics teachers in a high school negotiated the relationships between individual and collective agencies in the context of the on-going curriculum reform in China. The study collected interviews, long-term observations, and teachers’ reflective journals and associated field notes and adopted a constant comparison method for analyzing the data in order to contribute new perspectives to the field of teacher agency. As mentioned, the constant comparison method originated from grounded theory. Three studies were found to use grounded theory to generate emergent theories (Lane et al. Citation2019; Overman et al. Citation2019; Pattison and Dierking Citation2019). Lane et al. (Citation2019) employed grounded theory in order to develop a mechanistic model for conceptualizing college teacher training influences teaching identity.
Similarly, studies that adopted phenomenography (Dare, Ring-Whalen, and Roehrig Citation2019) and narrative inquiry (King and Pringle Citation2019; Melville, Campbell, and Jones Citation2019; Sheth Citation2019) did not conduct intercoder reliability tests. These studies aimed to provide evidence of how the participants make sense of phenomena under investigation and simultaneously document the researcher’s sense making (Smith et al., 2013). Hence, this requires the researcher to move between emic and etic perspectives. Adopting an emic perspective allows the researcher to analyse the participants’ account of experience inductively. On the other hand, adopting an etic perspective requires the researcher to interpret it by applying psychological concepts or theories that the researcher finds useful in demonstrating the understanding of research problems. Reliability of the claims is checked by adopting an iterative procedure of analyzing the data multiple times through moving back and forth between emic and etic perspectives, rather than using multiple observers as in other approaches. For instance, King and Pringle (Citation2019) used narrative inquiry in order to understand the Black girls’ detailed accounts of their informal and formal STEM learning experiences. The authors drew on critical race theory to facilitate their understanding of the participants’ interpretations and perceptions of their experiences. However, the author failed to explain how they attempted to enhance reliability in their study. Likewise, Melville, Campbell, and Jones (Citation2019) adopted narrative inquiry in order to understand how a science department chair’s has adopted the values that he held toward the subject, and his perceptions towards science teaching and learning. The authors acknowledged that they have previously worked with the science chair for an extended period of time, and they were mindful that a great deal of interpretation of the data was required in order to fully understand the chair’s narratives and ensure that the analysis of the chair’s narratives was reliable. Such an explanation is useful for other researchers to evaluate the reliability of the qualitative findings.
RQ2(a). If the studies have carried out the intercoder reliability test, how do these studies use the terminology to name their test?
From , although many studies want to ensure the extent of agreement between two coders applying same codes to idea units in the interview transcripts. Majority of these studies (74%) uses the term ‘interrater reliability’ to describe their reliability tests. Stokhof et al. (Citation2019, 355) state that ‘To ensure interrater reliability, a sample of approximately 20% of video recordings was independently coded by two researchers. An intercoder agreement of κ = 0.90 for the sample was established’. The authors characterized the fidelity of structure and process in a principle-based scenario. Though they are not rating the fidelity of structure and process, they use the term ‘interrater reliability’. The use of ‘interrater reliability’ might confuse readers as it might imply that the authors would like to use a scoring rubric or protocol to rate the participants.
Table 3. The use of terminologies by the studies in science education.
RQ2(b). If the studies have carried out the intercoder reliability test, how do these studies carry out the intercoder reliability test?
As shown in ), studies use a various amount of interview data to carry out intercoder reliability tests. Thirty-seven percent of the studies use 25% of lower of the interview data; 21% of the studies use 25–50% of the interview data; 10% of the studies use all interview data; 32% of the studies do not state the amount of interview data that they used for carrying out the intercoder reliability test. An example is the study from Lee, Gail Jones, and Chesnutt (Citation2019), which states that ‘A second coder reviewed established themes of the interview transcripts to check for agreement and to establish inter-rater reliability. Coder and researcher inter-rater reliability for data coding was at 96% agreement’ (p. 151). It is unclear that the number of interview transcripts that the second coders use to establish intercoder reliability. Using a higher percentage of intercoder data is apparently more convincing than using a small amount of interview data. But this has to be balanced by the limited human resources within a research team.
Figure 4. Pie charts showing (a) percentage of intercoder data; (B) identity of other coders; (C) description of how disagreements are resolved.
) describes the identity of the other coders. This diagram does not express the results in percentage because one of the studies involve coders of different identities. The other coders of 1 study are research assistants; the other coders of 8 studies are researchers; the other coders of 4 studies are co-authors; the other coder of 1 study is an in-service experienced teacher; the identities of other coders of 6 studies are unknown. 31.6% of these studies did not state the expertise of the other rater. With different prior experience and fields of expertise, it has a higher possibility that different raters have different interpretations towards the same dataset. For example, Spektor-Levy and Yifrach (Citation2019, 749) state that ‘in order to validate the analysis, two referees – a science-teaching academic expert who studies inclusion in the science classroom and an experienced science teacher – simultaneously judged the analysis of two interviews. The level of agreement between the four analyses was examined, and compatibility was found for 95% of the statements’. It does not help readers interpret the reliability of the study because not much information was given in terms of how two raters with different expertise contribute to the validation.
After calculating the intercoder reliability, it is important to describe thoroughly how the disagreements can be resolved. As shown in ), 53% of the studies did not describe how the disagreements were resolved. 42% of the interview studies mentioned that disagreements were resolved but there was no description of how these disagreements were resolved. Only 1 study described how the disagreements could be resolved. It shows that the authors used statistics as a post-hoc test instead of a tool to inform when and how the coding procedures could be refined.
RQ2(c). If the studies have carried out the intercoder reliability test, how do these studies report the results of the intercoder reliability test?
According to , 6 studies reported Cohen’s kappa; 11 studies reported percentage agreement; 1 study reported both percentage agreement and Cohen’s kappa together; 1 study reported Kappa. Only a few of them explained the rationales behind their use of statistics. For example, Lally and Forbes (Citation2019) stated that ‘each round of coding included a review of discrepancies between coders and continued until percent agreement reached .86; Cohen’s Kappa was calculated after the final round of coding (k = 0.59)’ (p. 2010). They did not explain the rationales for reporting both Cohen’s Kappa and percent agreement.
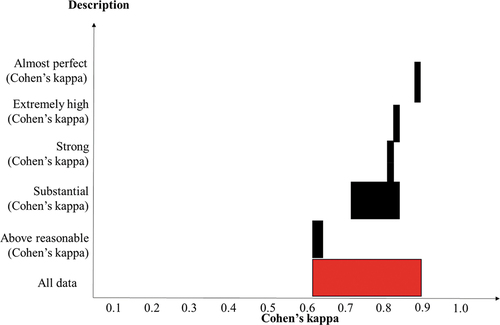
Eleven studies did not offer qualitative interpretations of their reliability statistics. For example, of the 11 studies that reported percentage agreement, only 2 of them offered a qualitative interpretation. The percentage agreement ranges from 80% to 100%. Borgerding and Kaya (Citation2019) stated that 82.6% agreement is considered as ‘good’; Fragkiadaki, Fleer, and Ravanis (Citation2019) stated that 90% of percentage agreement ‘constituted criterion for enhancement of reliability’. An interesting finding (see ) is that researchers had various qualitative interpretations towards similar values of Cohen’s kappa. For example, 0.71 and 0.84 were considered as ‘substantial’; 0.83 was considered as ‘strong’; 0.84 again was considered as ‘extremely high agreement’; 0.892 was considered as ‘almost perfect’. 0.84 was considered as ‘substantial’ in one study (Tsybulsky Citation2019) but was considered as ‘extremely high agreement’ in another study (Phillips et al. Citation2019). In a well-cited article by Landis and Koch (Citation1977), ‘0.81–1.00’ should be considered as ‘almost perfect’ and ‘0.61–0.80’ as ‘substantial’.
Figure 5. Diagrams showing the description of intercoder reliability statistics in terms of Cohen’s kappa.
8. Discussion and implication
This study has surveyed interview studies in science education, which have or have not reported intercoder reliability over a single year. In this section, we discuss the issues and considerations that emerged from the findings.
8.1 Intercoder reliability and interrater reliability
As presented in Section 2, intercoder reliability measures the extent to which two or more coders make similar decisions on coding texts (MacPhail et al. Citation2016). This is different from interrater reliability, a measure that measures the extent to which two researchers assign values that are already well defined (Gwet Citation2014). The studies reviewed in this article mostly use interview as a data collection tool to find out the participants’ knowledge, experiences, or conceptions in depth. Though the literature has illusive definitions on two constructs, there is a need for authors of studies to make themselves clear why they use interrater reliability or intercoder reliability. Are we seeking for reproducibility or comprehensibility of the analysis?
8.2 Methodology and intercoder reliability
Depending on the aims of methodology, incorporation of intercoder reliability may not be useful in establishing reliability. Our study shows that most studies using ethnography, phenomenology, narrative inquiry and grounded theory do not incorporate intercoder reliability statistics. These studies do not require a consistent estimate of the same phenomenon (LeCompte and Goetz Citation1982). Intercoder reliability does not assert reproducibility and reliability on studies that use ethnography. Before deciding the use of intercoder reliability statistics, researchers should consider the aims of the study and the methodology. If the methodology does not require a consistent list of categories on the same phenomenon, it may not be useful to report intercoder reliability. Constant comparison method or collecting multiple data sources for triangulation can be a way to establish the reliability.
8.3 Conducting intercoder reliability test
Researchers should consider carefully (1) the amount of intercoder data, (2) the identity and expertise of the intercoder and (3) the type of intercoder reliability statistics. The results of this study show that there is a wide variety of the amount of intercoder data, the identity of intercoder and the chosen type of intercoder reliability statistic. These studies did not provide explanations of the decisions that they made. As shown in , 6 out of 19 studies did not state the expertise of the intercoder; 31.5% of the study did not report the amount of intercoder data; 32% of the studies did not provide an example of how disagreements on coding were resolved. Moreover, reveals that the type of interview, the coding methods and their interpretations on their own intercoder reliability statistic were not explicitly written in some studies. This information helps readers assess the trustworthiness of the conclusion of the studies.
We propose two major principles in describing the intercoder reliability test: explanatory and transparency. Explanatory refers to how well authors explain their rationales of carrying out intercoder reliability tests; transparency refers to how detailed authors describe the ways of conducting the test. For example, there is a need for authors to explain why they use percentage agreement instead of Cohen’s kappa, or vice versa. Cohen’s kappa takes agreement by chance into account, but it can only be applied to categorial nominal variables and a fixed number of idea units. Authors should address these limitations of these statistic methods.
8.4 Report intercoder reliability test
According to , 16 science education studies provided a single numerical value to reflect the results of the intercoder reliability test. Although many studies have multiple codes, they sum up the intercoder reliability as an average number instead of providing the calculation of reliability of each individual code. If the purpose of conducting the test is to improve the coding scheme, the reliability level of individual codes should also be reported (O’Connor and Joffe Citation2020). This provides more details for readers to judge whether the coding scheme is valid.
For researchers who are making choices on intercoder reliability statistics, they commonly use percentage agreement or Cohen’s kappa to represent the consensus agreement when two coders interpret the same interview dataset. According to the literature, percentage agreement over 70% (Hallgren (Citation2012) and Cohen’s kappa over 0.61 (Landis and Koch Citation1977) indicate that there is a substantial agreement between the two coders. If their rating is lower than these indicators, it is not the end of the world. Qualitative research aims to give an in-depth description of the phenomenon instead of generalizing the finding to the whole population. Researchers can elaborate on how and why the codes are disagreed by two coders. These instances can be reported, and this will increase the rigour of qualitative interview research. A less ideal practice will be identified when the researchers ‘claim’ that disagreements are resolved. But they do not describe how these disagreements are resolved. They can consult the relevant literature to clarify the definition of categories (if the categories are generated from the literature) or revisit the interview data.
9. Implications, limitations and conclusion
In this study, we aim to illustrate some examples of using and reporting the intercoder reliability test which can be further improved. We suggest that there should be careful considerations on (1) differences between interrater and intercoder reliability, (2) when to use the intercoder reliability test, (3) how to carry out the intercoder reliability test and (4) how to report the results of the intercoder reliability test. The findings can provide some suggestions for other researchers in the field of science education.
Our motivation for carrying out this review is inspired by Taber (Citation2018) who revealed the report of Cronbach’s alpha statistics in science education studies. This research study contributes to this line of research of reporting reliability statistics in interview studies in science education. Interviews have a different nature from other data collection tools such as questionnaires. Unlike questions in open-ended questionnaires, interviews do not have a fixed number of units of analysis, which makes the use of intercoder reliability become more debatable. As a result, this study highlights the issues we observed in analysing interview data, instead of other types of data.
One of the major limitations of this study is that we only review how science education studies reported intercoder reliability in 2019. The findings of this study might not reflect the trend of other years of science education studies. However, this review aims to describe some preliminary patterns in using and reporting intercoder reliability in the well-regarded journals. We hope that this study encourages future research efforts on reviewing the report of reliability statistics in science education studies or some specific areas (i.e. students’ learning progression) in science education. Therefore, this study forms a basis of discussion of when and how we should report intercoder reliability in analysing interview data in different areas of research in science education.
This article presents our own perspectives and suggestions on conducting and reporting intercoder reliability test by reviewing science education studies in four top journals in 2019. By no means it reflects a definite way of reporting intercoder reliability in science education research.
Disclosure statement
No potential conflict of interest was reported by the author(s).
References
- *Borgerding, L. A., and F. Kaya. 2019. “Preschool Children’s Ideas about Biological Adaptation during a Science Camp.” International Journal of Science Education 41 (17): 2410–2429. doi:10.1080/09500693.2019.1683911.
- Braun, V., and V. Clarke. 2013. Successful Qualitative Research. London: Sage.
- Brock, R., and K. S. Taber. 2017. “The application of the microgenetic method to studies of learning in science education: characteristics of published studies, methodological issues and recommendations for future research”. Studies in Science Education 53 (1): 45–73.
- Campbell, J. L., C. Quincy, J. Osserman, and O. K. Pedersen. 2013. “Coding In-depth Semistructured Interviews: Problems of Unitization and Intercoder Reliability and Agreement.” Sociological Methods & Research 42 (3): 294–320. doi:10.1177/0049124113500475.
- Chang, Y.-H., C.-Y. Chang, and Y.-H. Tseng. 2009. “Trends of Science Education Research: An Automatic Content Analysis.” Journal of Science Education and Technology 19 (4): 315–331. doi:10.1007/s10956-009-9202-2.
- Cheung, K. K. C., and M. Winterbottom. 2021. “Students’ Integration of Textbook Representations into Their Understanding of Photomicrographs: Epistemic Network Analysis.” Research in Science & Technological Education 1–20. doi:10.1080/02635143.2021.1920382.
- *Corpuz, E. D. G., and N. S. Rebello. 2019. “Refining Students’ Explanations of an Unfamiliar Physical Phenomenon-Microscopic Friction.” Research in Science Education 49 (5): 1177–1211. doi:10.1007/s11165-017-9650-2.
- *Dare, Emily A., Elizabeth A. Ring-Whalen, and Gillian H. Roehrig. 2019. “Creating a Continuum of STEM Models: Exploring How K-12 Science Teachers Conceptualize STEM Education.” International Journal of Science Education 41 (12): 1701–1720. doi:10.1080/09500693.2019.1638531.
- Feng, G. C. 2014. “Intercoder Reliability Indices: Disuse, Misuse, and Abuse.” Quality & Quantity 48 (3): 1803–1815. doi:10.1007/s11135-013-9956-8.
- Feng, G. C. 2015. “Mistakes and How to Avoid Mistakes in Using Intercoder Reliability Indices.” Methodology 11 (1): 13–22. doi:10.1027/1614-2241/a000086.
- *Fragkiadaki, G., M. Fleer, and K. Ravanis. 2019. “A Cultural-Historical Study of the Development of Children’s Scientific Thinking about Clouds in Everyday Life.” Research in Science Education 49 (6): 1523–1545. doi:10.1007/s11165-017-9665-8.
- *Fu, G., and A. Clarke. 2019. “Individual and Collective Agencies in China’s Curriculum Reform: A Case of Physics Teachers.” Journal of Research in Science Teaching 56 (1): 45–63. doi:10.1002/tea.21467.
- Glaser, B., and A. Strauss. 1967. The Discovery of Grounded Theory. London: Weidenfield & Nicolson.
- Gwet, K. L. 2014. Handbook of Inter-rater Reliability: The Definitive Guide to Measuring the Extent of Agreement among Raters. Advanced Analytics, LLC.
- Hallgren, K. A. 2012. “Computing Inter-rater Reliability for Observational Data: An Overview and Tutorial.” Tutorials in Quantitative Methods for Psychology 8 (1): 23. doi:10.20982/tqmp.08.1.p023.
- Hammer, D., and L. K. Berland. 2014. “Confusing Claims for Data: A Critique of Common Practices for Presenting Qualitative Research on Learning.” Journal of the Learning Sciences 23 (1): 37–46. doi:10.1080/10508406.2013.802652.
- Hammersley, M., and P. Atkinson. 2007. Ethnography: Principles in Practice. London: Routledge.
- *Hecht, M., K. Knutson, and K. Crowley. 2019. “Becoming a Naturalist: Interest Development across the Learning Ecology.” Science Education 103 (3): 691–713. doi:10.1002/sce.21503.
- Jansen, S., M.-C. P. J. Knippels, and W. R. Van Joolingen. 2019. “Assessing Students’ Understanding of Models of Biological Processes: A Revised Framework.” International Journal of Science Education 41 (8): 981–994. doi:10.1080/09500693.2019.1582821.
- Khishfe, R. 2019. “The Transfer of Nature of Science Understandings: A Question of Similarity and Familiarity of Contexts.” International Journal of Science Education 41 (9): 1159–1180. doi:10.1080/09500693.2019.1596329.
- Kier, M. W., and J. A. Chen. 2019. “Kindling the Fire: Fueling Preservice Science Teachers‘ Interest to Teach in High-needs Schools.” Science Education 103 (4): 875–899. doi:10.1002/sce.21520.
- King, N. S., and R. M. Pringle. 2019. “Black Girls Speak STEM: Counterstories of Informal and Formal Learning Experiences.” Journal of Research in Science Teaching 56 (5): 539–569. doi:10.1002/tea.21513.
- Krell, M., C. Walzer, S. Hergert, and D. Krüger. 2019. “Development and Application of a Category System to Describe Pre-Service Science Teachers’ Activities in the Process of Scientific Modelling.” Research in Science Education 49 (5): 1319–1345. doi:10.1007/s11165-017-9657-8.
- Kurasaki, K. S. 2000. “Intercoder Reliability for Validating Conclusions Drawn from Open-ended Interview Data.” Field Methods 12: 179–194. doi:10.1177/1525822X0001200301.
- Lally, D., and C. Forbes. 2019. “Modelling Water Systems in an Introductory Undergraduate Course: Students’ Use and Evaluation of Data-driven, Computer-based Models.” International Journal of Science Education 41 (14): 1999–2023. doi:10.1080/09500693.2019.1657252.
- Landis, J. R., and G. G. Koch. 1977. “The Measurement of Observer Agreement for Categorical Data.” Biometrics 33 (1): 159–174. doi:10.2307/2529310.
- Lane, A. K., C. Hardison, A. Simon, and T. C. Andrews. 2019. “A Model of the Factors Influencing Teaching Identity among Life Sciences Doctoral Students.” Journal of Research in Science Teaching 56 (2): 141–162. doi:10.1002/tea.21473.
- Lavi, R., and Y. J. Dori. 2019. “Systems Thinking of Pre- and In-service Science and Engineering Teachers.” International Journal of Science Education 41 (2): 248–279. doi:10.1080/09500693.2018.1548788.
- LeCompte, M. D., and J. P. Goetz. 1982. “Problems of Reliability and Validity in Ethnographic Research.” Review of Educational Research 52 (1): 31–60. doi:10.3102/00346543052001031.
- *Lee, T. D., M. Gail Jones, and K. Chesnutt. 2019. “Teaching Systems Thinking in the Context of the Water Cycle.” Research in Science Education 49 (1): 137–172. doi:10.1007/s11165-017-9613-7.
- *Liu, S., and G. Roehrig. 2019. “Exploring Science Teachers’ Argumentation and Personal Epistemology about Global Climate Change.” Research in Science Education 49 (1): 173–189. doi:10.1007/s11165-017-9617-3.
- MacPhail, C., N. Khoza, L. Abler, and M. Ranganathan. 2016. “Process Guidelines for Establishing Intercoder Reliability in Qualitative Studies.” Qualitative Research 16 (2): 198–212. doi:10.1177/1468794115577012.
- Marques, J. F., and C. McCall. 2005. “The Application of Interrater Reliability as a Solidification Instrument in a Phenomenological Study.” The Qualitative Report 10 (3): 439–462.
- *Martin, J. 2019. “Researching Primary Teachers’ Professional Agency: Employing Interactive Ethnography to Overcome Reluctance to Teach Science.” Research in Science Education 49 (5): 1279–1299. doi:10.1007/s11165-017-9654-y.
- *Mathayas, N., D. E. Brown, R. C. Wallon, and R. Lindgren. 2019. “Representational Gesturing as an Epistemic Tool for the Development of Mechanistic Explanatory Models.” Science Education 103 (4): 1047–1079. doi:10.1002/sce.21516.
- *Melville, W., T. Campbell, and D. Jones. 2019. “Axiology, the Subject and the Chair.” Research in Science Education 49 (3): 679–696. doi:10.1007/s11165-017-9646-y.
- Morse, J. M., M. Barrett, M. Mayan, K. Olson, and J. Spiers. 2002. “Verification Strategies for Establishing Reliability and Validity in Qualitative Research.” International Journal of Qualitative Methods 1 (2): 1–19. doi:10.1177/160940690200100202.
- O’Connor, C., and H. Joffe. 2020. “Intercoder Reliability in Qualitative Research: Debates and Practical Guidelines.” International Journal of Qualitative Methods 19: 1–13. doi:10.1177/1609406919899220.
- *Overman, M., J. D. Vermunt, P. C. Meijer, and M. Brekelmans. 2019. “Teacher–student Negotiations during Context‐based Chemistry Reform: A Case Study.” Journal of Research in Science Teaching 56 (6): 797–820. doi:10.1002/tea.21528.
- *Pattison, S. A., and L. D. Dierking. 2019. “Early Childhood Science Interest Development: Variation in Interest Patterns and Parent–child Interactions among Low‐income Families.” Science Education 103 (2): 362–388. doi:10.1002/sce.21486.
- *Phillips, T. B., H. L. Ballard, B. V. Lewenstein, and R. Bonney. 2019. “Engagement in Science through Citizen Science: Moving beyond Data Collection.” Science Education 103 (3): 665–690. doi:10.1002/sce.21501.
- Richards, K. 2003. Qualitative Research in TESOL. New York: Palgrave Macmillan.
- Ryan, G. W. 1999. “Measuring the Typicality of Text: Using Multiple Coders for More than Just Reliability and Validity Checks.” Human Organization 58: 312–322. doi:10.17730/humo.58.3.g224147522545rln.
- *Schizas, D., E. Papatheodorou, and G. Stamou. 2019. “Unravelling the Holistic Nature of Ecosystems: Biology Teachers’ Conceptions of Ecosystem Balance and Self-regulation.” International Journal of Science Education 41 (18): 2626–2646. doi:10.1080/09500693.2019.1690179.
- *Sheth, M. J. 2019. “Grappling with Racism as Foundational Practice of Science Teaching.” Science Education 103 (1): 37–60. doi:10.1002/sce.21450.
- *Spektor-Levy, O., and M. Yifrach. 2019. “If Science Teachers Are Positively Inclined Toward Inclusive Education, Why Is It So Difficult?” Research in Science Education 49 (3): 737–766. doi:10.1007/s11165-017-9636-0.
- Spradley, J. P. 1979. The Ethnographic Interview. New York: Holt: Rinehart and Winston.
- *Stokhof, H., B. De Vries, T. Bastiaens, and R. Martens. 2019. “Mind Map Our Way into Effective Student Questioning: A Principle-Based Scenario.” Research in Science Education 49 (2): 347–369. doi:10.1007/s11165-017-9625-3.
- Sun, S. 2011. “Meta-analysis of Cohen’s Kappa.” Health Services & Outcomes Research Methodology 11 (3–4): 145–163. doi:10.1007/s10742-011-0077-3.
- Taber, K. S. 2013. Classroom-based Research and Evidence-based Practice: An Introduction. London: Sage.
- Taber, K. S. 2018. “The Use of Cronbach’s Alpha When Developing and Reporting Research Instruments in Science Education.” Research in Science Education 48 (6): 1273–1296. doi:10.1007/s11165-016-9602-2.
- Tai, K. W. H. Forthcoming. “Translanguaging as Inclusive Pedagogical Practices in English Medium Instruction Science and Mathematics Classrooms for Linguistically and Culturally Diverse Students.” Research in Science Education. doi: 10.1007/s11165-021-10018-6
- Tinsley, H. E., & D. J. Weisss. 2000. “Interrater reliability and agreement”. In Handbook of applied multivariate statistics and mathematical modeling (pp. 95–124). Academic Press.
- *Tsybulsky, D. 2019. “Students Meet Authentic Science: The Valence and Foci of Experiences Reported by High-school Biology Students regarding Their Participation in a Science Outreach Programme.” International Journal of Science Education 41 (5): 567–585. doi:10.1080/09500693.2019.1570380.
- *Vo, T., C. Forbes, L. Zangori, and C. V. Schwarz. 2019. “Longitudinal Investigation of Primary Inservice Teachers’ Modelling the Hydrological Phenomena.” International Journal of Science Education 41 (18): 2788–2807. doi:10.1080/09500693.2019.1698786.
- *Wade‐Jaimes, K., and R. Schwartz. 2019. ““I Don’t Think It’s Science:” African American Girls and the Figured World of School Science.” Journal of Research in Science Teaching 56 (6): 679–706. doi:10.1002/tea.21521.
- *Zohar, A. R., and S. T. Levy. 2019. “Students’ Reasoning about Chemical Bonding: The Lacuna of Repulsion.” Journal of Research in Science Teaching 56 (7): 881–904. doi:10.1002/tea.21532.