
ABSTRACT
The aim of this study was to advance current movement analysis methodology to enable a technique analysis in sports facilitating (1) concurrent comparison of the techniques between several athletes; (2) identification of potentially beneficial technique modifications and (3) a visual representation of the findings for feedback to the athletes. Six elite cross-country skiers, three world cup winners and three national elite, roller ski skated using the V2 technique on a treadmill while their movement patterns were recorded using 41 reflective markers. A principal component analysis performed on the marker positions resulted in multi-segmental “principal” movement components (PMs). A novel normalisation facilitated comparability of the PMs between athletes. Additionally, centre of mass (COM) trajectories were modelled. We found correlations between the athletes’ performance levels (judged from race points) and specific features in the PMs and in the COM trajectories. Plausible links between COM trajectories and PMs were observed, suggesting that better performing skiers exhibited a different, possibly more efficient use of their body mass for propulsion. The analysis presented in the current study revealed specific technique features that appeared to relate to the skiers’ performance levels. How changing these features would affect an individual athlete’s technique was visualised with animated stick figures.
Introduction
In many sports, technique is considered as one of the key factors for competitive success and one of the main characteristics marking the best athletes (Lees, Citation2002). Technique in this context denotes the individual, multi-segmental motion pattern employed by individual athletes in standard situations of their sport. The individual technique of an athlete emerges as a specific coordinative pattern after extensive practice.
Researchers investigating individual athletes’ techniques typically face several challenges. A first challenge is to quantify technique in such a way that an objective comparison between the techniques of athletes is possible. Furthermore, in most sports technique is a whole-body coordinative pattern, hence, thorough technique analysis requires recording, analysing and interpreting large sets of variables. Focusing on few key variables may represent a risk of bias (Lees, Citation2002; Pataky, Robinson, Vanrenterghem, Citation2013). Another challenge is to determine what change in technique may be beneficial for a specific athlete. Biomechanical considerations and models may help in this context (Lees, Citation2002), but usually these models lack athlete specificity and often a technique’s complex multi-segment interaction patterns are not thoroughly understood and therefore difficult to model appropriately. If potentially beneficial technique modifications have been identified, an additional challenge is the communication of this modification to the athlete (Federolf, Reid, Gilgien, Haugen, & Smith, Citation2014). Lack of clarity in how the athlete should modify her or his technique and how this can be accomplished can pose a considerable strain on the coach–athlete relationship (Purdy & Jones, Citation2011).
Principal component analysis (PCA) has emerged in the last decades as a method to study whole-body movement patterns (Daffertshofer, Lamoth, Meijer, & Beek, Citation2004; Federolf, Boyer, & Andriacchi, Citation2013; Troje, Citation2002). PCA is a method to identify correlated changes in high-dimensional data sets. It is therefore particularly well suited for analysing the correlated patterns of segment movements that constitute “technique” in sports (Witte, Ganter, Baumgart, & Peham, Citation2010). PCA has already been applied for technique analysis in dance (Bronner & Shippen, Citation2015), diving (Young & Reinkensmeyer, Citation2014), gymnastics (G. K. Williams et al., Citation2016), juggling (Huys, Daffertshofer, & Beek, Citation2004), walking and running (Dona, Preatoni, Cobelli, Rodano, & Harrison, Citation2009; Lamoth, Daffertshofer, Huys, & Beek, Citation2009), skiing (Federolf et al., Citation2014), soccer (Diaz, Fajen, & Phillips, Citation2012) and tennis (Huys, Smeeton, Hodges, Beek, & Wiliams, Citation2008; Smeeton & Huys, Citation2011). However, an important limitation in many of the previous analyses is that separate PCAs were calculated for each individual participant. The current manuscript describes a novel data normalisation approach particularly suited for concatenating data from all participants, thus facilitating a direct comparison of the postural movement components between athletes.
The current study introduces a PCA-based method for technique analysis of athletes. It was developed with three objectives: (1) it should include a normalisation that facilitates direct comparison of techniques between members of a group of athletes; (2) it should outline how potentially beneficial changes to an individual’s technique might be identified and (3) it should include a visual representation of the athletes’ techniques and of potentially beneficial modifications to facilitate communication between scientists, athletes and coaches. In the current study, the V2 skating technique in cross-country skiing was analysed. The V2 technique was selected since it is the main skating technique (Andersson et al., Citation2010) and is used particularly at terrains found to affect sprint trial performance (Sandbakk, Ettema, Leirdal, Jakobsen, & Holmberg, Citation2011). Furthermore, it is a complex whole-body movement, where focusing on selected technique variables may represent a comparatively high risk of bias.
Materials and methods
Participants
Six elite cross-country skiers (male, age 26 ± 2 years, height 181 ± 5 cm, weight 79.5 ± 5 kg) volunteered in this study. The study was approved by the Regional Ethics Committee, and all athletes gave their written informed consent prior to participating. Three of the participants were members of the Norwegian National Team and had multiple World Cup podium finishes. The other three skiers were also top-level athletes (finished in the top 30 in the Norwegian National Championships), but were not members of the National Team.
An objective performance measure of world-class cross-country skiers is the athletes’ “FIS points” (FIS is short for Fédération Internationale de Ski, the International Ski Federation), which are calculated after each FIS race and represent a linear scale of each athlete’s time difference to the winner’s finishing time. In the current study, the average FIS points from all sprint skate competitions in which the volunteer had participated during the previous season (2012–2013) were calculated as a measure of his performance level. The participants’ FIS points at the time of this study were [24, 38, 39, 73, 101, 112] (rounded to the nearest integer).
Experimental protocol
The measurements for the current study were collected during a lactate profile test on a roller skiing treadmill, described in detail by Losnegard, Myklebust, Spencer, and Hallén (Citation2013). All participants were familiar with treadmill testing and the protocols. The kinematic measurements presented in this study were collected with an inclination of 4° and a speed of 3.0 m · s−1. From each athlete, 12 consecutive stride cycles were selected for analysis.
Instrumentation
The testing took place on a m treadmill (Rodby, Södertalje, Sweden). All skiers used the same Swenor Skate roller skis with friction coefficient of μ = 0.016 (Sport Import AS, Sarpsborg, Norway). The athletes were allowed to use their own ski poles, modified with a tip specially adapted for use on a roller skiing treadmill.
The athletes’ movements were recorded at a frame rate of 250 Hz using a 3D motion analysis system consisting of nine cameras (Oqus 400, Qualisys AB, Gothenburg, Sweden) controlled by the Qualisys Track Manager software (Qualisys AB, Gothenburg, Sweden). Forty-one retro reflective markers were attached to the athletes’ skin and skiing equipment (). Specifically, markers were placed on the tibialis anterior, knee joint axis (laterally), rectus femoris, trochanter major, anterior superior iliac spine, os sacrum, sternum, 10th thoracal vertebra, 12th rib, 7th cervical vertebra, acromion, biceps brachii, elbow joint (laterally), mid forearm and on the distal end of the radius. The athletes wore a custom-built hat with five markers. One marker was attached to the lateral side of each ski boot near the ankle. Additional markers were placed close to the distal tip on the poles and three markers were attached to each ski: posterior, anterior and 10 cm superior to the ski (Hoset, Rognstad, Rølvåg, Ettema, & Sandbakk, Citation2014; Myklebust, Gløersen, & Hallén, Citation2015). If marker trajectories exhibited gaps, then they were filled by interpolation (short gaps) or by a PCA-based reconstruction algorithm (Federolf, Citation2013; Gløersen & Federolf, Citation2016).
Figure 1. Data collection on the treadmill. Markers placed medially on the ankle, knee and elbow were removed for the actual trials, and the sternum and upper pole markers were excluded in the analysis due to frequent data gaps or marker detachments.
The centre of mass (COM) of the athletes (including equipment) was estimated from a 19-segment model using the software Visual3D (C-Motion, Inc., Germantown, MD, USA). All other data analyses were done using Matlab (The MathWorks, Natick, MA, USA). The coordinates of the 41 markers were expressed in a reference system originating in the skier’s centre of mass position.
Data analysis: identification of movement components of interest
The data analysis procedure comprised four main steps: First, the kinematic data collected for each participant were normalised and scaled such that the movement patterns of all participants could be pooled and submitted to one comprehensive analysis. Second, a PCA was used to decompose the complex whole-body motion patterns of skating into one-dimensional, correlated movement components (“principal movements” (PM)). Third, the overall waveform characteristics were compared and specific features were identified in the COM movement and in the postural movements that appeared to change systematically with the athletes’ performance level. Fourth, a statistical analysis was conducted to assess the differences identified in Step three. The following paragraphs describe these steps in detail.
All equations used in the current paper adhere to the following notation: bold font and capital letters (e.g., M) represent matrices; bold font and lower case letters (p) represent vectors; overlines () denote the time mean; a hat (
) the mean over all stride cycles; and superscript T indicates the transposed matrix or vector. Measurement variability was quantified by the unbiased sample standard deviation (SD) and reported as ± SD.
Normalisation and scaling
Twelve consecutive stride cycles, from the right pole’s pole plant to the succeeding pole plant standing on the right ski, were selected for each athlete. The pole plants were identified as peak acceleration of the pole marker. Each stride cycle was resampled to 401 data points, giving a total of n = 4812 samples per athlete. For each time point ti, i ϵ [1, n] the coordinates of the 41 markers defined a m = 123 (i.e., ) dimensional posture vector p(ti). Each trial of a participant N defined an n × m matrix MN, where the columns corresponded to the marker coordinates, and the rows corresponded to the time frames.
A mean posture vector () was calculated as
and subtracted from each row of the posture matrix MN, giving a new matrix . To account for anthropometric differences, the scaling method proposed by Federolf, Roos, and Nigg (Citation2013) was applied: the Euclidean norm
of all rows (i.e., posture vectors) was calculated and
was divided by the averaged
. Additionally, each row of
was multiplied with a 123-dimensional weight vector w representing the relative mass (Dempster & Gaughran, Citation1967) of the body segment to which the marker was attached (Federolf, Citation2016). If more than one marker was attached to a given segment, then the mass of the segment was divided equally over the corresponding markers. These two scaling procedures resulted in matrices
for each participant N [N = 1…6], which could now be pooled into a 28,872 × 123 pooled matrix Mpooled, structured in the following way:
PCA and PMs
A PCA conducted on Mpooled resulted in (i) a 123 × 123-dimensional matrix PC = [pc1, pc2, …, pcm] containing new basis vectors (called principal component vectors), where the variance (i.e., amount of postural movements) contained in each pck is strictly decreasing with increasing k; (ii) a 123-dimensional eigenvalue vector λ = [λk] consisting of the normalised variances contained in the corresponding pck vector and (iii) the time evolution coefficients obtained as projection of the normalised posture vectors onto the principal component vectors. The complete posture of any time frame ti could then be expressed as the sum of the mean posture
and a linear combination of the pc vectors:
The time evolution coefficients
characterised changes in an athlete’s posture, that is, his postural movements. Each of these time series could individually be projected back onto the original coordinate system using the following relation:
where pm stands for “principal movement”. The pm represented multi-segment movement patterns, that is, components of the athletes’ technique. They could be characterised qualitatively as movements of an animated stick figure and analysed quantitatively through their time evolution coefficients. The corresponding eigenvalues λkquantified the relative contribution of the pm to the total variance of the postural movements. Systematic differences in the athletes’ techniques were then determined as differences in the time evolution coefficients as a whole or at specific time points.
Feature extraction
Line density plots of the time evolution coefficients were generated using all 72 stride cycles (6 athletes × 12 cycles) analysed in this study. The individual lines were colour coded according to the FIS points of the athletes. Thus, the line density plots accounted for the intra-subject variability in carrying out the skating steps and visualised inter-subject differences as a change in colour. The line density plots were created by mapping all cycles into one 401 × 400 × 3 RGB(red-green-blue) colour matrix and low-pass filtering the columns using a two-way finite impulse response (FIR)-filter with coefficients decreasing linearly to zero. Similar line density plots were created for the three components (in an external reference frame) of the COM movement to assess if characteristic differences in the overall motion patterns of the participants existed.
Three types of features were evaluated. Differences in amplitude, denoted with an , were measured as peak to peak (p2p) amplitude. If the signal contained higher harmonics than the cycle frequency, then the p2p amplitude was calculated for each sub cycle and averaged (feature αpc3). Differences in timing, denoted with a τ, where calculated using an unbiased cross correlation of each time evolution coefficient series with the time evolution coefficient series averaged over all athletes. Two features, φpc4 and φpc5,1/2, could not be described using whole-cycle variables. Feature φpc4 was calculated as the difference between ξ4(ti) in the interval
stride cycle and the corresponding symmetric score 50% later in the stride cycle (
. Features φpc5,1/2 were calculated as the p2p amplitudes between the pairs of peaks in ξ5.
If the identified features are relevant for the performance of the skiers, then one would expect that these features affect the COM motion. Therefore, the relationship between individual pm features and individual differences in the COM movement were investigated. Specifically, the relation between the time evolution coefficients and the vertical COM trajectory were assessed.
Statistics
The features of the movements that were deemed to indicate technique differences were examined for correlations with the FIS points of the athletes using Pearson’s correlation coefficient. All tests were conducted using the mean values over the 12 cycles of each participant. To test if covariates such as body height might have influenced the results, some correlations were recalculated with values normalised to the covariate. Ninety-five per cent confidence intervals (CIs) on the correlation coefficients and on group differences between the three best ranked and the three lowest ranked skiers were calculated (Hentschke & Stüttgen, Citation2011) to indicate the magnitude of the observed differences.
Visualisation of technique differences
Technique differences identified in the time evolution coefficients are difficult to interpret for researchers and are not useful for athletes or coaches unless they can be visualised and communicated. To create a visual impression of the technique differences we “transplanted” certain movement components from one skier to another. This allowed creating two overlying stick figures; one containing the original, individual movement of an athlete, and the other containing the same individual movement pattern except that one movement component had been exchanged with another skier’s movement component. Thus, it could be visualised how the individual technique of a specific skier would change if one PM component would be modified in a desired way. The mathematical foundation for this hybrid movement pattern was given by
Here, N1 represents the athlete whose movement is altered, and N2 represents the athlete whose movement component q was transplanted. The additional factor σ introduced in this equation allowed an artificial amplification of this movement component (for σ > 1) to better visualise differences in the movement pattern. In that case, was also multiplied with σ when reconstructing the original movement pattern. This method can be generalised to transplant more than just one movement component, to modify only specific time intervals, or to represent averaged patterns of a group rather than of an individual participant N.
Results
Skiing technique as characterised by PMs
The first five principal movements pmk, characterised by their time evolution coefficients and by stick figures representing associated changes in posture, are displayed in . Together they covered 96.1 ± 0.2% of the total postural variance. Principal movement pm1 captured a body lean in the lateral direction, and parts of the leg push in the sagittal plane; pm2 captured the hip flexion/extension movement, in addition to a pole push; pm3 showed an arm movement and pole swing corresponding to the poling action in the sagittal plane, and a symmetric hip ab-/adduction in the coronal plane; pm4 showed a movement of the legs in both the sagittal (asymmetric movement) and coronal plane (symmetric movement), in addition to a small lateral translation and axial rotation of the hip; pm5 represented an asymmetric leg movement that captured parts of the lifting of the legs and skis. The relative cycle-to-cycle variability increases with the order k of the PM.
Figure 2. Time evolution coefficients of the postural movements 1–5 (left column) and stick figures (right column) representing the posture at the indicated time points (1,2,3). Time evolution coefficients: black line represents the average stride of an example athlete, shaded area represents cycle-to-cycle SD. Vertical lines indicate pole take-offs (dashed) and pole plants (solid). Postures: Arrows indicate the velocity vector of each marker at that time point. Scaling of arrows differ between different pmk.
Assessment of between-skiers’ differences in COM movement
Two features of the COM movement ((a)–(c)) showed a relationship with the athletes’ FIS points: A time shift in the vertical COM movement (τcom3), and the amplitude of the lateral COM trajectory (αcom1). The time shift implied that the best ranked skiers showed a lower relative COM position at the time of the pole plant (r = 0.88, CI [0.29, 0.99]). The magnitude of the timing differences between the three best ranked skiers and the three lowest ranked skiers were 31 (CI [−2, 63]) ms. This corresponded to roughly 3% of the vertical COM displacement cycle time. The lateral movement of the COM indicated that the better ranked skiers used a smaller amplitude in the sideways movement (r = 0.92, CI [0.45, 0.99]), with the three best ranked skiers using 56 (CI [16, 98]) mm less amplitude than the three lowest ranked skiers. This amplitude difference was independent of the athletes’ body height.
Figure 3. Line density plots of COM (a–c) and postural (d–h) movements. Areas where all skiers used the same technique appear yellow, green areas represent the best skiers with lowest FIS points, red areas represent the skiers with higher FIS point. The annotations indicate features that were selected for further statistical evaluation: α indicates amplitude differences; τ indicates a difference in timing; φ represents features that are described in the text.
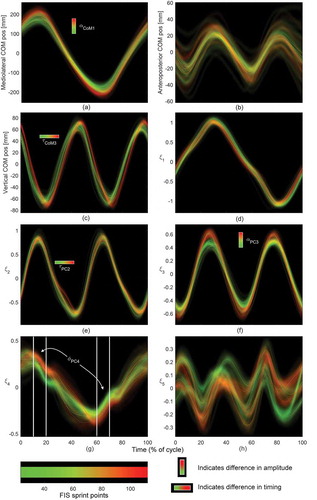
Assessment of differences between skiers’ techniques: PMs
Five features of the first five time evolution coefficients were identified as possible correlates with FIS-point ranking ((d)–(h)). Feature τpc2 suggested that the better ranking skiers flexed the hip (pm2) approximately 29 (CI [18, 40]) ms earlier compared to the lower ranking athletes (r = 0.85, CI [0.13, 0.98]). Feature φpc4 indicated that the lateral translation and axial rotation of the athletes’ hip (pm4) was executed differently between the higher and lower ranked athletes (r = −0.87, CI [−0.21, −0.99]). This led to a more medial positioning of the push ski, and a more lateral position of the glide ski during the time period of 10–20% and 60–70% of the stride cycle, that is, during a brief period in the last half of the pole push ( and , right panel). This time period corresponds approximately to the start of the leg push (Losnegard, Ehrhardt, & Hallén, Citationin press). The feature αpc3 indicated that the amplitude of the arm swing, among other factors, was somewhat smaller for the best ranked athletes; however, inferential statistics indicate that this is a non-significant finding (r = 0.74, CI [−0.10, 0.97]).
Figure 4. Hybrid movement pattern (Equation 5) from the average movement of the three lowest ranked skiers, where was replaced with the mean of the three best ranked skiers (black lines). Grey lines: Average movement of the three lowest ranked skiers (for comparison). The
-coefficients where amplified by a factor σ = 3 to emphasise the differences. It appeared that the difference in posture (here reconstructed at 15% of the stride cycle) consisted of a more medial position of the push ski, and a more lateral position of the glide ski.
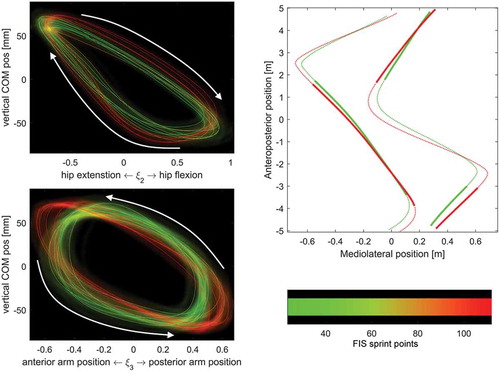
Figure 5. Top left panel: Vertical COM mass displacement showed a larger correlation with ξ2 (representing hip flexion) for better skiers. Bottom left panel indicates that the opposite was true for ξ3, which represented the sagittal arm swing and a symmetric hip ab-/adduction. Right panel: Ski trajectories of the three best ranked skiers (green lines) and the three lowest ranked skiers (red lines).
Relations between COM movement and PMs
Differences in the lateral COM amplitude, αcom1, showed a large (but non-significant) correlation (r = 0.71, CI [−0.23, 0.97]) with the pm4-feature φpc4, characterising lateral pelvis and leg motions and pelvis rotation. This suggests that a smaller lateral amplitude and axial rotation of the pelvis during the beginning of the leg push was correlated to (and probably responsible for – considering how COM is calculated) a smaller lateral COM amplitude.
Another systematic difference between the top and the lower-ranking athletes was apparent when plotting the vertical COM movement as a function of ξ2(ti) (, upper left panel) or ξ3(ti) (, lower left panel). These graphs suggest that hip flexion (pm2) was better synchronised in time with the vertical COM movement in the top athletes. The difference in the vertical COM versus pm3 graph suggests that there are differences in the production and utilisation of potential energy (vertical COM movement) through pole/arm movements and hip ab-/adduction.
Discussion
The current study presented an approach to evaluate the techniques of a group of elite athletes, to identify systematic differences in whole-body coordinative patterns (PMs) between the athletes, and to visualise these differences using animated stick figures (). This approach is based on an analysis of the within- and between-subject variability of the athlete’s actual movements. Thus, this approach differs conceptually from other approaches to technique analysis, such as modelling approaches that deduce recommendations for technique changes from biomechanical theory (Chow & Knudson, Citation2011; Lees, Citation2002). The current study describes a novel normalisation that, in our opinion, is particularly well suited when concatenating data from different athletes for a single PCA, thus facilitating a direct comparison of techniques within a whole group of athletes. Furthermore, the line density plots prepared in the current study offer a novel approach to simultaneously account for intra- and inter-subject variability. Finally, to the best of our knowledge, the current study is the first to formally introduce the hybrid movement patterns (), offering a visualisation of how an athlete’s individual technique might be altered based on results from the technique analysis in a whole group of athletes.
Our results suggested that two aspects in the athletes’ technique seemed to show a correlation to the athletes’ performance. However, correlation does not imply a causal relationship. Therefore, we will briefly discuss the biomechanical plausibility of whether the observed technique features may relate to the efficacy in propulsive energy production: The first aspect appeared as timing differences in pm2 and pm3, which captured a combination of hip flexion and aspects of the pole push and quantified the sagittal arm swing and a symmetric hip ab-/adduction, respectively. We speculate that the better ranked athletes utilised potential energy more effectively in the pole push (Losnegard et al., Citationin press; Myklebust, Losnegard, & Hallen, Citation2014), by coordinating their movements such that major muscle groups including hip flexors worked in phase with release of potential energy (COM movement; , left). These findings also agree with observations and interpretations established in double poling by Holmberg, Lindinger, Stöggl, Eitzlmair, and Müller (Citation2005). Second, an amplitude difference was observed in pm3, which captured a combination of sagittal-plane arm and pole movements and an ab-/adduction of the hips. The differences in the pm3, together with specific features in the pm4 motion are likely the cause for slightly more bent ski trajectories (, right), which enabled the best ranked skiers to better align their skis with the forward direction during the initial gliding phase, while showing a similar trajectory in the push-off phase. In the authors’ opinion, this is consistent with findings suggesting that better ranked skiers may have a lower cycle frequency at the same speed (Sandbakk, Ettema, Leirdal, & Holmberg, Citation2012).
Limitations
The choice of FIS points as a performance variable has both benefits and limitations. A more common choice in the literature is to use time trials (Losnegard et al., Citation2013) or maximum speed tests (Mikkola, Laaksonen, Holmberg, Vesterinen, & Nummela, Citation2010; Stoeggl & Müller, Citation2009; Stöggl, Müller, & Lindinger, Citation2008). Such performance variables are often highly specific for the given measurements. This can be considered an advantage compared to FIS points, which are also affected by factors not analysed in this study, for example, other sub-techniques in skating or physiological capacity. However, an athlete’s result in such performance tests is of limited interest for practitioners compared to their performance in a true competition situation. Using FIS points as a performance variable makes it possible to investigate direct correlations between variables’ characterising technique and competition performance.
The small sample size in this study limits generalisation of the observed technique features; however, the interpretations discussed previously suggest that the observed features might characterise a more effective skating technique. Another limitation is that PCA is a linear decomposition method. It is possible that other, particularly non-linear decomposition methods, might reveal other aspects that also differ in the skating techniques of these athletes.
The pmk are whole-body movement components; however, the qualitative description of the pmk in the results and the discussion of specific technique features focus on the largest, that is, in the visual representation most obvious characteristics. This focus may constitute a selection bias. Finally, all participants included in the current study were from the same country and region. It is therefore possible that their techniques had common features. Including international athletes in this analysis might reveal other relevant technique differences that did not appear in the current study.
Perspective
The current study presented an analysis method that allowed quantitatively analysing and comparing the techniques of elite athletes. The correlations with race performance suggested that some of the technique differences may be important for skiing performance, but they do not prove a causal relationship. Nonetheless, the fact that there were quantifiable, systematic differences between the techniques of these elite athletes is a valuable information for the athletes or their coaches. We suggest that this analysis method may also be useful for technique analysis in many other sports.
Acknowledgements
The Norwegian School of Sport Sciences provided the necessary location and equipment used in this study. The authors express their gratitude to all participating athletes and to Vidar Jakobsen for technical support with the laboratory equipment.
Disclosure statement
No potential conflict of interest was reported by the authors.
References
- Andersson, E., Supej, M., Sandbakk, Ø., Sperlich, B., Stöggl, T., & Holmberg, H.-C. (2010). Analysis of sprint cross-country skiing using a differential global navigation satellite system. European Journal of Applied Physiology, 110(3), 585–595. doi:10.1007/s00421-010-1535-2
- Bronner, S., & Shippen, J. (2015). Biomechanical metrics of aesthetic perception in dance. Experimental Brain Research, 233(12), 3565–3581. doi:10.1007/s00221-015-4424-4
- Chow, J. W., & Knudson, D. V. (2011). Use of deterministic models in sports and exercise biomechanics research. Sports Biomechanics, 10(3), 219–233. doi:10.1080/14763141.2011.592212
- Daffertshofer, A., Lamoth, C. J., Meijer, O. G., & Beek, P. J. (2004). PCA in studying coordination and variability: A tutorial. Clinical Biomechanics, 19(4), 415–428. doi:10.1016/j.clinbiomech.2004.01.005
- Dempster, W. T., & Gaughran, G. R. (1967). Properties of body segments based on size and weight. Developmental Dynamics, 120(1), 33-54. doi: 10.1002/aja.1001200104
- Diaz, G. J., Fajen, B. R., & Phillips, F. (2012). Anticipation from biological motion: The goalkeeper problem. Journal of Experimental Psychology: Human Perception and Performance, 38(4), 848.
- Dona, G., Preatoni, E., Cobelli, C., Rodano, R., & Harrison, A. J. (2009). Application of functional principal component analysis in race walking: An emerging methodology. Sports Biomechanics, 8(4), 284–301. doi:10.1080/14763140903414425
- Federolf, P., Boyer, K., & Andriacchi, T. (2013). Application of principal component analysis in clinical gait research: Identification of systematic differences between healthy and medial knee-osteoarthritic gait. Journal of Biomechanics, 46(13), 2173–2178. doi:10.1016/j.jbiomech.2013.06.032
- Federolf, P., Reid, R., Gilgien, M., Haugen, P., & Smith, G. (2014). The application of principal component analysis to quantify technique in sports. Scandinavian Journal of Medicine & Science in Sports, 24(3), 491–499. doi:10.1111/j.1600-0838.2012.01455.x
- Federolf, P., Roos, L., & Nigg, B. M. (2013). Analysis of the multi-segmental postural movement strategies utilized in bipedal, tandem and one-leg stance as quantified by a principal component decomposition of marker coordinates. Journal of Biomechanics, 46(15), 2626–2633. doi:10.1016/j.jbiomech.2013.08.008
- Federolf, P. A. (2013). A novel approach to solve the “missing marker problem” in marker-based motion analysis that exploits the segment coordination patterns in multi-limb motion data. PloS one, 8(10),e78689. doi:10.1371/journal.pone.0078689.
- Federolf, P. A. (2016). A novel approach to study human posture control:“Principal movements” obtained from a principal component analysis of kinematic marker data. Journal of Biomechanics, 49(3), 364–370. doi:10.1016/j.jbiomech.2015.12.030
- Gløersen, Ø., & Federolf, P. (2016). Predicting missing marker trajectories in human motion data using marker intercorrelations. Plos One, 11(3), e0152616. doi:10.1371/journal.pone.0152616
- Hentschke, H., & Stüttgen, M. C. (2011). Computation of measures of effect size for neuroscience data sets. European Journal of Neuroscience, 34(12), 1887–1894. doi:10.1111/j.1460-9568.2011.07902.x
- Holmberg, H.-C., Lindinger, S., Stöggl, T., Eitzlmair, E., & Müller, E. (2005). Biomechanical analysis of double poling in elite cross-country skiers. Med Sci Sports Exerc, 37(5), 807–818. doi:10.1249/01.MSS.0000162615.47763.C8
- Hoset, M., Rognstad, A. B., Rølvåg, T., Ettema, G., & Sandbakk, Ø. (2014). Construction of an instrumented roller ski and validation of three-dimensional forces in the skating technique. Sports Engineering, 17(1), 23–32. doi:10.1007/s12283-013-0130-2
- Huys, R., Daffertshofer, A., & Beek, P. J. (2004). Multiple time scales and subsystem embedding in the learning of juggling. Human Movement Science, 23(3), 315–336. doi:10.1016/j.humov.2004.08.009
- Huys, R., Smeeton, N. J., Hodges, N. J., Beek, P. J., & Wiliams, A. M. (2008). On the dynamic information underlying visual anticipation skill. Perception & Psychophysics, 70(7), 1217–1234. doi:10.3758/PP.70.7.1217
- Lamoth, C., Daffertshofer, A., Huys, R., & Beek, P. (2009). Steady and transient coordination structures of walking and running. Human Movement Science, 28(3), 371–386. doi:10.1016/j.humov.2008.10.001
- Lees, A. (2002). Technique analysis in sports: A critical review. Journal of Sports Sciences, 20(10), 813–828. doi:10.1080/026404102320675657
- Losnegard, T., Myklebust H., Ehrhardt, A., & Hallén, J. (in press). Kinematical analysis of the V2 ski skating technique: A longitudinal study. Journal of Sports Sciences. doi: 10.1080/02640414.2016.1218036
- Losnegard, T., Myklebust, H., Spencer, M., & Hallén, J. (2013). Seasonal variations in V [combining dot above] O2max, O2-cost, O2-deficit, and performance in elite cross-country skiers. The Journal of Strength & Conditioning Research, 27(7), 1780–1790. doi:10.1519/JSC.0b013e31827368f6
- Mikkola, J., Laaksonen, M., Holmberg, H.-C., Vesterinen, V., & Nummela, A. (2010). Determinants of a simulated cross-country skiing sprint competition using V2 skating technique on roller skis. The Journal of Strength & Conditioning Research, 24(4), 920–928. doi:10.1519/JSC.0b013e3181cbaaaf
- Myklebust, H., Gløersen, Ø., & Hallén, J. (2015). Validity of ski skating center of mass displacement measured by a single inertial measurement unit. Journal of Applied Biomechanics. doi:10.1123/jab.2015-0081
- Myklebust, H., Losnegard, T., & Hallen, J. (2014). Differences in V1 and V2 ski skating techniques described by accelerometers. Scandinavian Journal of Medicine & Science in Sports, 24(6), 882–893. doi:10.1111/sms.12106
- Pataky, T. C., Robinson, M. A., & Vanrenterghem, J. (2013). Vector field statistical analysis of kinematic and force trajectories. Journal of Biomechanics, 46(14), 2394–2401. doi:10.1016/j.jbiomech.2013.07.031
- Purdy, L., & Jones, R. L. (2011). Choppy waters: Elite rowers’ perceptions of coaching. Sociology of Sport Journal, 28(3), 329–346. doi:10.1123/ssj.28.3.329
- Sandbakk, Ø., Ettema, G., Leirdal, S., & Holmberg, H.-C. (2012). Gender differences in the physiological responses and kinematic behaviour of elite sprint cross-country skiers. European Journal of Applied Physiology, 112(3), 1087–1094. doi:10.1007/s00421-011-2063-4
- Sandbakk, Ø., Ettema, G., Leirdal, S., Jakobsen, V., & Holmberg, H.-C. (2011). Analysis of a sprint ski race and associated laboratory determinants of world-class performance. European Journal of Applied Physiology, 111(6), 947–957. doi:10.1007/s00421-010-1719-9
- Smeeton, N., & Huys, R. (2011). Anticipation of tennis-shot direction from whole-body movement: The role of movement amplitude and dynamics. Human Movement Science, 30(5), 957–965. doi:10.1016/j.humov.2010.07.012
- Stoeggl, T. L., & Müller, E. (2009). Kinematic determinants and physiological response of cross-country skiing at maximal speed. Medicine and Science in Sports and Exercise, 41(7), 1476–1487. doi:10.1249/MSS.0b013e31819b0516
- Stöggl, T., Müller, E., & Lindinger, S. (2008). Biomechanical comparison of the double-push technique and the conventional skate skiing technique in cross-country sprint skiing. Journal of Sports Sciences, 26(11), 1225–1233. doi:10.1080/02640410802027386
- Troje, N. F. (2002). Decomposing biological motion: A framework for analysis and synthesis of human gait patterns. Journal of Vision, 2(5), 2. doi:10.1167/2.5.2
- Williams, G. K., Irwin, G., Kerwin, D. G., Hamill, J., Van Emmerik, R. E., & Newell, K. M. (2016). Coordination as a function of skill level in the gymnastics longswing. Journal Of Sports Sciences, 34(5), 429-439. doi: 10.1016/S0167-9457(00)00008-7
- Witte, K., Ganter, N., Baumgart, C., & Peham, C. (2010). Applying a principal component analysis to movement coordination in sport. Mathematical and Computer Modelling of Dynamical Systems, 16(5), 477–488. doi:10.1080/13873954.2010.507079
- Young, C., & Reinkensmeyer, D. J. (2014). Judging complex movement performances for excellence: A principal components analysis-based technique applied to competitive diving. Human Movement Science, 36, 107–122. doi:10.1016/j.humov.2014.05.009