
ABSTRACT
Rowers need to combine high sprint and endurance capacities. Muscle morphology largely explains muscle power generating capacity, however, little is known on how muscle morphology relates to rowing performance measures. The aim was to determine how muscle morphology of the vastus lateralis relates to rowing ergometer performance, sprint and endurance capacity of Olympic rowers. Eighteen rowers (12♂, 6♀, who competed at 2016 Olympics) performed an incremental rowing test to obtain maximal oxygen consumption, reflecting endurance capacity. Sprint capacity was assessed by Wingate cycling peak power. M. vastus lateralis morphology (volume, physiological cross-sectional area, fascicle length and pennation angle) was derived from 3-dimensional ultrasound imaging. Thirteen rowers (7♂, 6♀) completed a 2000-m rowing ergometer time trial. Muscle volume largely explained variance in 2000-m rowing performance (R2 = 0.85), maximal oxygen consumption (R2 = 0.65), and Wingate peak power (R2 = 0.82). When normalized for differences in body size, maximal oxygen consumption and Wingate peak power were negatively related in males (r = −0.94). Fascicle length, not physiological cross-sectional area, attributed to normalized peak power. In conclusion, vastus lateralis volume largely explains variance in rowing ergometer performance, sprint and endurance capacity. For a high normalized sprint capacity, athletes may benefit from long fascicles rather than a large physiological cross-sectional area.
Introduction
Rowing challenges athletes to optimize both endurance and sprint capacity (Secher, Citation1983). The 2000-m rowing race requires substantial aerobic energy contribution (~70–87%), but rowers are also physically strong compared to other endurance athletes (Lawton, Cronin, & McGuigan, Citation2011). Rowing performance is predicted by both maximal oxygen uptake (Smith & Hopkins, Citation2012) and all-out anaerobic sprint capacity (Lawton et al., Citation2011; Smith & Hopkins, Citation2012). Consequently, endurance and sprint (i.e., force and power generating) capacities are complementary determinants of 2000-m rowing performance in competitive female rowers (Riechman, Zoeller, Balasekaran, Goss, & Robertson, Citation2002), in male and female world championship rowers (Ingham, Whyte, Jones, & Nevill, Citation2002; Nevill, Allen, & Ingham, Citation2011) and (inter)national male rowers (Bourdin, Messonnier, Hager, & Lacour, Citation2004). Although endurance and sprint capacities are known predictors of rowing performance, it remains unknown how elite rowers establish both a high endurance and sprint capacity.
Combining high sprint and endurance capacity is challenging. Increasing both muscle fibre size and muscle fibre oxidative capacity is strongly endeavoured, but also difficult, as these are inversely related across species (including untrained humans) (Van Wessel, de Haan, van der Laarse, & Jaspers, Citation2010), within animal species (Sieck, Zhan, Prakash, Daood, & Watchko, Citation1995) and within well-trained competitive cyclists (Van der Zwaard et al., Citation2018). In addition, training-induced muscle adaptations are conflicting. When athletes perform concurrent endurance and resistance training, muscle hypertrophy and strength gains induced by resistance training are compromised (Coffey & Hawley, Citation2017; Hickson, Citation1980). Assessment of muscle properties, such as morphology of knee extensors in rowers, may provide insights in how sprint and endurance capacities are concurrently established. For instance, maximal force exertion by the muscle attributes to sprint capacity and is determined by the summation of cross-sectional areas of all muscle fibres (Folland & Williams, Citation2007), whereas a smaller muscle fibre diameter implies a shorter oxygen diffusion distance to the core of the muscle fibre, which is beneficial for high steady state oxidative metabolism (Van Wessel et al., Citation2010). However, data on muscle morphology of rowers is limited and very little is known on how muscle morphology of elite rowers relates to their sprint capacity, endurance capacity and 2000-m rowing performance.
3-dimensional ultrasound imaging enables quantification of muscle morphology, retrieving muscle volume and muscle architecture from the same 3-dimensional ultrasound voxel array (Weide et al., Citation2015; Weide, van der Zwaard, Huijing, Jaspers, & Harlaar, Citation2017). Muscle volume represents the total amount of contractile tissue, which influences total energy consumption and power generating capacity of the muscle (Beltman, van der Vliet, Sargeant, & de Haan, Citation2004; Secher, Citation1983; Wickiewicz, Roy, Powell, Perrine, & Edgerton, Citation1984). Mechanical muscle power is by definition the product of muscle force and shortening velocity, as experimentally shown in human and animal muscle (de Ruiter & De Haan, Citation2001; Plas et al., Citation2015). Muscle force is proportional to the number of sarcomeres arranged in parallel, i.e., muscle physiological cross-sectional area (Folland & Williams, Citation2007; R. L. Lieber & Fridén, Citation2000; Wickiewicz et al., Citation1984). Force exerted on the tendon is, however, reduced by the pennation angle of the fascicles (Huijing, Citation1998; Lieber & Fridén, Citation2000), which increases with muscle hypertrophy (Huijing, Citation1998; Kawakami, Abe, Kuno, & Fukunaga, Citation1995). Prime determinants of maximal shortening velocity are the number of sarcomeres arranged in series, i.e., fascicle length, and myosin heavy chain type distribution within the muscle (Folland & Williams, Citation2007; Lieber & Fridén, Citation2000; Timmins, Shield, Williams, Lorenzen, & Opar, Citation2016; Wickiewicz et al., Citation1984). Performance potential of a muscle group will therefore be enhanced by enlarged muscle volume through increases in fascicle length and/or physiological cross-sectional area (Wickiewicz et al., Citation1984). Indeed, trained male rowers have larger quadriceps muscle volume, thus a higher performance potential, in comparison to male controls (Ema, Wakahara, Kanehisa, & Kawakami, Citation2014).
Muscle architecture may be critical for how high endurance and sprint capacity are combined. Physiological cross-sectional area increases with muscle fibre hypertrophy in response to resistance training (Folland & Williams, Citation2007). Muscle fibre cross-sectional area is, however, inversely related to muscle fibre maximal oxygen consumption (Van der Zwaard et al., Citation2018; Van Wessel et al., Citation2010). This suggests that enlarging the fibre cross-sectional area not only increases pennation angle (Huijing, Citation1998), but also constrains oxygen diffusion (as it increases the diffusion distance). In turn, muscle fibre maximal oxygen consumption of the m. vastus lateralis strongly relates to whole-body maximal oxygen consumption during cycling (Van der Zwaard et al., Citation2016), which is an important determinant of endurance capacity. Therefore, a knee extensor muscle volume with a large physiological cross-sectional area is likely associated with a lower endurance capacity (assuming muscle fibre number is constant), while a long fascicle length may circumvent the negative effect of muscle fibre hypertrophy on oxygen diffusion and muscle fibre maximal oxygen consumption. Assessment of muscle morphology will complement insights in physiological determinants of rowing performance and in how endurance and sprint capacity are established.
The aim of this study was to determine how muscle morphology of the m. vastus lateralis relates to 2000-m rowing ergometer performance, sprint capacity and endurance capacity of Olympic rowers. Rowing is a complex movement that requires recruitment of many muscles crossing multiple joints. In the present study, we assessed morphology of the m. vastus lateralis, because activation of the quadriceps muscles, such as the m. vastus lateralis, is essential to the power production in rowing (Guével et al., Citation2011; Wilson, Robertson, & Stothart, Citation1988). Moreover, within the rowing stroke, activation of the m. vastus lateralis contributes to a smooth transition into recovery (Guével et al., Citation2011) and from recovery into the propulsion phase (Wilson et al., Citation1988). We hypothesized that 2000-m rowing performance, endurance capacity and sprint capacity are highly related to muscle volume, representing the total amount of contractile tissue. When normalized for body size differences, we expect that a long fascicle rather than large physiological cross-sectional area facilitates athletes to combine relatively high sprint and endurance capacities.
Methods
Participants
Eighteen rowers (8 heavyweight male, 4 lightweight male, 4 heavyweight female and 2 lightweight female rowers) volunteered to participate in this study (). Participants competed in different disciplines at the 2016 Olympics (17 rowers) or at the international level (1 rower), and included Olympic medallists. Rowers had on average 7.0 ± 2.8 years of international competitive experience and trained for ≥12 sessions per week. All oarsmen were sweep rowers, of whom six rowed on bow side and six on stroke side and female rowers consisted of five scull rowers and one sweep rower on stroke side. Irrespective of this distribution, it should be noted that stroke side of sweep rowers and leg dominancy do not lead to asymmetries in muscle morphology, muscle activation, force and peak power production (de Ruiter, de Korte, Schreven, & de Haan, Citation2010; Ema, Wakahara, Hirayama, & Kawakami, Citation2017; Parkin, Nowicky, Rutherford, & McGregor, Citation2001). Prior to participation, experimental procedures of the study were explained and all participants provided written informed consent. Participants were instructed to perform no strenuous exercise and consume no alcohol within the last 24 hours before each test, and were instructed not to consume food, caffeinated beverages or dietary supplements during the last three hours before each test. The study was conducted according to the principles of the Declaration of Helsinki and was approved by the medical ethics committee of the VU medical centre, Amsterdam, the Netherlands (NL54282.029.15).
Table 1. Participant characteristics (mean±SD).
Rowing ergometer performance
Rowing performance was obtained from a 2000-m time trial on a rowing ergometer (Concept II, Model D, Morrisville, VT, USA). Rowers were instructed to finish the time trial as fast as possible and were free to select their preferred damper setting. After the time trial, finish time and average power output were obtained from the ergometer display. Since measurements were performed during the pre-Olympic season and given the physiological and psychological strain of the time trial, it was not possible to incorporate the 2000-m rowing performance within the training schedules of all athletes. The 2000-m rowing ergometer performance was obtained in 13 rowers (7♂, 6♀).
Maximal incremental test
Maximal oxygen consumption, is one of the main determinants of endurance capacity (Joyner & Coyle, Citation2008; Van der Zwaard et al., Citation2018), was obtained from a maximal incremental test to voluntary exhaustion. The test consisted of a 7 × 4 min exercise protocol with 1-min rest between blocks on the Concept II ergometer (Model D). During the first four minutes, targeted power output was set at 40% of previously determined 2000-m mean power for men and at 45% for women, which was increased by 8% every 4-min block (Rice, Citation2011). The last 4-min exercise block was an all-out block. Respiratory data were recorded breath-by-breath using open circuit spirometry (Cosmed Quark CPET, Cosmed S.R.L., Rome, Italy) and prior to every test, the volume transducer and gas analyser were calibrated according to manufacturer’s instructions. Data was converted to second-by-second data and maximal oxygen consumption was calculated as highest 30-s moving average value achieved during the test to voluntary exhaustion.
Wingate test
To obtain peak power generating capacity, a primary determinant of sprint capacity, participants performed a 30-s Wingate test on a bicycle ergometer (Monark 894 E Peak Bike, Monark Exercise AB, Vansbro, Sweden, (Bar-Or, Citation1987)). The ergometer was designed to accurately measure accelerations with high temporal resolution more so than a rowing ergometer. The test was preceded by a 10-min warm-up (brake weight 1–1.5 kg) with three 10-s accelerations and a 2-min rest interval. Workload was set at 8% body mass for females or 10% for males and was automatically applied to the flywheel when cadence exceeded 70 revolutions per minute. Participants were instructed to remain seated and received strong verbal encouragement throughout the test. Peak (highest 1-s) power output, average power, and fatigue index (drop from peak power to minimal power expressed as percentage of peak power) were obtained from the Wingate test.
Isometric knee extension
For assessment of force generating capacity, an important determinant of sprint capacity, isometric knee extension torque of the right leg was measured using a custom-made dynamometer. Participants were firmly secured with straps over hips and shoulders, and the lower leg was protected by a shin guard and strapped to a force transducer (KAP E/200Hz, Bienfait B.V. Haarlem, The Netherlands), which was placed ~26.6 cm distally from the knee joint to measure force exertion at the shin. Hip flexion angle was set at 85° and knee flexion angle at 60°, which approximates optimal knee joint angle for maximal knee extension torque (Kooistra, Blaauboer, Born, de Ruiter, & de Haan, Citation2006), with 0° corresponding to full hip or knee extension. Active knee angle was set after alignment of the anatomical knee axis with the dynamometer rotation axis, while participants exerted a submaximal isometric contraction during knee extension. Knee extension torque was obtained by multiplication of measured forces (sampled at 1 kHz) with the lever arm. After a warm-up of three submaximal isometric contractions, participants performed a maximum of five attempts to attain peak isometric knee extension torque, while receiving online visual feedback of their force tracings. Peak isometric knee extension torque was the highest 100-ms moving average obtained from the 5-s isometric contractions.
Muscle morphology
Muscle morphology of m. vastus lateralis was determined using 3-dimensional ultrasound imaging, which demonstrates high reproducibility and validity (r > 0.98) and is previously described in detail (Weide et al., Citation2015, Citation2017). In short, B-mode ultrasound images of the right m. vastus lateralis were obtained using a 5-cm linear probe (Technos MPX, ESAOTE S.p.A. Italy), while the participant was positioned with hip angle at 95° and knee flexion angle at 60°. The shank was secured with straps to prevent leg displacement or rotation. Multiple longitudinal scans were made of the m. vastus lateralis from lateral to medial border, with the ultrasound probe in transverse orientation. The location and orientation of the probe were monitored by a motion capture system (Optotrak Certus, NDI, Waterloo, Canada) and synchronized with the ultrasound images (25 Hz) to construct a 3-dimensional voxel array, using customized software in Matlab (Mathworks Co, Natick,Massachusetts, USA).
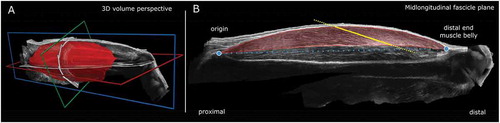
From this 3-dimensional ultrasound reconstructed voxel array, the origin and distal muscle belly end of the m. vastus lateralis were identified using 3-dimensional image processing software (MITK; www.mitk.org). Muscle volume was derived from manual segmentation of transversal cross-sections along the m. vastus lateralis length in MITK. Interactive interpolation was used to confirm identification of muscle boundaries. Note that visible adipose tissue and connective tissue incursions were carefully excluded from segmentation. Fascicle length and pennation angle between fascicle and distal aponeurosis were obtained from the mid-longitudinal “fascicle” plane at a position 2/3rd along the muscle belly (distal to the trochanter major, ). The mid-longitudinal plane was defined by the vector between origin and distal end of the m. vastus lateralis and a line representing the shortest distance between the tangent of the distal aponeurosis and the projection of this vector onto the anatomical cross-section 2/3rd along the muscle belly (distal to the trochanter major). Physiological cross-sectional area was calculated by dividing muscle volume by fascicle length. Because muscle force exerted on the patellar tendon is reduced by its pennation angle, physiological cross-sectional area was also multiplied by cosine of the pennation angle to obtain the effective physiological cross-sectional area (Erskine, Jones, Maganaris, & Degens, Citation2009).
Figure 1. Muscle morphology of the vastus lateralis muscle was characterized by 3-dimensional ultrasound imaging.
A reconstructed voxel array of the m. vastus lateralis of a heavyweight oarsman is shown in 3-dimensional, including longitudinal (blue), transversal (green) and coronal (red) planes (A). Fascicle length and pennation angle were obtained from the mid-longitudinal “fascicle” plane (B). The mid-longitudinal plane is defined by the vector between origin and distal end of the m. vastus lateralis and a line resembling the shortest distance between the tangent of the distal aponeurosis and the projection of this vector within the anatomical cross-section at 2/3rd of the muscle belly length (distal to the trochanter major).
Normalized sprint and endurance capacity
Maximal power of an organism scales with its body size. To assess biological differences in peak power and aerobic power production, we removed effects of body size by normalizing maximal oxygen consumption and Wingate peak power to lean body mass2/3 (von Dobeln, Citation1956). Isometric scaling predicts mass and volume to be proportional to body mass, cross-sectional or surface areas to be proportional to body mass2/3 and linear dimensions such as height or fascicle length to be proportional to body mass1/3 (Nevill, Bate, & Holder, Citation2005). Time is also considered a linear dimension (Secher, Citation1983). Consequently, maximal oxygen consumption (volumetime−1) and peak power (work
time−1) are proportional to body mass2/3. As body fat mass substantially influences body mass but does not contribute to maximal power, peak power and aerobic power are expected to be a linear function of (body mass – body fat)2/3 (Von Dobeln, Citation1956). Lean body mass was determined from the sum of 4 skinfolds (Durnin & Womersley, Citation1974) in 15 participants (10♂, 5♀), due to limited availability of athletes during the pre-Olympic season.
Statistics
All data are presented as individual values or as mean±SD. Differences between male and female rowers were assessed by independent T-test or Mann-Whitney U test. Effect sizes were calculated as Cohen’s d from group means and pooled standard deviations (see Equation 1). Relationships between morphological variables (volume, physiological cross-sectional area, pennation angle, fascicle length), (normalized) endurance and sprint capacity (maximal oxygen consumption, Wingate peak power, and knee extension torque) and 2000-m rowing average power were assessed by (partial) Pearson’s correlations and linear regressions. Effect sizes of relationships were assessed by Pearson’s correlations and coefficients of determination. Stepwise multiple regression analysis was used to predict 2000-m rowing performance (average power) from maximal oxygen consumption, Wingate peak power, and knee extension torque or from morphological variables. Predictors were included in the model if a significant R2 change (p < 0.05) was reported. Results are reported if assumptions for multiple regression analysis were met, demonstrating independent errors (indicated by a Durbin-Watson score between 1 and 3), no multicollinearity between predictors (reflected by a variance inflation factor <10 and tolerance >0.2), and homoscedasticity of residuals (normal distribution of standardized residuals). Sex differences in the relationship between significant predictors and 2000-m rowing performance were tested by “enter” multiple regressions (predictor, sex and predictorsex), and were acknowledged if the interaction effect was significant. Findings were considered to be significant if p < 0.05.
Results
summarizes age, body mass, height, 2000-m rowing ergometer performance, sprint and endurance capacity and muscle morphology in female, male and all rowers. The 2000-m rowing ergometer performance was strongly related to (both) endurance and sprint capacity (r = 0.95 and r = 0.90, respectively, n = 13). Multiple regression analysis revealed that maximal oxygen consumption and Wingate peak power together explained 98% of the variance in 2000-m ergometer power (R2 = 0.98).
Physiological cross-sectional area explained 68% (R2 = 0.68) and fascicle length 43% (R2 = 0.43) of the variance in ergometer performance, while pennation angle was not related to 2000-m rowing ergometer performance (R2 = 0.004). Multiple regression analysis revealed that m. vastus lateralis volume was the primary morphological determinant explaining 85% of variance in 2000-m rowing ergometer performance (R2 = 0.85, n = 13, see and ).
Table 2. Pearson correlations and 95% confidence intervals of relationships between muscle morphology and 2000-m rowing performance, endurance capacity and sprint capacity (i.e., power and force generating capacities).
Figure 2. Muscle volume largely explains 2000-m rowing ergometer performance (A), maximal oxygen consumption (B) and Wingate peak power (C).
Individual values (upper panel 7♂ and 6♀, lower panels 12♂ and 6♀) are shown for male and female rowers. The thick solid line represents the best linear fit based on individual values and the dotted lines represent the 95% prediction interval.
Maximal oxygen consumption, Wingate peak power and maximal isometric knee extension torque were related to m. vastus lateralis volume ( and , n = 18). Also physiological cross-sectional area and fascicle length were positively related to Wingate peak power, maximal oxygen consumption and maximal isometric knee extension torque (). In females, physiological cross-sectional area was strongly related to Wingate peak power and knee extension torque. In males, fascicle length was moderately related to Wingate peak power and knee extension torque. Taken together, these results show that m. vastus lateralis volume largely explained the variance in 2000-m rowing ergometer performance, endurance capacity and sprint capacity.
indicates that maximal oxygen consumption and Wingate peak power are a function of volume or size. When divided by body mass, maximal oxygen consumption and Wingate peak power were negatively related in males and were not significantly related in females (r = −0.68 and r = −0.60, respectively, )). Maximal oxygen consumption and peak power normalized to lean body mass2/3 were not related in females, but showed an inverse relationship in male rowers (r = −0.94, 10♂, )) consistent with the inverse relationship between muscle fibre maximal oxygen consumption and fibre cross-sectional area (Van der Zwaard et al., Citation2018; Van Wessel et al., Citation2010). Maximal oxygen consumption per lean body mass2/3 was not significantly related to physiological cross-sectional area (r = 0.28, n = 15), muscle volume (r = 0.22) or fascicle length (r = 0.13). Wingate peak power per lean body mass2/3 was positively related to muscle volume (r = 0.67, n = 15) and fascicle length (r = 0.66), but not to physiological cross-sectional area (r = 0.37). Thus, normalized sprint capacity was inversely related to normalized endurance capacity in male rowers. Unexpectedly, normalized endurance capacity was not related to physiological cross-sectional area. Fascicle length, but not physiological cross-sectional area, attributed to normalized sprint capacity.
Figure 3. Maximal oxygen consumption and Wingate peak power are inversely related in male rowers when normalized to body mass (A) or lean body mass2/3 (B).
Individual values (left panel 12♂, right panel 10♂) are shown for male rowers. Two rowers with the best (1) and second-best (2) performance were highlighted. The thick solid line represents the best linear fit based on individual values of oarsmen and the dotted lines represent the 95% prediction interval.
Discussion
This study shows that volume of m. vastus lateralis could explain a large proportion of the variance in 2000-m rowing ergometer performance, sprint capacity and endurance capacity. Following normalization to lean body mass2/3, sprint and endurance capacity were negatively related in males, but not related in females. Unexpectedly, a large physiological cross-sectional area did not seem detrimental for normalized maximal oxygen consumption, while fascicle length, and not physiological cross-sectional area, attributed to normalized peak power.
Sprint and endurance capacity of our rowers were complementary determinants of their 2000-m rowing ergometer performance, illustrating the high aerobic and anaerobic demands of a 2000-m rowing race (Secher, Citation1983; Smith & Hopkins, Citation2012). Our findings of Olympic rowers are in line with previous observations in competitive female rowers (R2 = 0.96, (Riechman et al., Citation2002)), world rowing finalists (R2 = 0.96–0.98, (Ingham et al., Citation2002; Nevill et al., Citation2011)) and (inter)national male rowers (R2 = 0.85, (Bourdin et al., Citation2004)). Ergometer testing is not confounded by environmental effects (e.g., wind or water current) and therefore facilitates standardized assessment of rowing performance. In addition, 2000-m rowing ergometer performance together with body mass predict 2000-m rowing performance on water (i.e., body mass affects water drag forces, but not drag forces of the rotating ergometer flywheel (Nevill, Beech, Holder, & Wyon, Citation2010)). Thus, morphological determinants of ergometer performance are also relevant for on-water rowing performance.
Muscle volume explains a large proportion of the variance in 2000-m rowing ergometer performance, sprint and endurance capacity
Volume of m. vastus lateralis showed the strongest relationship with 2000-m rowing ergometer performance, sprint capacity and endurance capacity (R2 = 0.60–0.85). The m. vastus lateralis volume of our male rowers was 900 cm3 (body mass ~90 kg). Previous studies have demonstrated m. vastus lateralis volumes of 750 cm3 in trained male rowers (body mass ~75 kg) (Ema et al., Citation2014) and 550–675 cm3 in male controls (body mass ~65 and ~75 kg, respectively) (Ema et al., Citation2014; Erskine et al., Citation2009). Vastus lateralis volume was strongly related to Wingate peak power and maximal oxygen consumption, illustrating that the muscle power generating capacity and oxygen consumption are strongly related to the total amount of contractile tissue. As m. vastus lateralis volume may be influenced by differences in sex and/or body size, we performed additional partial correlations controlling for sex and body size, which revealed that m. vastus lateralis volume and rowing ergometer performance were still strongly related after controlling for sex-differences (r = 0.72), but were unrelated after controlling for body size-differences (lean body mass2/3) (r = 0.23). In support of this finding, m. vastus lateralis volume was found to be strongly correlated to lean body mass2/3 (r = 0.95). These results imply that m. vastus lateralis volume explained variance in 2000-m rowing ergometer performance independent of sex-differences, but not independent of body-size differences in this homogeneous group of Olympic rowers. Based on these results, athletes may seek to obtain maximal ergometer performance by maximizing muscle volume within the limits of their weight class.
For improving rowing performance by increasing muscle volume, two considerations are of relevance. First, training-induced changes in muscle size also strongly impact muscle architecture. During muscle hypertrophy, muscle fibres require a larger attachment area onto the aponeurosis. This is facilitated by lengthening of the aponeurosis (Weide et al., Citation2015) or by increasing the pennation angle (Huijing, Citation1998). Moreover, muscle hypertrophy and changes in fascicle length both affect muscle optimum length (Huijing, Citation1998). During muscle activation, alterations in pennation angle contribute to muscle length changes (i.e., shortening velocity), while higher pennation angles reduce effective force exertion on the tendon (Huijing, Citation1998). In longitudinal studies, one should consider these architectural changes in response to training.
Second, muscle force and power are not solely determined by muscle volume, but also depend on specific force, the muscle force per effective physiological cross-sectional area, which can be estimated for the quadriceps femoris muscle of our rowers. First, force exerted by the mm. quadriceps femoris was calculated by dividing knee extension isometric torque by patellar moment arm. Patellar moment arm estimated at optimal knee joint angle is very similar between participants (average 4.7–4.8 cm (Erskine et al., Citation2009; Erskine, Jones, Williams, Stewart, & Degens, Citation2010)), and was assumed to be 4.75 cm in all rowers. M. vastus lateralis volume yields ~34% of the total mm. quadriceps femoris volume in rowers (Ema et al., Citation2014), and this percentage is similar for physiological cross-sectional area (Erskine et al., Citation2010), which we took into account. Specific force was then calculated to be 29 Ncm−2 in female and 32 N
cm−2 in male rowers, which was slightly higher than that of male controls (Narici, Landoni, & Minetti, Citation1992) and similar to the 30 N
cm−2 reported for male controls after 9 weeks of strength training (Erskine et al., Citation2010). Note that hypertrophied muscle fibres of body-builders demonstrated a lower fibre specific force than muscle fibres of power athletes and controls (Meijer et al., Citation2015). Our Olympic rowers also demonstrated a large physiological cross-sectional area and muscle volume, though not at the cost of their specific force. It remains to be established whether elite rowers may further enhance 2000-m rowing performance by obtaining a higher specific force.
Inverse relationship between normalized endurance and sprint capacity
To investigate intrinsic properties of the neuromuscular system, maximal oxygen consumption and Wingate peak power were normalized to lean body mass2/3. High normalized, rather than absolute, sprint and endurance capacities are essential to 2000-m rowing performance on water, as water resistance increases with body mass. Maximal oxygen consumption and Wingate peak power per body mass were inversely related in males (r = −0.68, 12♂), and not significantly related in a small group of females (r = −0.60, 6♀). Since peak power and maximal oxygen consumption scale with body size (Nevill et al., Citation2005), a scale-invariant relationship was obtained after normalization to lean body mass2/3. This relationship was non-significant in females, but evidently inverse in male rowers (r = −0.94, 10♂). Sex differences in maximal oxygen consumption are largely (but not fully) reduced by normalization to lean body mass (Ogawa et al., Citation1992), and also for our subjects, differences were still present after normalization to lean body mass2/3. The difference between sexes is likely due to reduced oxygen supply in females because of their lower haemoglobin concentrations (Mitchell et al., Citation1992). Our cross-sectional results indicate an inverse relationship between normalized endurance and sprint capacity in oarsmen that is consistent with the inverse relationship between muscle fibre maximal oxygen consumption and fibre cross-sectional area (Van der Zwaard et al., Citation2018; Van Wessel et al., Citation2010).
Given this inverse relationship (Van der Zwaard et al., Citation2018; Van Wessel et al., Citation2010), a large physiological cross-sectional area was also expected to be negatively related to maximal oxygen consumption normalized to lean body mass2/3. Physiological cross-sectional area of the m. vastus lateralis of our males was large (~87.5 cm2) compared to the 75 cm2 in male controls (Erskine et al., Citation2009). However, unexpectedly, the physiological cross-sectional area was not inversely related to normalized maximal oxygen consumption. An explanation could be that the physiological cross-sectional area of elite rowers is made up of a large number of muscle fibres, allowing fibre CSA to remain relatively small. Yet, biopsy studies on m. vastus lateralis of elite oarsmen have shown large fibre cross-sectional areas in combination with a large fraction of slow-twitch fibres (~70%) that are characteristic for endurance athletes (Larsson & Forsberg, Citation1980; Secher, Citation1983). Another explanation for the absent relationship between physiological cross-sectional area and normalized maximal oxygen consumption could be that oxygen diffusion was enhanced in our rowers providing sufficient oxygen supply from atmosphere to mitochondria, such that a large fibre cross-sectional area may be combined with high muscle fibre maximal oxygen consumption. In line with this, oarsmen show a relatively dense capillary network (Larsson & Forsberg, Citation1980; Secher, Citation1983), which may have explain these present findings.
Wingate peak power normalized to lean body mass2/3 was positively related to fascicle length and not related to physiological cross-sectional area. More sarcomeres in series (longer fascicle length) appears beneficial for sprinters, as elite 100-m sprinters showed longer fascicle lengths compared to long-distance runners and non-sprinters (Abe, Kumagai, & Brechue, Citation2000; Kumagai et al., Citation2000). An increase in fascicle length may be achieved by (eccentric) resistance training (Blazevich, Gill, Bronks, & Newton, Citation2003; Franchi, Atherton, Maganaris, & Narici, Citation2016; Timmins et al., Citation2016), but this also shifts optimal muscle torque/power generation towards higher contraction velocities (Timmins et al., Citation2016; Wickiewicz et al., Citation1984). Taken together, a combination of high normalized sprint capacity and endurance capacity may be achieved by long fascicles rather than a large physiological cross-sectional area.
Study limitations
Investigating a population of Olympic rowers provides the unique opportunity to obtain physiological determinants of rowing performance, as they have optimized their rowing technique and are uniquely trained to deliver the best 2000-m rowing performance. However, Olympic athletes form a small and rare population and therefore sample size in the present study was small. These factors should be considered before translating the present findings to other populations.
Muscle morphology was assessed of the m. vastus lateralis, which is part of the quadriceps femoris muscle and is essential to the power production in rowing (Guével et al., Citation2011; Wilson et al., Citation1988). We did not measure variability in quadriceps musculature or region-specific variation in muscle architecture along the muscle length. Yet, recent findings indicate that m. vastus lateralis is the largest quadriceps muscle in both male and female rowers and that only slight differences (≤2%) exist in volume distribution of quadriceps muscles between male and female rowers (Ema et al., Citation2017). Though muscle architecture varies along its length, inter-subject differences in one region are considerably similar to those in other regions of the m. vastus lateralis (Blazevich, Gill, & Zhou, Citation2006). As the region of our muscle architecture measurements was standardized, this would only have marginal effects on the correlations observed in the present study.
Maximal oxygen consumption is not the only determinant of endurance capacity. Nevertheless, maximal oxygen consumption is one of the main determinants of endurance capacity (Joyner & Coyle, Citation2008; Van der Zwaard et al., Citation2018) and strongly relates to muscle fibre maximal oxygen consumption of the m. vastus lateralis (Van der Zwaard et al., Citation2016).
The maximal power-producing capacity was assessed by the Wingate test and maximal force producing capacity was assessed by knee extension isometric torque. Though measurement of maximal dynamic force on a dynamometer may also enhance our understanding of the rowing performance, we assessed maximal knee extensor muscle force generating capacity by measurement of maximal isometric force. Dynamic force measurements involve activation of many muscles crossing multiple joints, whereas maximal isometric knee extension torque can be ascribed to only the knee extensor muscles, allowing determination of specific force.
Practical applications
Rowing ergometer performance requires both a high sprint and endurance capacity. Present findings show that a simple Wingate test and an incremental exercise test can be used to characterize athletes within the sprint-endurance continuum. For future (rowing) practice, these measures may also prove to be useful for identification of young talent and optimization of individual training strategies. Here we show that measurements of muscle morphology facilitate our understanding of how athletes achieve their performance. Future studies are warranted to validate how training strategies alter muscle morphology and whether these adaptations contribute to maximization of (rowing) performance.
Conclusions
Vastus lateralis muscle volume could explain a large proportion of the variance in 2000-m rowing ergometer performance, endurance capacity and sprint capacity. Therefore, athlete rowers may seek to maximize ergometer performance by maximizing their (vastus lateralis) muscle volume within the limits of the athlete’s weight class. When scaled for differences in body size, normalized sprint and endurance capacity were inversely related in oarsmen, indicating that maximizing both capacities appears to be challenging. Normalized endurance capacity was unexpectedly not negatively related to physiological cross-sectional area, whereas normalized sprint capacity was positively associated with fascicle length, but not with physiological cross-sectional area. To maximize normalized sprint capacity, athletes may therefore benefit from long fascicles, but it remains to be established to which extent functional elongation of muscle fascicles can be achieved by training.
Disclosure statement
No potential conflict of interest was reported by the authors.
Additional information
Funding
References
- Abe, T., Kumagai, K., & Brechue, W. F. (2000). Fascicle length of leg muscles is greater in sprinters than distance runners. Medicine and Science in Sports and Exercise, 32(6), 1125–1129.
- Bar-Or, O. (1987). The Wingate anaerobic test. An update on methodology, reliability and validity. Sports Medicine, 4(6), 381–394.
- Beltman, J. G. M., van der Vliet, M. R., Sargeant, A. J., & de Haan, A. (2004). Metabolic cost of lengthening, isometric and shortening contractions in maximally stimulated rat skeletal muscle. Acta Physiologica Scandinavica, 182(2), 179–187.
- Blazevich, A. J., Gill, N. D., Bronks, R., & Newton, R. U. (2003). Training-specific muscle architecture adaptation after 5-wk training in athletes. Medicine and Science in Sports and Exercise, 35(12), 2013–2022.
- Blazevich, A. J., Gill, N. D., & Zhou, S. (2006). Intra- and intermuscular variation in human quadriceps femoris architecture assessed in vivo. Journal of Anatomy, 209(3), 289–310.
- Bourdin, M., Messonnier, L., Hager, J. P., & Lacour, J. R. (2004). Peak power output predicts rowing ergometer performance in elite male rowers. International Journal of Sports Medicine, 25(5), 368–373.
- Coffey, V. G., & Hawley, J. A. (2017). Concurrent exercise training: Do opposites distract? Journal of Physiology, 595(9), 2883–2896.
- de Ruiter, C. J., & De Haan, A. (2001). Similar effects of cooling and fatigue on eccentric and concentric force-velocity relationships in human muscle. Journal of Applied Physiology, 90(6), 2109–2116.
- de Ruiter, C. J., de Korte, A., Schreven, S., & de Haan, A. (2010). Leg dominancy in relation to fast isometric torque production and squat jump height. European Journal of Applied Physiology, 108(2), 247–255.
- Durnin, J. V., & Womersley, J. (1974). Body fat assessed from total body density and its estimation from skinfold thickness: Measurements on 481 men and women aged from 16 to 72 years. British Journal of Nutrition, 32(1), 77–97.
- Ema, R., Wakahara, T., Hirayama, K., & Kawakami, Y. (2017). Effect of knee alignment on the quadriceps femoris muscularity: Cross-sectional comparison of trained versus untrained individuals in both sexes. Plos One, 12(8), e0183148.
- Ema, R., Wakahara, T., Kanehisa, H., & Kawakami, Y. (2014). Inferior muscularity of the rectus femoris to vasti in varsity oarsmen. International Journal of Sports Medicine, 35(4), 293–297.
- Erskine, R. M., Jones, D. A., Maganaris, C. N., & Degens, H. (2009). In vivo specific tension of the human quadriceps femoris muscle. European Journal of Applied Physiology, 106(6), 827–838.
- Erskine, R. M., Jones, D. A., Williams, A. G., Stewart, C. E., & Degens, H. (2010). Resistance training increases in vivo quadriceps femoris muscle specific tension in young men. Acta Physiologica, 199(1), 83–89.
- Folland, J. P., & Williams, A. G. (2007). The adaptations to strength training: Morphological and neurological contributions to increased strength. Sports Medicine, 37(2), 145–168.
- Franchi, M. V., Atherton, P. J., Maganaris, C. N., & Narici, M. V. (2016). Fascicle length does increase in response to longitudinal resistance training and in a contraction-mode specific manner. SpringerPlus, 5, 94.
- Guével, A., Boyas, S., Guihard, V., Cornu, C., Hug, F., & Nordez, A. (2011). Thigh muscle activities in elite rowers during on-water rowing. International Journal of Sports Medicine, 32(2), 109–116.
- Hickson, R. C. (1980). Interference of strength development by simultaneously training for strength and endurance. European Journal of Applied Physiology and Occupational Physiology, 45(2–3), 255–263.
- Huijing, P. A. (1998). Muscle, the motor of movement: Properties in function, experiment and modelling. Journal of Electromyography and Kinesiology, 8(2), 61–77.
- Ingham, S. A., Whyte, G. P., Jones, K., & Nevill, A. M. (2002). Determinants of 2,000 m rowing ergometer performance in elite rowers. European Journal of Applied Physiology, 88(3), 243–246.
- Joyner, M. J., & Coyle, E. F. (2008). Endurance exercise performance: The physiology of champions. The Journal of Physiology, 586(Pt 1), 35–44.
- Kawakami, Y., Abe, T., Kuno, S. Y., & Fukunaga, T. (1995). Training-induced changes in muscle architecture and specific tension. European Journal of Applied Physiology and Occupational Physiology, 72(1–2), 37–43.
- Kooistra, R. D., Blaauboer, M. E., Born, J. R., de Ruiter, C. J., & de Haan, A. (2006). Knee extensor muscle oxygen consumption in relation to muscle activation. European Journal of Applied Physiology, 98(6), 535–545.
- Kumagai, K., Abe, T., Brechue, W. F., Ryushi, T., Takano, S., & Mizuno, M. (2000). Sprint performance is related to muscle fascicle length in male 100-m sprinters. Journal of Applied Physiology, 88(3), 811–816.
- Larsson, L., & Forsberg, A. (1980). Morphological muscle characteristics in rowers. Canadian Journal of Applied Sport Sciences, 5(4), 239–244.
- Lawton, T. W., Cronin, J. B., & McGuigan, M. R. (2011). Strength testing and training of rowers: A review. Sports Medicine, 41(5), 413–432.
- Lieber, R. L., & Fridén, J. (2000). Functional and clinical significance of skeletal muscle architecture. Muscle & Nerve, 23(11), 1647–1666.
- Meijer, J. P., Jaspers, R. T., Rittweger, J., Seynnes, O. R., Kamandulis, S., Brazaitis, M., … Degens, H. (2015). Single muscle fibre contractile properties differ between body-builders, power athletes and control subjects. Experimental Physiology, 100(11), 1331–1341.
- Mitchell, J. H., Tate, C., Raven, P., Cobb, F., Kraus, W., Moreadith, R., … Wenger, N. (1992). Acute response and chronic adaptation to exercise in women. Medicine and Science in Sports and Exercise, 24(6 Suppl), S258–265.
- Narici, M. V., Landoni, L., & Minetti, A. E. (1992). Assessment of human knee extensor muscles stress from in vivo physiological cross-sectional area and strength measurements. European Journal of Applied Physiology and Occupational Physiology, 65(5), 438–444.
- Nevill, A. M., Allen, S. V., & Ingham, S. A. (2011). Modelling the determinants of 2000 m rowing ergometer performance: A proportional, curvilinear allometric approach. Scandinavian Journal of Medicine & Science in Sports, 21(1), 73–78.
- Nevill, A. M., Bate, S., & Holder, R. L. (2005). Modeling physiological and anthropometric variables known to vary with body size and other confounding variables. American Journal of Physical Anthropology, Suppl, 41, 141–153.
- Nevill, A. M., Beech, C., Holder, R. L., & Wyon, M. (2010). Scaling concept II rowing ergometer performance for differences in body mass to better reflect rowing in water. Scandinavian Journal of Medicine & Science in Sports, 20(1), 122–127.
- Ogawa, T., Spina, R. J., Martin, W. H., Kohrt, W. M., Schechtman, K. B., Holloszy, J. O., & Ehsani, A. A. (1992). Effects of aging, sex, and physical training on cardiovascular responses to exercise. Circulation, 86(2), 494–503.
- Parkin, S., Nowicky, A. V., Rutherford, O. M., & McGregor, A. H. (2001). Do oarsmen have asymmetries in the strength of their back and leg muscles? Journal of Sports Sciences, 19(7), 521–526.
- Plas, R. L. C., Degens, H., Meijer, J. P., de Wit, G. M. J., Philippens, I. H. C. H. M., Bobbert, M. F., & Jaspers, R. T. (2015). Muscle contractile properties as an explanation of the higher mean power output in marmosets than humans during jumping. Journal of Experimental Biology, 218(14), 2166–2173.
- Rice, T. (2011). 7 × 4 min step test protocol. Retrieved December 6, 2016, from https://www.scribd.com/document/24727614/Protocol-Step-Rowing
- Riechman, S. E., Zoeller, R. F., Balasekaran, G., Goss, F. L., & Robertson, R. J. (2002). Prediction of 2000 m indoor rowing performance using a 30 s sprint and maximal oxygen uptake. Journal of Sports Sciences, 20(9), 681–687.
- Secher, N. H. (1983). The physiology of rowing. Journal of Sports Sciences, 1(1), 23–53.
- Sieck, G. C., Zhan, W. Z., Prakash, Y. S., Daood, M. J., & Watchko, J. F. (1995). SDH and actomyosin ATPase activities of different fiber types in rat diaphragm muscle. Journal of Applied Physiology, 79(5), 1629–1639.
- Smith, T. B., & Hopkins, W. G. (2012). Measures of rowing performance. Sports Medicine, 42(4), 343–358.
- Timmins, R. G., Shield, A. J., Williams, M. D., Lorenzen, C., & Opar, D. A. (2016). Architectural adaptations of muscle to training and injury: A narrative review outlining the contributions by fascicle length, pennation angle and muscle thickness. British Journal of Sports Medicine, 50(23), 1467–1472.
- Van der Zwaard, S., de Ruiter, J. C., Noordhof, D. A., Sterrenburg, R., Bloemers, F. W., de Koning, J. J., … van der Laarse, W. J. (2016). Maximal oxygen uptake is proportional to muscle fibre oxidative capacity, from chronic heart failure patients to professional cyclists. Journal of Applied Physiology, 121(3), 636–645.
- Van der Zwaard, S., van der Laarse, W. J., Weide, G., Bloemers, F. W., Hofmijster, M. J., Levels, K., … Jaspers, R. T. (2018). Critical determinants of combined sprint and endurance performance: An integrative analysis from muscle fibre to the human body. FASEB Journal: Official Publication of the Federation of American Societies for Experimental Biology. doi:10.1096/fj.201700827R
- Van Wessel, T., de Haan, A., van der Laarse, W. J., & Jaspers, R. T. (2010). The muscle fibre type-fibre size paradox: Hypertrophy or oxidative metabolism?. European Journal of Applied Physiology, 110(4), 665–694.
- Von Dobeln, W. (1956). Maximal oxygen intake, body size, and total hemoglobin in normal man. Acta Physiologica Scandinavica, 38(2), 193–199.
- Weide, G., Huijing, P. A., Maas, J. C., Becher, J. G., Harlaar, J., & Jaspers, R. T. (2015). Medial gastrocnemius muscle growth during adolescence is mediated by increased fascicle diameter rather than by longitudinal fascicle growth. Journal of Anatomy, 226(6), 530–541.
- Weide, G., Van der Zwaard, S., Huijing, P. A., Jaspers, R. T., & Harlaar, J. (2017). 3D ultrasound imaging: Fast and cost-effective morphometry of musculoskeletal tissue. Journal of Visualized Experiments: JoVE, e55943, 129.
- Wickiewicz, T. L., Roy, R. R., Powell, P. L., Perrine, J. J., & Edgerton, V. R. (1984). Muscle architecture and force-velocity relationships in humans. Journal of Applied Physiology: Respiratory, Environmental and Exercise Physiology, 57(2), 435–443.
- Wilson, J.-M. J., Robertson, D. G. E., & Stothart, J. P. (1988). Analysis of lower limb muscle function in ergometer rowing. International Journal of Sport Biomechanics, 4(4), 315–325.