
ABSTRACT
The aim of this study was to compare different methods of detecting ventilatory indices (VI) and to investigate the impact of cardiorespiratory fitness (CRF) level on VI detection. Fifty females and fifty males completed a graded exercise test until volitional exhaustion with continuous gas-exchange measurement. The first and second ventilatory indices (VI-1, VI-2) were detected through different single automatic methods and through a semiautomatic method which combines visual and automatic detection methods. Additionally, the VIs were detected visually by two experts which served as the study specific gold standard. When comparing the semiautomatic method at VI-1 (intraclass correlation coefficients (ICC) 0.88 [0.81, 0.92], Bland-Altman bias ± limits of agreement (LoA) 55 ± 334 ml O2 · min−1) and VI-2 (ICC 0.97 [0.96, 0.98], LoA 1 ± 268 ml O2 · min−1) to the visually detected VI, high levels of agreements and no significant differences were found. This was not the case for any of the other automatic methods. Additionally, we couldn’t find any relevant differences regarding the CRF level.
We therefore concluded that the semiautomatic detection method should be used for VI detection, as results are more accurate than in any of the single-automatic methods.
Abbreviations: CPET: cardiopulmonary exercise test; CRF: Cardiorespiratory fitness; VO2peak: peak oxygen uptake; VI-1: first ventilatory indices; VI-2: second ventilatory indices; LoA: Bland-Altman bias ± limits of agreement; ICC: intraclass correlation coefficient.
Introduction
Incremental cardiopulmonary exercise testing (CPET) is used in research to provide prognostic values for populations (e.g. VO2peak), to assess functional capacity or impairment, to demarcate exercise-intensity domains, and to design training programs for athletes as well as for therapeutic purposes (Ross, Citation2003). The gold standard of measuring aerobic power, which serves as an index of cardiorespiratory fitness, is achieved by assessing maximal oxygen uptake (VO2max) (Ross, Citation2003). However, submaximal indices (e.g. anaerobic threshold, respiratory compensation point) have been shown to provide an alternative to VO2max and have shown their prognostic value in assessing the effectiveness of training, rehabilitation, and classifying the aerobic capacity of individuals (Meyer, Lucía, Earnest, & Kindermann, Citation2005). Furthermore, when utilising CPET it has been shown that people with a low exercise tolerance may not reach the maximal workload needed to achieve VO2max. Physical symptoms such as hypertension, dyspnoea or skeletal muscle soreness can limit exercise and therefore submaximal indices are highly valuable for interpreting aerobic capacity (Meyer et al., Citation2005).
Different submaximal ventilatory indices have been identified in previous research. A three-phase model with two ventilatory indices (VI-1 and VI-2; also called ventilatory threshold 1 and 2) is generally applied to detect the changes of metabolism, gas exchange variables, and ventilation during an incremental CPET (Binder et al., Citation2008; Meyer et al., Citation2005; Westhoff et al., Citation2013).
The VI-1 can be determined by finding the disproportional increase in a carbon dioxide (VCO2) vs. oxygen uptake (VO2) plot (Beaver, Wasserman, & Whipp, Citation1986). The VI-2 can be determined by finding the disproportional increase in a pulmonary ventilation (VE) vs. VCO2 plot (Wasserman, Whipp, & Davis, Citation1981). VI-1 and VI-2 can further be determined by the ventilatory equivalent method based on the equivalents for oxygen and carbon dioxide (EQO2, EQCO2) or the end-tidal partial pressure of oxygen and carbon dioxide (PETO2, PETCO2) (Binder et al., Citation2008; Meyer et al., Citation2005; Wasserman, Hansen, Sue, Whipp, & Froelicher, Citation2011; Westhoff et al., Citation2013).
As shown in previous studies the ability of interpreters to detected VI is strongly dependent on their experience and the use of a systematic approach. Dolezal et al. (Citation2017) reported agreement levels between interpreters using visual detection methods on VO2 at VI-1 ranging from ± 195 ml · min−1 (expert) to ± 790 ml · min−1 (novice). Similar levels of agreement (± 100 ml O2 · min−1 for VI-1 and ± 130 ml O2 · min−1 for VI-2) between experienced interpreters were reported by Santos and Giannella-Neto (Citation2004). In a recent paper Meyer et al. (Citation2005) mentioned that false detection of VI (e.g. mistakenly identifying VI-2 as VI-1) is still common in clinical exercise testing.
To increase observer reliability of VI detection, automatic methods have been developed, that commonly use piecewise linear regression models (e.g. Beaver et al., Citation1986). Hereby an assumption of the total number of “breakpoints (i.e. VI)” must be made beforehand utilising bi-segmental or tri-segmental models. Ekkekakis, Lind, Hall, and Petruzzello (Citation2008) compared nine automatic methods based on linear regression and found significant differences between the methods at VI-1 ranging from ± 790 ml O2· min−1 to ± 1.730 ml O2 · min−1. A difference in VI-1 of ± 830 ml O2 · min−1 between an automatic method using linear regression models and a visual detection by experienced interpreters was reported by Dolezal et al. (Citation2017). A possible explanation for these large differences is that these linear regression models can identify unreliable VI, especially in subjects with a low or undetectable VI-2 (Sherrill, Anderson, & Swanson, Citation1990).
Another VI-detection method consists of polynomial regression analysis without the need of assumptions about the shape of the curves or the number of “breakpoints”. Moreover, the shape of the polynomial function and its first and second derivate (slope and curvature of the regression) yield some additional information concerning the characteristics of the curves (Sherrill et al., Citation1990). Santos and Giannella-Neto (Citation2004) reported good agreement on VO2 between visual and automatic detection methods (using polynomial regression and calculation of the first and second derivatives of EQO2, EQCO2, PETO2, PETCO2, VE vs. VO2, and VE vs. VCO2 curves) ranging from ± 320 to ± 430 ml O2 · min−1 for VI-1, and ± 360 to ± 440 ml O2 · min−1 for VI-2 (32 participants aged 17–45 years). Wisén and Wohlfart (Citation2004) used polynomial regression models to automatically determine various VI in VO2, VCO2, EQO2, and EQCO2 time curves by calculating the first and second derivatives in 19 male participants aged 20–48 years. They had to manually adjust 34% of VI-1 and 40% of VI-2 determinations after a visual inspection of the graphical representations because of implausible values. These high percentages demonstrate the difficulty of automatic VI detection. In their analysis, Wisén and Wohlfart (Citation2004) also detected two patterns of VI related to the cardiorespiratory fitness (CRF) levels (i.e. aerobic power, VO2peak) of the participants, which may reflect different strategies of individuals to cope with the exercise strain indicated by the onset of lactate accumulation, isocapnic buffering or respiratory compensation. These different patterns may be one of the reasons for implausible values of VI using visual as well as automatic detection methods. Mixing up VI-2 with VI-1 is one of the most common methodological errors in the literature as well as results reported for VI-1 being usually too high (McLellan, Citation1987). Especially in subjects with low CRF levels, which are often unable to reach VI-2 during exercise testing or which does not show the expected ventilatory response curves, this false detection can occur (Meyer et al., Citation2005). To account for these different VI patterns and ventilatory response curves, detection methods should be tested on subjects with different CRF levels to insure their accuracy.
To conclude, the results from previous studies suggest that automatic VI-detection still needs to be visually inspected and corrected due to the high number of false VI-detection (Wisén & Wohlfart, Citation2004). Therefore, automatic detection methods should be further improved because precise identification of VI is essential for its utility in research and clinical practice.
Moreover, regarding an ageing population there is a need for reliable detection methods especially concerning sedentary and elderly subjects. To our knowledge, there are no studies comparing different automatic methods using polynomial regression in people older than 50 years and with different CRF levels.
Therefore, the aims of this study were: 1) to compare different methods (visual, automatic and semiautomatic) used to detect VI-1 and VI-2 in a group of 50–60 year old males and females from the Paracelsus 10.000 study (Salk, Citation2016), 2) to investigate the impact of the CRF level on the detection of VI-1 and VI-2, and finally 3) to create a recommendation for a systematic VI-detection method with clearly defined confidence levels.
Methods
Participants
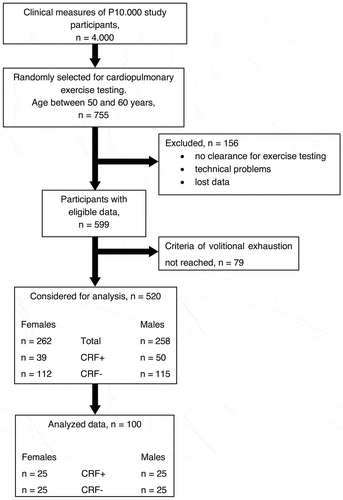
One hundred data-sets were randomly drawn from a sample of 520 Paracelsus 10.000 participants who reached volitional exhaustion (Salk, Citation2016). Hence, our sample used for VI detection consisted of 50 females (55 ± 3 years, 166 ± 7 cm, 68.3 ± 11.2 kg, VO2peak range: 16.2–43.3 ml · min−1 · kg−1) and 50 males (55 ± 3 years, 177 ± 6 cm, 82.9 ± 14.5 kg, VO2peak range: 19.0–45.3 ml · min−1 · kg−1). To test the impact of CRF level on the detection of VI-1 and VI-2 in males and females the investigated subjects were categorised into the following sub-groups: (1) CRF-, representing the ≤20. Percentile: VO2peak <27.0 ml · min−1 · kg−1 in males and <21.5 ml · min−1 · kg−1 in females. (2) CRF+, representing the ≥60. Percentile: VO2peak >34.0 ml · min−1 · kg−1 in males and >27.5 ml · min−1 · kg−1 in females (Rapp, Scharhag, Wagenpfeil, & Scholl, Citation2018). Thereafter, 25 data-sets per subgroup were selected to analyse the VI-detection (). The Paracelsus 10.000 Study conformed to the principles outlined in the Declaration of Helsinki and was approved by the local ethics committee (E1521). All participants gave written informed consent.
Figure 1. Participant flow. CRF+ = high cardiorespiratory fitness subgroup; CRF- = low cardiorespiratory fitness subgroup.
Data collection and processing
After a 2-minute stationary phase and a 2-minute warm-up phase at 10 W, each participant performed an incremental cycle ergometer task (ergo select 200P, ergo line GmbH, Bitz, Germany) until volitional exhaustion at a pedalling rate of 60 rpm. The test started at a workload of 40–60 W for females with an increase of 10–15 W every minute until exhaustion, while males started at 50–110 W with an increase of 10–15 W every minute. Starting workload and the consecutive work rates were dependent on sex and body mass to insure that volitional exhaustion was reached after 8 to12 minutes of test duration (American College of Sports Medicine, Citation2013). A 5-minute recovery phase at 10 W was completed after test termination.
Attainment of volitional exhaustion was confirmed if at least two of the following criteria were met: (1) a plateau in VO2 (2) EQO2 > 30, (3) respiratory exchange ratio (RER) > 1.1, (4) reaching 90% of age predicted maximum heart rate, (5) pedalling rate below 50 rpm. The exercise testing was terminated if any complications or contraindications occurred (Ross, Citation2003). Data-sets were excluded from further analysis, if the participants could not complete at least five minutes of the incremental exercise test, i.e. if they had not completed at least five load levels.
Continuous respiratory gas analysis and volume measurements were obtained breath-by-breath (Master Screen CPX, Jaeger, Hoechberg, Germany). Data from the stationary, warm-up and recovery phase were excluded from further analysis. 10-second time-based averages were calculated and the mean of the three successive highest 10-second VO2-values were taken as VO2peak. Peak power output (PPO) was determined as the mean power output during the last minute of the exercise test (Merry, Glaister, Howatson, & van Someren, Citation2016; Robergs & Burnett, Citation2003).
Visual method for VI detection
The visual detection of VI was conducted by two experts independently. VI-2 was determined by finding the disproportional increase in a VE vs. VCO2 plot (Wasserman et al., Citation1981) and VI-1 was determined by finding the disproportional increase in a VCO2 vs. VO2 plot (v-slope method; Beaver et al., Citation1986). The ventilatory equivalents method (Meyer et al., Citation2005) was then used to verify VI determination. The experts had no prior knowledge of any results or identity of the participants. In the presence of a difference greater ±300 ml O2 · min−1 in VI detection between the two experts (Gaskill et al., Citation2001), a third expert identified the respective VI after which the two closest VO2 values were used for further analysis. As primary outcome the mean VO2 of the two detected values was used to denote VI-1_visual and VI-2_visual (Santos & Giannella-Neto, Citation2004). The visual detection method served as our reference method and was compared to the automatic and semiautomatic detection methods (Dolezal et al., Citation2017; Novais et al., Citation2015).
Automatic methods using polynomial regression for VI detection
The VI-1 and VI-2 were automatically detected by fitting a 6th order polynomial (method: linear least squares; robust fitting option: bi-square) to the gas exchange and ventilatory time series of interest. The first four derivatives were further used to calculate local minima (min_EQO2, min_PETO2, min_EQCO2), local maxima (max_PETCO2), and local maximal positive curvatures (maxcurv_EQO2, maxcurv_PETO2, maxcurv_EQCO2, maxcurv_VCO2/VO2, maxcurv_VE/VCO2) and negative curvatures (maxcurv_PETCO2) of these polynomial functions (Cross, Morris, Schneider, & Sabapathy, Citation2012; Sherrill et al., Citation1990; Wisén & Wohlfart, Citation2004). VI-1 was defined as VO2 equal to the min_EQO2, min_PETO2, maxcurv_EQO2, maxcurv_PETO2 and maxcurv_VCO2/VO2. Further, VI-2 was defined as VO2 equal to min_EQCO2, max_PETCO2, maxcurv_EQCO2, maxcurv_PETCO2, and maxcurv_VE/VCO2 (Meyer et al., Citation2005). An nth order polynomial function can reveal a maximum of n-1 extrema. The curvature of the fitted 6th order polynomial is a 4th order polynomial function with three possible extrema (i.e. two minima and one maximum, or vice versa). Therefore, in the case of the occurrence of two extrema (two minima or two maxima), VI-1 was defined as the first and VI-2 as the second extrema (Sherrill et al., Citation1990).
Semiautomatic method for VI detection
A semiautomatic method (semiauto) with a systematic approach using automatic and visual detection (conducted by an expert as depicted in ) methods was developed to detect VI-1 and VI-2. For this purpose, different plots of the ventilatory variables together with the automatically detected VI (as described above) were reviewed and the expert visually chooses the most appropriate value (). To avoid false identification of VI-1 as VI-2, the VI-2 was detected first and then shown in the plots to help VI-1 detection. Finally, the expert assigned a level of confidence for VI-1 and VI-2 detection. The confidence levels were defined equal for VI-1 and VI-2 detection as follows (method A and B refer to the description in ):
Table 1. Guideline for the semiautomatic VI detection method.
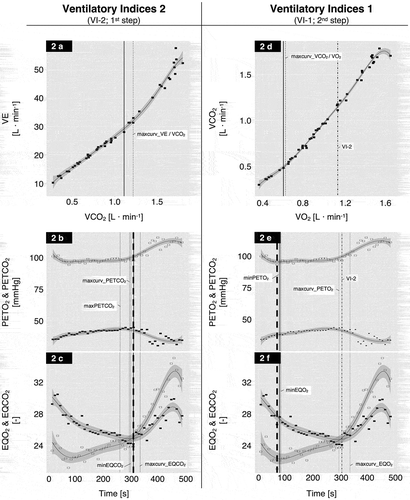
Figure 2. Sample ventilatory indices (VI) determination using the semiautomatic method for one subject. The left panels (a–c) illustrates the first step of the detection procedure (VI-2), the right panels (d–f) illustrates the second step (VI-1). The data-points (open and closed symbols) represent the 10-second time-based averaged breath-by-breath results of the CPET. Open symbols = PETO2 (2b/2e) and EQO2 (2c/2f); Closed symbols = PETCO2 (2b/2e) and EQCO2 (2c/2f); The solid lines along the data-points represent the fitted 6th degree polynomial with the 95% confidence interval (dark grey area). The dotted vertical lines represent the automatically calculated VIs, and the solid vertical lines represent the visually selected VIs. The vertical dashed thick lines in the panels 2b/2c and 2e/2f represent the visually selected VI-2 from panel 2a and the visually selected VI-1 from panel 2d, respectively. The dotted and dashed vertical lines in panels 2d – 2f represent the finally selected VI-2 from the 1st step (panels 2a – 2c).
Confidence Level 1 (two of the following three criteria had to be fulfilled): (1) The difference in the selected time point for the VI between the first (A) and the second (B) method was ≤30 s. (2) The selected VI could be clearly identified visually in both methods (A and B). (3) At least one of the automatically detected VIs was in agreement with the visually selected VI within a limit of ±30 s.
Confidence Level 2 (two of the following three criteria had to be fulfilled): (1) The difference in the selected time point for the VI between the first (A) and the second (B) method was ≤60 s. (2) The selected VI could be clearly identified visually with one of the two methods (A and B). (3) At least one of the automatically detected VIs was in agreement with the visually selected VI within a limit of ±60 s.
Confidence Level 3: all cases which didn’t fulfil the criteria for confidence level 1 and 2 were defined as indeterminable.
The VO2 values corresponding to the selected time points of VI-1 and VI-2, detected with the different automatic and semiautomatic methods described above, were then obtained by fitting a 6th order polynomial (method: linear least squares; robust fitting option: bi-square) to the VO2 time series data.
Statistical analysis
Data are given as mean ± standard deviation. Two-way ANOVA and post-hoc tests with Bonferroni-adjusted α were conducted to compare CRF-subgroups separated by sex (). The agreements between the experts for visual detection was assessed by calculating intraclass correlation coefficients (ICC [95% confidence interval]) based on a single-rater, absolute-agreement, and a two way mixed effects model (Koo & Li, Citation2016).
Table 2. Characteristics of cardiopulmonary exercise test (CPET) participants.
VO2 values between detection methods and CRF-subgroups were compared separately for VI-1 and VI-2 using two-way repeated-measures ANOVA. Post-hoc tests with Bonferroni-adjusted α were conducted to identify the differences between the detection methods.
The level of absolute agreement between the visual and the other two methods (automatic and semiautomatic) were evaluated by calculating ICC as described above and mean biases ±95% limits of agreement (LoA) according to Bland and Altman (Citation2010) for VI-1, VI-2, and each CRF subgroup.
A statistical power analysis was performed a priori for sample size estimation using G*Power version 3.1.9.2 (Faul, Erdfelder, Lang, & Bucher, Citation2007). With an assumed Type I error of .05 and a Type II error of .20 for finding a large effect (f value = .4 (Cohen, Citation1969)) between CRF level groups, the projected sample size is approximately 26 participants per group. Thus, our proposed sample size of 50 subjects per CRF level group should be more than adequate for the main objective of this study. The level of significance was set at α < .05. The statistical analyses were performed using RStudio version 1.1.383 (RStudio Inc., Boston, Massachusetts, USA).
Results
Participant characteristics
lists age, anthropometric characteristics and results of CPET for all CRF subgroups. There were no significant differences between the CRF subgroups in relation to age, height, VI-1_visual and VI-2_visual. For body mass and body mass index (BMI) we found significant higher values in participants of the low CRF subgroups. As expected, PPO, VO2peak, peak heart rate (HRpeak) and number of one-minute steps to reach volitional exhaustion during CPET (stepmax) were significantly higher in participants of the high CRF subgroups.
Agreement between researchers of the visual detection method
Agreement between the two researchers of the visual detection of 100 cases showed good to excellent reliability for VI-1 (ICC = .93 [.80, .97]) and excellent reliability for VI-2 (ICC = .98 [.98, .99]). Because of the high expert agreement and in accordance with others, the visually detected VI served as our reference method for further comparisons with the automatic and semiautomatic methods (Higa et al., Citation2007; Novais et al., Citation2015; Santos & Giannella-Neto, Citation2004).
Number of detectable cases
Of all cases, VI-1/VI-2 was successfully identified 88%/94% visually, 97%/89% through min_EQO2, 96%/85% through min_PETO2, 65%/85% through maxcurv_EQO2, 58%/83% through maxcurv_PETO2 and 92%/93% through maxcurv_VCO2/VO2. The semiautomatic method revealed the highest number of detectable cases in each CRF subgroup for VI-1 () and VI-2 ().
Table 3. Mean ± standard deviation of oxygen uptake (VO2) at ventilatory indices 1 determined by visual and automatic detection methods. Intraclass correlation coefficients (ICC) and mean bias ±95% limits of agreement (LoA) for comparisons between visual and the different automatic detection methods (5 single- and 1 semiautomatic).
Table 4. Mean ± standard deviation of oxygen uptake (VO2) at ventilatory indices 2 determined with visual and automatic detection methods. Intraclass correlation coefficients (ICC) and mean bias ± 95% limits of agreement (LoA) for comparisons between visual and the different automatic detection methods (5 single- and 1 semiautomatic).
VO2 obtained via different detection methods at VI-1 and VI-2
The absolute values (VO2 in ml O2 · min−1) corresponding to VI-1 and VI-2 detected via the different methods are shown in and . The estimates for VI-1 ranged from 977 ± 319 ml O2 · min−1 (min_EQO2) to 1334 ± 537 ml O2 · min−1 (maxcurv_PETO2) and for VI-2 from 1418 ± 457 ml O2 · min−1 (max_PETCO2) to 1735 ± 597 ml O2 · min−1 (visual). The CRF- subgroup resulted generally in lower estimates for VI-1 and VI-2 than the CRF+ subgroup.
For VI-1, two-way repeated-measures ANOVA revealed a significant main effect for detection method (F(6, 246) = 6.6, p < .001, η2p = .27), a significant main effect for CRF level (F(1, 41) = 4.6, p < .01, η2p = .10) but no significant interaction between the two. For VI-2, two-way repeated-measures ANOVA revealed a significant main effect for detection method (F(6, 372) = 7.0, p < .001, η2p = .26), a significant main effect for CRF level (F(1, 62) = 21.8, p < .001, η2p = .26), and a significant interaction between detection method and CRF level (F(6, 372) = 2.8, p < .05, η2p = .04).
Post hoc testing revealed no significant differences of VO2 to the visual method for maxcurv_EQO2, maxcurv_PETO2, and maxcurv_VCO2/VO2. Additionally, no significant differences were found in the semiauto method for VI-1 detection when comparing the total sample or the CRF+ subgroup. In the CRF- subgroup, none of the automatic methods differed significantly to the visual method (). For VI-2, no significant differences to the visual method were found for maxcurv_PETCO2 and semiauto method when comparing the total sample or the CRF subgroups.
Agreement between methods
The highest level of absolute agreement of the visual method was found for the semiauto method at VI-1 (ICC = .88 [.81, .92]) and VI-2 (ICC = .97 [.96, .98]) in the total sample. Similar results were found for both CRF subgroups (see and ). The lowest levels of agreements were found for maxcurv_EQO2, maxcurv_PETO2 and maxcurv_VCO2/VO2 method for VI-1, and max_PETCO2 and maxcurv_VE/VCO2 method for VI-2 in the total sample as well as in both CRF subgroups.
The mean biases ± LoA for the visually detected VI are shown in and for VI-1 and in and for VI-2. Although the mean bias of comparison between the visual and the various automatic methods was small (ranging from −292 to −216 ml O2 · min−1), the dispersion of agreement was large with the LoA ranging from ±268 to ±777 ml O2 · min−1 in the total sample. The smallest LoA were found for min_EQO2, min_PETO2 and semiauto at VI-1, and for semiauto at VI-2 in the total sample and in both CRF subgroups. The confidence levels for semiautomatic detection method can be seen in .
Table 5. Percentage of confidence level rating by the expert using the semiautomatic method for ventilatory indices (VI-1 and VI-2) determination.
Figure 3. Bland-Altman plots of the difference between the determinations of ventilatory indices 1 (VI-1) by visual, automatic (min_EQO2, min_PETO2, maxcurv_EQO2, maxcurv_PETO2 and maxcurv_VCO2/VO2) and semiautomatic (semiauto) methods vs. the mean of their determinations. The solid horizontal line represents the mean bias between the two methods, and the top and bottom dashed lines represent the 95% limits of agreement [± 1.96 · standard deviation]. Open symbols = low cardiorespiratory fitness subgroup; Closed symbols = high cardiorespiratory fitness subgroup; Circles = females; Squares = males.
![Figure 3. Bland-Altman plots of the difference between the determinations of ventilatory indices 1 (VI-1) by visual, automatic (min_EQO2, min_PETO2, maxcurv_EQO2, maxcurv_PETO2 and maxcurv_VCO2/VO2) and semiautomatic (semiauto) methods vs. the mean of their determinations. The solid horizontal line represents the mean bias between the two methods, and the top and bottom dashed lines represent the 95% limits of agreement [± 1.96 · standard deviation]. Open symbols = low cardiorespiratory fitness subgroup; Closed symbols = high cardiorespiratory fitness subgroup; Circles = females; Squares = males.](/cms/asset/ff108c32-aa56-4db1-baaf-54a1ccbacee3/rjsp_a_1725993_f0003_b.gif)
Figure 4. Bland-Altman plots of the difference between the determinations of ventilatory indices 2 (VI-2) by visual, automatic (min_EQCO2, max_PETCO2, maxcurv_EQCO2, maxcurv_PETCO2 and maxcurv_VE/VCO2) and semiautomatic (semiauto) methods vs. the mean of their determinations. The solid horizontal line represents the mean bias between the two methods, and the top and bottom dashed lines represent the 95% limits of agreement [± 1.96 · standard deviation]. Open symbols = low cardiorespiratory fitness subgroup; Closed symbols = high cardiorespiratory fitness subgroup; Circles = females; Squares = males.
![Figure 4. Bland-Altman plots of the difference between the determinations of ventilatory indices 2 (VI-2) by visual, automatic (min_EQCO2, max_PETCO2, maxcurv_EQCO2, maxcurv_PETCO2 and maxcurv_VE/VCO2) and semiautomatic (semiauto) methods vs. the mean of their determinations. The solid horizontal line represents the mean bias between the two methods, and the top and bottom dashed lines represent the 95% limits of agreement [± 1.96 · standard deviation]. Open symbols = low cardiorespiratory fitness subgroup; Closed symbols = high cardiorespiratory fitness subgroup; Circles = females; Squares = males.](/cms/asset/8ca35770-6886-4e58-a17a-1b2467a4ac6b/rjsp_a_1725993_f0004_b.gif)
Discussion
It has been shown previously, that changes in gas exchange analysed visually or automatically, and blood lactate accumulations correspond with each other. Therefore, the detection of VI from gas exchange and ventilatory variables is an appropriate non-invasive method to describe metabolic changes during incremental CPET (Binder et al., Citation2008; Meyer et al., Citation2005; Westhoff et al., Citation2013). The purpose of this study was to extend these findings by providing additional information about the accuracy of different methods used to detect VI-1 and VI-2 in a group of 50–60 years old males and females, and to investigate the impact of CRF level on VI detection. Further, we created a recommendation for a systematic VI detection method with clearly defined confidence levels.
Participant characteristics
Body mass and BMI, as well as the results of CPET (PPO, VO2peak, HRpeak, stepmax) showed significant differences between the CRF subgroups (). Compared to reference values for VO2peak published by Rapp et al. (Citation2018), the CRF- and CRF+ subgroup presented with a mean VO2peak correspond approximately to the 10th and 80th percentile, respectively.
In the current study, the visual detection method (the reference method in this study) revealed a VI-1 of 54 ± 10% of VO2peak and VI-2 of 83 ± 10% of VO2peak in the total sample. No significant differences for VI-1 and VI-2 could be found between the CRF subgroups. These findings are in agreement with other studies using automatic as well as visual detection methods (Gaskill et al., Citation2001; Meyer et al., Citation2005; Santos & Giannella-Neto, Citation2004; Wisén & Wohlfart, Citation2004).
Number of detectable cases
The semiautomatic method proved to be the detection method with the highest receiver rate compared to any of the automatic methods for VI-1 and VI-2 in the total sample as well as in both CRF subgroups. For VI-1 detection in the CRF- subgroup, the maxcurv_EQO2 and maxcurv_PETO2 resulted in detection rates of only 58% and 42%, respectively. Low detection rates of single automatic methods have been reported previously by others (e.g. 66% for VI-1 and 60% for VI-2 (Wisén & Wohlfart, Citation2004)). Furthermore, an improvement of detection rates by combining different visual detection methods were reported by Gaskill et al. (Citation2001). To our knowledge this is the only study showing an improvement in detection rates by combining automatic and visual detection methods. Though improved levels of detection rates are valuable, the accuracy of a combined detection method should also be high.
Agreement between the visual and the various automatic methods
For VI-1 detection, we found higher agreement (expressed as ICC and mean bias ± LoA) between visual, and min_EQO2 and min_PETO2 method than for the “maxcurv” detection methods (maxcurv_EQO2, maxcurv_PETO2 and max_VCO2/VO2) in the total sample as well as in both CRF subgroups. As described by Meyer et al. (Citation2005), the EQO2 time series can produce two inflection points, a first corresponding to VI-1 and a second caused by hyperventilation at VI-2. When using automatic as well as visual detection methods, the second inflection point could mistakenly be identified as VI-1 (e.g. as a consequence to irregularities in breathing pattern at VI-1 or a greater disproportional increase at VI-2), which is “[…] the single most common methodological error in the literature” as stated by McLellan (Citation1987). This second inflection point could also be a reason for the slightly smaller inter-rater reliability for visual detection of VI-1 than VI-2. This smaller inter-rater reliability for VI-1 detection is substantiated by the high number of cases (17 out of 100), where the disagreement between the two experts during the visual detection was greater 300 ml O2 · min−1 and therefore had to be verified by a third expert.
For VI-2 detection, agreement was similar throughout all applied automatic methods in the total sample with ICC ranging from .74 to .85, mean biases ranging from −292 to −69 ml O2 · min−1, and LoA ranging from ±511 to ±727 ml O2 · min−1. Despite the ICC-results have shown moderate to good reliability, the result of the LoA analysis indicates substantial differences between the visual and the different automatic detection methods. Similar conclusions can be drawn from the analysis of the CRF subgroups for VI-2 detection.
A thorough examination of the Bland-Altman plots for all automatic methods ( and ) revealed similar inter-method differences (y-axis) throughout the full range of their mean estimates (x-axis). It is noteworthy that, for nearly every automatic method we found subjects with values far outside the concordance intervals. This was found for the total sample as well as for both CRF subgroups (empty vs. filled symbols). Therefore, CRF level does not seem to have an impact on VI detection in 50 to 60 years old adults.
Despite the high ICC found for some of the automatic detection methods, taking into account the high LoA and the number of subjects with values outside the concordance intervals, none of the automatic detection methods used in our study can be recommended for VI-1 as well as VI-2 detection in 50 to 60 years old adults.
The semiautomatic detection method
It has been shown by Dolezal et al. (Citation2017), that a systematic approach combining detection methods based on different ventilatory and gas exchange response variables can increase agreement on VO2 at VI-1 between interpreters. However, the agreement is strongly dependent on the experience of the interpreters and the characteristics of the subjects investigated. In the referred study CPET data from 10 healthy, recreational active young men (25 ± 5 years) were analysed (Dolezal et al., Citation2017). Gaskill et al. (Citation2001) used CPET data from three different populations (athletes, active, and sedentary males and females aged between 15 to 52 years) to show improved agreement on VO2 at VI-1 up to 11 ± 300 ml O2 · min−1 by combining three different visual detection methods. We found no studies which looked at combined detection methods for VI-2.
In our study, the semiautomatic detection method yielded the highest agreement for VI-1 and VI-2 in 50 to 60 years old adults, shown by the lowest mean bias ± LoA and the highest ICC ( and ) in the total sample as well as in both CRF subgroups.
These improvements in inter-method agreement are similar to the studies mentioned above and therefore, this is the first study to show an improved accuracy of VI detection by combining different automatic procedures along with visual judgement. The high confidence levels rated by the expert for the semiautomatic method (VI-1: level 1 = 63% and level 2 = 34%; VI-2: level 1 = 71% and level 2 = 25%) indicate that the semiautomatic systematic approach provides a useful support for VI detection.
Especially in clinical circumstances, where false VI detection can lead to harmful consequences, e.g. by misclassifying surgical candidates into inappropriate risk categories (Vainshelboim et al., Citation2017), the semiautomatic method with clearly defined confidence levels can support clinical personal in their decision making. However, further research is needed to improve confidence level definitions for specific populations (e.g. age classes, athletes, sedentary or clinical populations).
The lack of blood lactate measures to validate the visually detected VI can be seen as a limitation. However, previous reports have shown good agreement between visually detected VI based on respiratory and gas exchange measures, and lactate responses (Binder et al., Citation2008; Meyer et al., Citation2005; Westhoff et al., Citation2013). Therefore, it can be considered appropriate using the visually detected VI as our reference method. Because of the high number of not detectable cases in the various automatic methods, only 43/100 complete cases for VI-1 and 64/100 complete cases for VI-2 could be used to calculate the two-way repeated-measures ANOVA. Therefore, results should be interpreted with caution.
Conclusion
The results of this study demonstrate that automatic methods based on polynomial regression are useful for detecting VI in 50 to 60 years old adults. In this study we could not find any differences between the CRF subgroups regarding the accuracy of VI detection. However, as different patterns in the gas exchange and ventilatory response curves may exist, the detection of VI based on a single automatic method can lead to incorrect VI detection and therefore false classification of aerobic capacity or inadequate training recommendations. The proposed semiautomatic detection method using a systematic approach and clearly defined confidence levels seem promising in overcoming these limitations.
Author Contributions Statement
M.P, S.RD and S.T conceived and designed research. M.P conducted experiments, analyzed data and drafted the manuscript. B.I and B.P intellectually contributed the content of the manuscript. All authors read and approved the final version of the manuscript.
Disclosure statement
No potential conflict of interest was reported by the authors.
References
- American College of Sports Medicine. (2013). Guidelines for exercise testing and prescription. Philadelphia, PA: Lippincott Williams & Wilkins.
- Beaver, W. L., Wasserman, K., & Whipp, B. J. (1986). A new method for detecting anaerobic threshold by gas exchange. Journal of Applied Physiology, 60, 2020–2027.
- Binder, R. K., Wonisch, M., Corra, U., Cohen-Solal, A., Vanhees, L., Saner, H., & Schmid, J.-P. (2008). Methodological approach to the first and second lactate threshold in incremental cardiopulmonary exercise testing. European Journal of Cardiovascular Prevention & Rehabilitation, 15, 726–734.
- Bland, J. M., & Altman, D. G. (2010). Statistical methods for assessing agreement between two methods of clinical measurement. International Journal of Nursing Studies, 47, 931–936.
- Cohen, J. (1969). Statistical power analysis for the behavioral sciences. New York, NY: Academic Press.
- Cross, T. J., Morris, N. R., Schneider, D. A., & Sabapathy, S. (2012). Evidence of break-points in breathing pattern at the gas-exchange thresholds during incremental cycling in young, healthy subjects. European Journal of Applied Physiology, 112, 1067–1076.
- Dolezal, B. A., Storer, T. W., Neufeld, E. V., Smooke, S., Tseng, C.-H., & Cooper, C. B. (2017). A systematic method to detect the metabolic threshold from gas exchange during incremental exercise. Journal of Sports Science & Medicine, 16, 396–406.
- Ekkekakis, P., Lind, E., Hall, E. E., & Petruzzello, S. J. (2008). Do regression-based computer algorithms for determining the ventilatory threshold agree? Journal of Sports Sciences, 26, 967–976.
- Faul, F., Erdfelder, E., Lang, A., & Bucher, A. (2007). G*Power 3: A flexible statistical power analysis program for the social, behavioral, and biomedical sciences. Behavior Research Methods, 39, 175–191.
- Gaskill, S. E., Ruby, B. C., Walker, A. J., Sanchez, O. A., Serfass, R. C., & Leon, A. S. (2001). Validity and reliability of combining three methods to determine ventilatory threshold. Medicine and Science in Sports and Exercise, 33, 1841–1848.
- Higa, M. N., Silva, E., Neves, V. F. C., Catai, A. M., Gallo, L. Jr, & Silva de Sá, M. F. (2007). Comparison of anaerobic threshold determined by visual and mathematical methods in healthy women. Brazilian Journal of Medical and Biological Research, 40, 501–508.
- Koo, T. K., & Li, M. Y. (2016). A guideline of selecting and reporting intraclass correlation coefficients for reliability research. Journal of Chiropractic Medicine, 15, 155–163.
- McLellan, T. (1987). The anaerobic threshold: Concept and controversy. Australian Journal of Science and Medicine in Sport, 19, 3–8.
- Merry, K. L., Glaister, M., Howatson, G., & van Someren, K. (2016). The exercise intensity at maximal oxygen uptake (iVO 2max): Methodological issues and repeatability. European Journal of Sport Science, 1391, 1–7.
- Meyer, T., Lucía, A., Earnest, C. P., & Kindermann, W. (2005). A conceptual framework for performance diagnosis and training prescription from submaximal gas exchange parameters–theory and application. International Journal of Sports Medicine, 26(Suppl 1), S38–48.
- Novais, L. D., Silva, E., Simões, R. P., Sakabe, D., Martins, L., Oliveira, L., … Catai, A. (2015). Anaerobic threshold by mathematical model in healthy and post-myocardial infarction men. International Journal of Sports Medicine, 37, 112–118.
- Rapp, D., Scharhag, J., Wagenpfeil, S., & Scholl, J. (2018). Reference values for peak oxygen uptake: Cross-sectional analysis of cycle ergometry-based cardiopulmonary exercise tests of 10 090 adult German volunteers from the prevention first registry. BMJ Open, 8, 1–11.
- Robergs, R. A., & Burnett, A. F. (2003). Methods used to process data from indirect calorimetry and their application to VO2max. Journal Of Exercise Physiology Online / American Society of Exercise Physiologists, 6, 44–57.
- Ross, R. M. (2003). ATS/ACCP statement on cardiopulmonary exercise testing. American Journal of Respiratory and Critical Care Medicine, 167, 211–277.
- Salk. (2016) Paracelsus study. Retrieved from http://www.salk.at/12103.html
- Santos, E. L., & Giannella-Neto, A. (2004). Comparison of computerized methods for detecting the ventilatory thresholds. European Journal of Applied Physiology, 93, 315–324.
- Sherrill, D. L., Anderson, S. J., & Swanson, G. (1990). Using smoothing splines for detecting ventilatory thresholds. Medicine & Science in Sports & Exercise, 22, 684–689.
- Vainshelboim, B., Rao, S., Chan, K., Lima, R. M., Ashley, E. A., & Myers, J. (2017). A comparison of methods for determining the ventilatory threshold: Implications for surgical risk stratification. Canadian Journal of Anesthesia/Journal Canadien D’anesthésie, 64, 634–642.
- Wasserman, K., Hansen, J. E., Sue, D. Y., Whipp, B. J., & Froelicher, V. F. (2011). Principles of exercise testing and interpretation (5th ed.). Baltimore: Lippincott Williams & Wilkins.
- Wasserman, K., Whipp, B., & Davis, J. A. (1981). Respiratory physiology of exercise: Metabolism, gas exchange, and ventilatory control. International Review of Physiology, 23, 149–211.
- Westhoff, M., Rühle, K. H., Greiwing, A., Schomaker, R., Eschenbacher, H., Siepmann, M., & Lehnigk, B. (2013). Positional paper of the German working group “cardiopulmonary exercise testing” to ventilatory and metabolic (lactate) thresholds. Dtsch Medizinische Wochenschrift, 138, 275–280.
- Wisén, A. G. M., & Wohlfart, B. (2004). A refined technique for determining the respiratory gas exchange responses to anaerobic metabolism during progressive exercise - repeatability in a group of healthy men. Clinical Physiology and Functional Imaging, 24, 1–9.