
 ?Mathematical formulae have been encoded as MathML and are displayed in this HTML version using MathJax in order to improve their display. Uncheck the box to turn MathJax off. This feature requires Javascript. Click on a formula to zoom.
ABSTRACT
The aims of this study were (a) to describe the kinematics underlying the phenomenon of the knee of the swing leg passing medially in front of the athlete during the single push (SP) phase of the block sprint start, and (b) to determine the relationships between block phase pelvis range of motion (RoM), 1st step width and block phase performance. Three-dimensional kinematic data (250 Hz) were collected from eleven competitive sprinters (100 m PB: 11.17 ± 0.41) performing maximal effort block starts. The joint angles of the rear hip with respect to the pelvis and the pelvis segment angles with respect to the laboratory coordinate system were calculated during the block start phase to the end of the 1st stance. A combination of pelvis list and rotation (not hip adduction) was coupled with the thigh of the swing leg moving medially during the SP phase. A very high positive correlation was found between pelvic list RoM and 1st step width (r = 0.799, p = 0.003). No other significant correlations were found. Attempting to reduce pelvic RoM or changing frontal and transverse plane hip joint angles to minimise medial thigh motion is unlikely to lead to an improvement to performance.
Introduction
The execution of an efficient block start is essential to success in 60 m and 100 m sprinting (Willwacher et al., Citation2016). In order to understand how posture (i.e., joint angles) on the starting blocks affects performance, several studies have focused on the relationship between sagittal plane lower body joint angles in the “set” position, block exit velocity (Coh et al., Citation1998; Mero et al., Citation1983) and normalised average horizontal external block power (PNAHB) (Bezodis et al., Citation2015). Since only weak correlations and wide inter-participant variation were found, the results of these studies suggest that a range of “set” positions can be used and hence there is no single optimal “set” position.
Surprisingly little attention has been given to postural changes (i.e., joint angles as a function of time) during a block start despite their relevance for coaching and biomechanical knowledge. In addition to lower body joint angles in the “set” position, the study by Bezodis et al. (Citation2015), also examined the relationships between the range of motion (RoM) of the lower-limb joints in the sagittal plane and PNAHB during the block phase. A moderate positive relationship (r = 0.49) was found for the relationships between rear hip RoM and PNAHB. Slawinski et al. (Citation2010); Slawinski et al. (Citation2013), examined joint velocities and segment kinetic energy, respectively, while only one study has graphically illustrated how the lower body joint angles vary with time from the start to the end of the 2nd stance phase (Debaere et al., Citation2013). The studies by both Slawinski et al. (Citation2010), Slawinski et al. (Citation2013) and Debaere et al. (Citation2013) analysed the starting motion in three dimensions (3D) and showed that considerable lower body segment motion, during both the block and 1st stance phase, occurs outside of the sagittal plane. One of the most notable frontal plane actions in the block start is where the thigh of the swing leg moves medially in front of the athlete during the single push (SP) phase. Some high-performance coaches believe that this is detrimental to performance. Despite this, there is a paucity of information about the nature of this movement and its contribution to performance. The data provided by Debaere et al. (Citation2013) suggests that pelvic motion (rather than simply hip adduction and/or internal rotation) could be the primary kinematic cause of this thigh motion.
Although the dominant motion of the pelvis during the block phase is seen in the sagittal plane, the frontal and transverse plane motion could influence the PNAHB. Since the hip extensor muscles originate on the pelvis, changes in the orientation of the pelvis will presumably affect the contractile mechanics of muscles attached to the lower body segments which could influence the generation of ground reaction force (Nagahara et al., Citation2018), which in turn may affect PNAHB.
The description of lower body motion occurring outside the sagittal plane by Debaere et al. (Citation2013) and Slawinski et al. (Citation2010) supports the findings by Ito et al. (Citation2006) and Nagahara et al. (Citation2017) that the initial steps after leaving the starting blocks are wider than at any other stage of the race. This wide step width during the sprint start results in a “flailing” of the legs out to the side (Jessop, Citation2011). Sandamas et al. (Citation2018) showed that medial block impulse correlated with 1st step width. Although when the step width was restricted, no immediate improvement in PNAHB or external 1st stance power (PNAH) were seen. However, the relationship between PNAHB and 1st step width and 1st step width and PNAH were not reported.
The aims of this study are twofold, first to ascertain if the medial thigh motion during the SP phase is primarily coupled to a combination of 3D pelvis rotations as opposed to just hip internal rotation and/or adduction of the swing leg. The 2nd aim is to determine the relationships between block phase kinematics, 1st step width and the performance measures PNAHB and PNAH.
Methods
Participants
Eleven competitive sprinters (nine male and two female) participated in this study: (mean ± SD) age 23.8 ± 5.29 years, height 1.77 ± 0.10 m and mass 72.7 ± 13.3 kg. Their 100 m personal best was 11.02 ± 0.34 s and 11.6 ± 0.45 s for the men and the woman, respectively. The participants included one former European Indoor Championships 60 m finalist and one World record holder (indoor hurdles). Written informed consent was obtained from the athletes and the study was approved by the Stockholm Regional Ethical Committee.
Procedures
Testing took place indoors in a laboratory fitted with a 1.22 m wide tartan running surface. The running track was 15 m long, fitted with a crash mat on the end wall. To ensure the athletes were not affected by the restricted laboratory track length, a pilot test was performed on a full-size indoor running track. The vertical position of an athlete’s C7 marker as a function of time was compared between track and laboratory running. Using the Wilcoxon Signed Rank test, no significant differences were observed. We thus assume that the laboratory setting was adequate for testing the hypothesis of this study.
After an individualised warm-up, each participant performed five maximum effort block starts. The starting commands were similar to those in competition, with the exception that a loud hand clap was used instead of a starting pistol. 3D kinematic data and external forces were collected from the initiation of the starting command to the end of the first step contact phase. The athletes decided how much recovery time they needed between trials (approximately 5 min).
Kinematic data were recorded with a 12-camera (Oqus 4, Qualisys AB, Göteborg, Sweden) motion analysis system at a sampling frequency of 250 Hz. A full-body marker protocol consisting of 78 retroreflective markers was used, including eight technical clusters strapped to the upper arm, forearm, thigh and shank. For details of the marker placement see Sandamas et al. (Citation2018). The athletes ran in their own spiked shoes. First step GRFs were recorded using a 0.6 m × 0.4 m force plate (Kistler 9281EA, AG Winterthur, Switzerland). Starting block forces were recorded using a custom-made starting block fitted with a Kistler force transducer (Kistler 9347B) beneath the footplate of each starting block. Both the starting block and first stance forces were collected at a sampling frequency of 1500 Hz. The force plate was also covered with the tartan surface, which was flush with the running surface, but with a gap of 2–3 mm separating them.
The sprinters were free to adjust the starting blocks to their own preferred block spacing and block obliquity. The mean (SD) inter-block spacing was 0.266 (0.041) m and the mean (SD) front and rear block obliquities were 51.7 (5.0)° and 54.4 (3.9)°.
Data processing
A 15 segment full-body model was created using Visual3D (C-Motion Inc, Germantown, MD, USA, v.6). The segments consisted of head, trunk, pelvis, upper arms, lower arms, hands, thighs, shanks and feet. The pelvis segment was the standard Visual 3D coda pelvis. The hip joint centre was defined according to Bell et al. (Citation1989). The knee and ankle joint centres were defined as the midpoint of the femoral epicondyles and malleoli, respectively. For further details of the model see Sandamas et al. (Citation2018).
The raw starting block signals were filtered at 50 Hz and the marker and force plate data were filtered at 12 Hz using a 4th-order low pass Butterworth filter in Visual3D. The cut-off frequency was determined using residual analysis (Winter, Citation2005). The marker and force plate data were filtered at the same frequency to prevent ground impact artefacts as inverse dynamics was performed in a separate study (Bezodis et al., Citation2013).
The pelvis segment angles were calculated with respect to the laboratory coordinate system using the ZXY Cardan rotation sequence in Visual3D. An upright standing static calibration pose was used to define the local coordinate system (LCS) of the pelvis. Since the LCS defined for the coda pelvis has approximately 20° downward (anterior) tilt when in the standing calibration pose position, the pelvic LCS was rotated in a positive direction about the mediolateral (z-axis) so that the anteroposterior axis (x-axis) is parallel with the ground (C-Motion) (). This gives a tilt angle of zero when standing in the calibration pose position. The hip joint angles were calculated with respect to the pelvis segment using the rotation sequence ZXY. This corresponds to rotations about the mediolateral, anterior and vertical axes, respectively.
Figure 1. The pelvic and thigh coordinate systems. The pelvic coordinate system was used for calculating the pelvis segment angles relative to the laboratory coordinate system. The thigh coordinate system was used to calculate the orientation of the rear thigh with respect to the pelvis.
The subsequent description of front and rear legs refers to the legs’ position whilst on the starting blocks. The block phase was divided into two sub-phases: double push (DP) and single push (SP). The key events that defined the phases are start, rear foot-off and block exit. The start event was defined as the moment the front or rear resultant block force–time curve exceeded 500 Ns−1 (Brazil et al., Citation2016). The single push phase was defined from the first frame the rear block resultant force dropped below 0 N to the first frame the front block resultant force also dropped below 0 N. The 1st stance phase was defined when the vertical ground reaction force exceeded 10 N (Rabita et al., Citation2015).
Step width was calculated as the mediolateral distance between the midpoint of the front foot metatarsal markers at the start event and the midpoint of the rear foot metatarsal markers at 1st stance toe-on (Otsuka et al., Citation2014; Sandamas et al., Citation2018). Step width was normalised by dividing by leg length (vertical coordinate of the hip joint centre, computed during the standing reference trial).
Since the main focus of pelvic motion for this study was pelvic motion before stance and since the peak pelvic angles in the frontal and transverse planes are reached before the end of the flight phase (Debaere et al., Citation2013), the pelvic range of motion (RoM) was defined as maximum pelvic angle before the end of the flight phase minus the corresponding minimum pelvic angle after the start event, for all three planes.
As explained in our previous work (Sandamas et al., Citation2018), average horizontal (anteroposterior) block power (PAHB) and average horizontal (1st stance) power (PAH) were calculated separately using the equations given by Bezodis et al. (Citation2010):
where m = participant mass, vfinal = final velocity, that is, anteroposterior velocity of the full-body centre of mass (CoM) at end of 1st stance phase, vinitial = CoM velocity at start of 1st contact phase, ∆t is the 1st stance contact time. Average horizontal block power (PAHB) was computed using EquationEquation 1(1)
(1) , but using initial and final CoM velocities of the block phase (note that vinitial = 0 at start of block phase), and ∆t is the block pushing time. All CoM velocities were calculated in Visual3D by taking the first derivative with respect to time of the position of the full-body model CoM.
Power was normalised to leg length using the following equation:
where g is the acceleration due to gravity and is the leg length. Normalised average horizontal block power (PNAHB) was computed similarly to EquationEquation 2
(2)
(2) , but with the PAHB as the numerator. The trial with the greatest normalised average horizontal block power (PNAHB) was used for the analyses.
Statistics
Statistical analysis was performed using IBM SPSS 24 (IBM Corp., NY, USA, v.25). The data were first tested for outliers, and then for normal distribution using the Shapiro–Wilk test. Pearson correlations were calculated for normally distributed data and Spearman’s rho was calculated for the non-normally distributed data. Correlations were considered very high for coefficient r > 0.90, high for 0.70 < r ≤ 0.89, moderate for 0.50 < r ≤ 0.69, low for 0.30 ≤ r 0.49 and trivial for 0.10 < r ≤ 0.29 (Hinkle et al., Citation2009). Statistical significance was considered at p < 0.05.
Results
With the exception of a slight anterior rotation during the flight phase, the pelvis became less anteriorly tilted throughout the start phase into a more upright orientation (). In the frontal plane, the pelvis listed rear side upwards until it reached a peak in the flight phase ( and ) after which the pelvis listed downwards towards the side of the swing leg. In the transverse plane, a small degree of front side forward pelvis rotation was seen during the DP phase for most athletes (). During the SP phase, the pelvis rotated rear side forwards for all athletes where it reached a peak and reversed direction prior to the flight phase. Front side forward pelvic rotation continued until the middle of the 1st stance ().
Figure 2. Pelvic segment angles from start to 1st stance toe-off (normalised to 100 points) in the sagittal (a), frontal (b) and transverse (c) and planes for all participants. The black line represents the group mean. The vertical lines represent (from left to right) the key events of rear foot-off, block exit and toe-on. The position of the vertical lines is approximately drawn for the group of athletes; 1st, 2nd, 3rd, 4th and 5th refer to the top five athletes ranked according to their PNAHB (). Ensemble group average rear leg hip angles with respect to the pelvis segment, Figure 2 (d). Positive hip angles represent hip flexion, abduction and internal rotation.
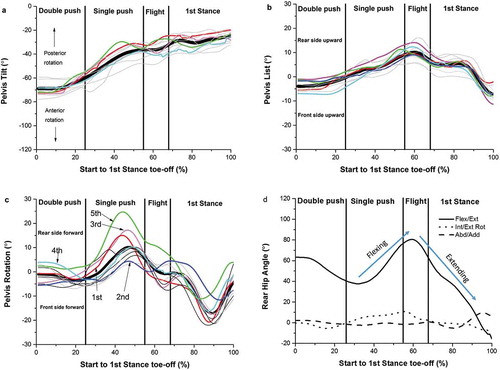
The largest changes in the rear leg hip joint angles were seen in the sagittal plane (). The group mean (SD) rear hip RoM from rear foot-off to the instant of peak pelvis list during the flight phase was: 43 (7)° flexion, 2 (7)° abduction and 7 (3)° internal rotation. The group mean (SD) hip joint angles at the instant of peak pelvis list were: of 82 (8.6)° flexion, 1.5 (4.4)° adduction and 5.2 (8.4)° internal rotation.
A very high positive correlation was found for the relationship between pelvic list RoM and 1st step width (r = 0.799, p = 0.003) (). No correlations were found for the relationships between pelvic rotation RoM and 1st step width nor pelvic tilt RoM and 1st step width ().
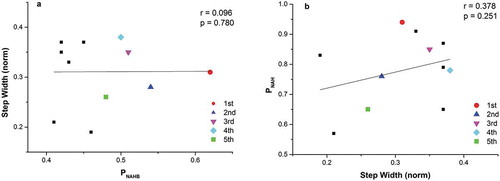
No significant correlations were found for the relationships between pelvic rotation RoM and PNAHB () nor for the relationships between step width and PNAHB (r = 0.096, p = 0.780) and between step width and PNAH (r = 0.378, p = 0.251) ().
Discussion
The first aim of this study was to ascertain if the medial thigh motion during the SP phase is primarily coupled to a combination of 3D pelvis rotations as opposed to just hip internal rotation and/or adduction of the swing leg. During the block and 1st flight phases both hip abduction/adduction and hip internal/external rotation were very small compared to the hip flexion/extension () for the swing leg. This indicates that it is pelvis motion and not simply hip adduction and/or hip internal rotation that is the primary kinematic reason that swing leg moves medially in front of the athlete during the single push phase. Since the primary cause of this posture was a combination of pelvis tilt, list and rotation, the 2nd aim was to investigate the relationships between pelvis RoM, step width and performance during the start phase of sprint running. No significant linear correlations were found for the relationships between pelvic tilt, list, and rotation RoM and performance, and no linear correlations were found for the relationships between step width and performance. Since the amount of pelvic motion did not correlate to performance (PNAHB), the coaching idea that medial thigh motion during the swing phase is detrimental to performance was not supported by this study.
The plots of the group mean pelvis segment angles as a function of time were similar to the graphs of the group mean pelvis segment angles illustrated by Debaere et al. (Citation2013). In contrast to Debaere et al. (Citation2013), the mean curves from each athlete’s individual trials are also displayed and so the variation between athletes can be observed. The greatest deviation from the group mean can be seen in the single push phase for pelvic rotation (). However, despite this variation, as the pelvic rotation RoM did not correlate with step width () nor performance (), it appears that the range of pelvic rotation observed in this study was not limiting performance.
Figure 4. Relationships between pelvic list (a), rotation (b) and tilt (c) RoM and normalised 1st step width. A high positive correlation was found for the relationship between pelvic list RoM and 1st step width (graph a); 1st, 2nd, 3rd, 4th and 5th refer to the top five athletes ranked according to their PNAHB.
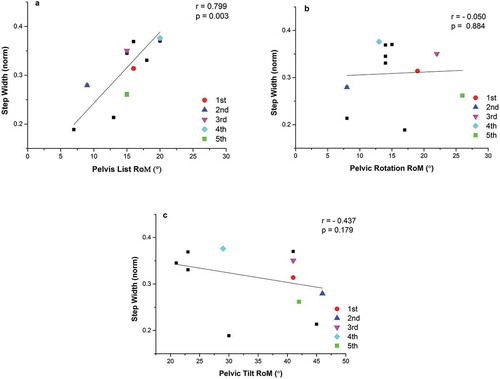
Figure 5. Relationships between pelvic list (a), rotation (b) and tilt (c) RoM and block phase performance; 1st, 2nd, 3rd, 4th and 5th refer to the top five athletes ranked according to their PNAHB.
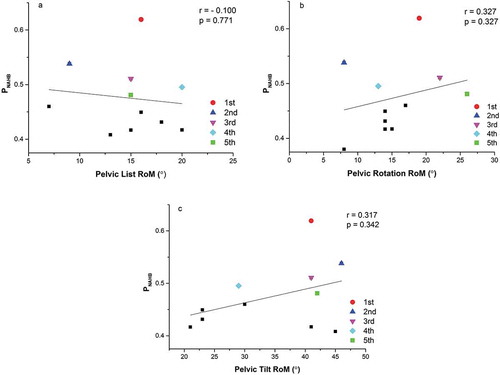
Figure 6. Relationships between normalised 1st step width and: block performance (a), and 1st stance performance (b). No linear correlations were found between these variables; 1st, 2nd, 3rd, 4th and 5th refer to the top five athletes ranked according to their PNAHB. NB as opposed to Figure 6(a), Figure 6(b) shows external power on the y-axis because during the 1st stance, step width was defined as the independent variable.
The only significant relationship found in this study was between pelvic list RoM and 1st step width. This would suggest that 1st step width reflected each athlete’s attempt of recovering from the position of maximum pelvic list, see for an example of this posture. Our previous study (Sandamas et al., Citation2018) found a strong positive correlation between mediolateral block impulses and 1st step width. This would suggest that pelvic list RoM could also reflect an athlete’s strategy of maximising the anterior impulse from the front leg whilst at the same time minimising any deleterious effects of the lateral motion of the CoM occurring during the SP phase until touchdown. The associated SW may form a strategy to halt the medial motion while simultaneously developing the anterior impulse.
Figure 3. Typical example of an athlete in the position of maximum pelvic list. Notice how the rear side pelvis is more upwards than the front side (a), and how medial orientation of the thigh accompanies pelvic orientation (b).
Despite the block start being a full-body activity, this study has focused on lower body kinematics and block power. Hinrichs (Citation1987) analysed angular momentum contributions of both upper and lower body segments in running and showed that upper body momentum was approximately equal and opposite to the lower body momentum in the transverse plane. Regulating the total body angular momentum in transverse plane will prevent the athlete from rotating away from the direction of the finishing line. Since vigorous arm action occurs during the block start (Korchemny, Citation1992), it is possible that the pelvic range of motion and the corresponding medial motion of the rear thigh during the block phase could also form part of a similar angular momentum balance. Other sporting activities that involve simultaneous and vigorous rotations of the arms and legs, for example, high jumping or vertical jumping, have seen that arm action can influence ground reaction forces and the motion of the athlete (Korchemny, Citation1992; Vaverka et al., Citation2016). Therefore, it is possible that the asymmetrical and vigorous arm action during the block phase could also have an effect on the magnitudes of pelvis list and rotation RoM and step width. Further studies would be required to test this hypothesis.
A limitation of this study is the number of participants. Ideally, the number of participants could have been greater. A possible source of error in calculating the segment orientations could have occurred from small differences in marker placement between participants (Kadaba et al., Citation1990). However, since segment RoM was used for the relationship testing these small differences in marker placement do not influence the results.
Conclusion
Firstly, it is a combination of pelvic rotation and pelvic list plus rear hip flexion rather than simply hip adduction or hip internal rotation that causes the swing leg to move medially in front of the body. Secondly, athletes with greater pelvic list RoM from the start to the 1st flight phase display a greater normalised 1st step width. However, since normalised 1st step width did not correlate with block power (PNAHB) nor 1st stance power (PNAH) and pelvic list, tilt or rotation RoM did not correlate with block power (PNAHB), this suggests that neither step width nor the amount of pelvic RoM is the discriminator of superior performance levels.
Advice for coaches
Changes in pelvis orientation and not simply hip adduction and/or hip internal rotation are what causes an athlete to adopt an awkward-looking posture whereby the swing leg moves medially in front of the body. Furthermore, since neither the amount of pelvic motion nor 1st step width during the start phase correlated to performance, the perception by some coaches that if the athlete adopts this awkward-looking posture during the block phase, it is detrimental to performance, was not supported by this study. Therefore, trying to reduce pelvic RoM or changing frontal and transverse plane hip joint angles to minimise the flailing leg motion is unlikely to lead to an improvement in performance.
Table 1. A comparison of each participant’s normalised block power (PNAHB), pelvic RoM, normalised 1st step width and normalised 1st stance power (PNAH). Their respective group ranking for PNAHB is also given.
Acknowledgments
The authors are grateful to Fredrik Tinmark and Olga Tarrassova at GIH for their assistance with the empirical data collection and Torbjörn Eriksson at Svensk Friidrott for allowing his elite sprinters to participate in this study.
Disclosure statement
The authors report no conflict of interest.
Additional information
Funding
References
- Bell, A. L., Brand, R. A., & Pedersen, D. R. (1989). Prediction of hip joint centre location from external landmarks. Human Movement Science, 8(1), 3–16. https://doi.org/10.1016/0167-9457(89)90020-1
- Bezodis, N. E., Salo, A. I., & Trewartha, G. (2010). Choice of sprint start performance measure affects the performance-based ranking within a group of sprinters: Which is the most appropriate measure? Sports Biomechanics, 9(4), 258–269. https://doi.org/10.1080/14763141.2010.538713
- Bezodis, N. E., Salo, A. I., & Trewartha, G. (2013). Excessive fluctuations in knee joint moments during early stance in sprinting are caused by digital filtering procedures. Gait & Posture, 38(4), 653–657. https://doi.org/10.1016/j.gaitpost.2013.02.015
- Bezodis, N. E., Salo, A. I. T., & Trewartha, G. (2015). Relationships between lower-limb kinematics and block phase performance in a cross section of sprinters. European Journal of Sport Science, 15(2), 118–124. https://doi.org/10.1080/17461391.2014.928915
- Brazil, A., Exell, T., Wilson, C., Willwacher, S., Bezodis, I., & Irwin, G. (2016). Lower limb joint kinetics in the starting blocks and first stance in athletic sprinting. Journal of Sports Sciences, 35(16), 1629–1635. https://doi.org/10.1080/02640414.2016.1227465
- Coh, M., Jost, B., Skof, B., Tomazin, K., & Dolenec, A. (1998). Kinematic and kinetic parameters of the sprint start and start acceleration model of top sprinters. Gymnica, 28(33), 42.
- Debaere, S., Delecluse, C., Aerenhouts, D., Hagman, F., & Jonkers, I. (2013). From block clearance to sprint running: Characteristics underlying an effective transition. Journal of Sports Sciences, 31(2), 137–149. https://doi.org/10.1080/02640414.2012.722225
- Hinkle, D. E., Jurs, S. G., & Wiersma, W. (2009). Applied statistics for the behavioral sciences. Wadsworth.
- Hinrichs, R. (1987). Upper Extremity Function in Running. II: Angular momentum considerations. International Journal of Sport Biomechanics. 3, 242–263.
- Ito, A., Ishikawa, M., Isolehto, J., & Komi, P. V. (2006). Changes in the step width, step length, and step frequency of the world’s top sprinters during the 100 metres. New Studies in Athletics, 21(3), 35–39.
- Jessop, D. (2011). Computer simulation of the sprint start [Doctoral dissertation]. https://repository.lboro.ac.uk/articles/Computer_simulation_of_the_sprint_start/9608660.
- Kadaba, M. P., Ramakrishnan, H. K., & Wooten, M. E. (1990). Measurement of lower extremity kinematics during level walking. Journal of Orthopaedic Research, 8(3), 383–392. https://doi.org/10.1002/jor.1100080310
- Korchemny, R. (1992). A new concept for sprint start and acceleration training. New Studies in Athletics, 7(4), 65–72.
- Mero, A., Luhtanen, P., & Komi, P. V. (1983). A biomechanical study of the sprint start. Scandinavian Journal of Sports Sciences, 5(1), 20–28.
- Nagahara, R., Matsubayashi, T., Matsuo, A., & Zushi, K. (2018). Kinematics of the thorax and pelvis during accelerated sprinting. Journal of Sports Medicine and Physical Fitness, 58(9), 1253–1263. https://doi.org/10.23736/S0022-4707.17.07137-7
- Nagahara, R., Mizutani, M., Matsuo, A., Kanehisa, H., & Fukunaga, T. (2017). Association of step width with accelerated sprinting performance and ground reaction force. International Journal of Sports Medicine, 38(7), 534–540. https://doi.org/10.1055/s-0043-106191
- Otsuka, M., Shim, J. K., Kurihara, T., Yoshioka, S., Nokata, M., & Isaka, T. (2014). Effect of expertise on 3D force application during the starting block phase and subsequent steps in sprint running. Journal of Applied Biomechanics, 30(3), 390–400. https://doi.org/10.1123/jab.2013-0017
- Rabita, G., Dorel, S., Slawinski, J., Saez-de-Villarreal, E., Couturier, A., Samozino, P., & Morin, J. B. (2015). Sprint mechanics in world-class athletes: A new insight into the limits of human locomotion. Scandinavian Journal of Medicine and Science in Sports, 25(5), 583–594. https://doi.org/10.1111/sms.12389
- Sandamas, P., Gutierrez-Farewik, E. M., & Arndt, A. (2018). The effect of a reduced first step width on starting block and first stance power and impulses during an athletic sprint start. Journal of Sports Sciences, 37(9), 1046–1054. https://doi.org/10.1080/02640414.2018.1541161
- Slawinski, J., Bonnefoy, A., Ontanon, G., Leveque, J. M., Miller, C., & Riquet, A. (2010). Segment-interaction in sprint start: Analysis of 3D angular velocity and kinetic energy in elite sprinters. Journal of Biomechanics, 43(8), 1494–1502. https://doi.org/10.1016/j.jbiomech.2010.01.044
- Slawinski, J., Dumas, R., Cheze, L., Ontanon, G., Miller, C., & Mazure-Bonnefoy, A. (2013). Effect of postural changes on 3D joint angular velocity during starting block phase. Journal of Sports Sciences, 31(3), 256–263. https://doi.org/10.1080/02640414.2012.729076
- Vaverka, F., Jandačka, D., Zahradník, D., Uchytil, J., Farana, R., Supej, M., & Vodičar, J. (2016). Effect of an arm swing on countermovement vertical jump performance in elite volleyball players. Journal of Human Kinetics, 53(1), 41–50. https://doi.org/10.1515/hukin-2016-0009
- C-Motion. https://www.c-motion.com/v3dwiki/index.php?title=SegmentExamples_5.
- Willwacher, S., Herrmann, V., Heinrich, K., Funken, J., Strutzenberger, G., Goldmann, J. P., & Brüggemann, G.-P. (2016). Sprint start kinetics of amputee and non-amputee sprinters. PLoS One, 11(11), 1–18. https://doi.org/10.1371/journal.pone.0166219
- Winter, D. A. (2005). Biomechanics and motor control of human movement. John Wiley and Sons.