
ABSTRACT
Overuse injuries are a common problem to triathletes’ population. Overuse injuries may arise from inter-limb biomechanical differences during running, but the literature lacks information regarding inter-limb differences in triathletes. In this study inter-limb differences were investigated in injury-free triathletes during the running portion of a simulated cycle-run transition. Thirteen triathletes performed a 5 km run preceded by a 20 min cycling trial at 70% of maximal power output. During the Start, Mid and End stages of running, kinetic, kinematic and muscle activation variables were compared between the preferred and non-preferred limbs across the stance phase. A statistical parametric mapping analysis showed no differences between limbs when considering kinetic and kinematic variables (p > 0.05, ES<0.60). A lower soleus activation was observed in the preferred limb (p < 0.05, ES>0.60) from 53.40–75.9% of the stance phase at the End stage of running. In conclusion, inter-limb differences in kinetic or kinematic variables may not represent a risk for overloading in triathletes. However, inter-limb differences in triceps surae activation during running after cycling may represent one potential factor leading to overuse injuries in triathletes and should be further investigated.
Introduction
Lower limb overuse injuries are among the most prominent in triathletes (Gosling et al., Citation2008; Vleck & Garbutt, Citation1998) and running has a stronger association with lower limb injury incidence than cycling or swimming in triathlon (Vleck & Garbutt, Citation1998). Overloading is one important factor in the development of overuse injuries (Magnusson et al., Citation2010), and previous research on the association between biomechanical variables and overuse injuries has been conducted in runners (Becker et al., Citation2017; Van Ginckel et al., Citation2009). However, findings on runner’s biomechanics should not be translated to triathletes since during triathlon the running segment is preceded by a cycling trial.
Biomechanical inter-limb differences have been previously investigated during running and cycling (Carpes et al., Citation2010; Sadeghi et al., Citation2000). The relevance of investigating biomechanical inter-limb differences relies on the assumption that inter-limb biomechanical differences may potentially result in overloading of muscle-tendon components due to the systematic exposition of one limb to greater external loadings, strains and stresses. Thus, the systematic exposition of triathletes to inter-limb biomechanical differences may be an aetiological factor in the high incidence of overuse injuries in triathletes. However, possible inter-limb differences occurring during running have not previously been investigated in this population.
Tendons are a common site of overuse injuries in triathletes (Gosling et al., Citation2008; Vleck & Garbutt, Citation1998). Previous studies have observed associations between biomechanical variables during the stance phase of running with the occurrence of tendon overuse injuries (Azevedo et al., Citation2009; Baur et al., Citation2011; Davis et al., Citation2016; Donoghue, Harrison, Coffey et al., Citation2008; Donoghue, Harrison, Laxton et al., Citation2008; Van Ginckel et al., Citation2009; Wyndow et al., Citation2013). Parameters relating to ground reaction forces (GRF) (Davis et al., Citation2016), knee (Azevedo et al., Citation2009; Donoghue, Harrison, Coffey et al., Citation2008) and ankle joint kinematics (Donoghue, Harrison, Coffey et al., Citation2008; Donoghue, Harrison, Laxton et al., Citation2008), centre of pressure anterior-posterior displacement (COPA-P) (Van Ginckel et al., Citation2009), and muscle activation (Baur et al., Citation2011; Wyndow et al., Citation2013) were observed in runners that sustained or developed tendon overuse injuries. Furthermore, excessive strain has been suggested to induce structural damage within tendon tissue (Ros et al., Citation2019; Wren et al., Citation2003), which may lead to overuse injury development.
Studies investigating inter-limb differences during running often assume that differences may exist at specific time points [zero dimensional (0d) metrics] (Brown et al., Citation2014; Karamanidis et al., Citation2003; Pappas et al., Citation2015; Radzak et al., Citation2017). Furthermore, previous studies on triathletes observed that cycling induced alterations in hip, knee and ankle kinematics, (Bonacci, Blanch et al., Citation2010; Bonacci, Green et al., Citation2010; Rendos et al., Citation2013), kinetics (e.g., spring-mass behaviour) (Le Meur et al., Citation2012), and neuromuscular parameters (Le Meur et al., Citation2012) during subsequent running. Unfortunately, those studies investigated only a single limb using 0d biomechanical data. Similarly, studies observing associations between biomechanical variables and tendon overuse injuries also adopted 0d metrics (Azevedo et al., Citation2009; Baur et al., Citation2011; Davis et al., Citation2016; Donoghue, Harrison, Coffey et al., Citation2008; Donoghue, Harrison, Laxton et al., Citation2008; Van Ginckel et al., Citation2009; Wyndow et al., Citation2013). However, to the best of our knowledge i) there is limited support for the adoption of 0d metrics when investigating inter-limb differences during running in injury-free individuals, ii) there is no evidence for stating at which time point during the stance phase of running inter-limb differences are most relevant and iii) there is a dearth of research regarding inter-limb differences in injury-free triathletes when running after cycling.
Therefore, the present study aimed to investigate inter-limb differences in biomechanical variables previously associated to overuse injuries during running preceded by cycling in a group of injury-free competitive triathletes. The identification of inter-limb differences may guide coaches and clinicians in developing procedures to minimize excessive external and internal loads in triathletes when running after cycling. Due to the aforementioned lack of evidence for the adoption of 0d metrics on inter-limb differences during running, time-series data from the entire stance phase were analysed by employing a statistical parametric mapping approach (SPM) (Pataky et al., Citation2013).
Material and methods
Participants
Thirteen male competitive triathletes (mean ± SD = 34 ± 5.7 years; 177.6 ± 3.8 cm; 72.9 ± 7.0 kg) participated in this study after giving informed consent. The study was approved by the Stockholm Regional Ethics Committee and followed the Declaration of Helsinki ethical guidelines. The triathletes reported no history of lower limb injury in the six months prior to testing and limb preference was assessed by a footedness questionnaire (Elias et al., Citation1998).
Experimental setup
Triathletes were asked to avoid high intensity training during the 24 hours preceding testing. During their first visit to the laboratory, triathletes performed a maximal cycling test for determination of maximal power output (POMAX). The cycling POMAX protocol began with a workload of 150 watts (W) increasing with 25 W per minute. The pedalling cadence was maintained at 90 ± 2 rpm by using feedback provided by the cycle-ergometer head unit (LC7, Monark Exercise AB, Sweden). The triathletes pedalled until they reached volitional exhaustion or until they could not maintain the target pedalling cadence. The last finished workload stage was regarded as each triathlete’s POMAX. One week after their first visit to the laboratory, triathletes performed a simulated cycle-run transition consisting of a 10 min warm-up at 150 W followed by the cycle-run transition simulation. The cycle-run simulation consisted of a 20 min cycling trial at 70% of POMAX on a cycle-ergometer (LC7, Monark Exercise AB, Sweden) immediately followed by a 5 km run on a motorized treadmill (RL2500E, Rodby Innovation AB, Sweden). The transition from cycling to running was conducted as fast as possible to mimic race conditions. Triathletes were not informed about their actual speed but were allowed to increase or decrease the treadmill speed in order to achieve their preferred race-pace.
Passive reflective markers were placed on anatomical landmarks on the torso, pelvis and lower limbs. Torso markers were placed on the spinal process of the C7 vertebrae and on the right and left acromion. Pelvis markers were placed on the right and left anterior and posterior superior iliac spines. Lower limb markers were placed bilaterally on the medial and lateral epicondyles of the femur, medial and lateral malleoli, the 1st and 5th metatarsophalangeal joints and on the calcaneus. Four rigid clusters of four non-collinear reflective tracking markers were strapped bilaterally to the thigh and shank. The 3-D coordinates of the reflective markers were registered at 300 Hz during running by a twelve-camera motion analysis system (Oqus 4-series, Qualisys AB, Sweden). A static trial was conducted in order to register the triathletes’ anatomical position immediately before the start of the 5 km run. The static trial was performed in order to scale a musculoskeletal model (Rajagopal et al., Citation2016) composed of feet, shanks, thighs, pelvis and torso to each participant’s anthropometrical characteristics following standard procedures in OpenSim 3.3 (Delp et al., Citation2007). After scaling, each triathlete’s musculoskeletal model and 3-D coordinates recorded from running were used as input for the Inverse Kinematics tool in OpenSim. Bilateral generalized coordinates in the sagittal plane for the hip, knee and ankle joints were provided by the inverse kinematics analysis. The lengths of the MG, SOL, and TA series elastic elements, here referred to as SOL, MG and TA tendon lengths respectively, were computed using the Analysis tool in OpenSim based on each triathletes’ muscle-tendon paths defined during the scaling procedure together with the knee and ankle joint kinematics from the inverse kinematics analysis.
The GRF was registered bilaterally during running by a pressure measuring insole system (Pedar®, Novel GmbH, Germany) sampling at 100 Hz placed in the triathletes’ running shoes. The MG, LG, SOL and TA activations were registered at 3000 Hz bilaterally during running by a wireless electromyography (EMG) system (TeleMyo 2400 R G2, Noraxon Inc., USA). The triathletes’ skin was carefully shaved and cleaned with alcohol swabs to reduce skin impedance prior to electrode placement. Bipolar surface electrodes (Neuroline 720, Ambu Inc., Denmark) were placed parallel to the muscle fibres over the mid-belly of the MG, LG, SOL and TA muscles with an inter-electrode distance of 20 mm. The EMG procedures were conducted according to SENIAM recommendations (Hermens et al., Citation2000). All systems were synchronized by an analogue pulse sent from the QTM® software (Qualisys AB, Sweden) to the EMG and pressure insole systems. Data were sampled for 30 seconds at the Start, Mid and End stages of the 5 km run (i.e. at 0.5 km, 2.5 km and 4.8 km, respectively).
Joint kinematics and tendon lengths were filtered using a 3rd order low pass IIR Butterworth filter with a cut-off frequency of 10 Hz in OpenSim. GRF data were filtered using a 2nd order low pass Butterworth filter with a cut-off frequency of 10 Hz and then up-sampled to 300 Hz by a Fast Fourier Transform (FFT) interpolation method to improve data resolution. EMG signals were filtered using a 5th order band-pass Butterworth filter with a cut-off frequency of 20–500 Hz and the root mean squared (RMS) envelopes were subsequently computed for eleven subjects (two triathletes were excluded from the analysis due to excessive noise to signal ratio in the EMG signals). Touch-down and toe-off were determined using a 50 N threshold (Becker et al., Citation2017). The average of ten complete stance phases (e.g., touch-down to toe-off) were adopted as representative of each limb in each running stage. The stance phase was normalized to 100 data points for all variables. GRF was normalized to body weight (Wb), EMG was normalized to the peak RMS value (%RMSpeak) found between running stages, and tendon strain was calculated as percentage of tendon length at the standing position reference trials (%Lengthslack). Asymmetries were calculated for the whole stance phase as the absolute difference between limbs. Data analysis was performed with customized scripts developed in Matlab® (v2017b, MathWorks Inc., USA).
Statistical analysis
The assumption of data normality was verified prior to comparing limbs using paired samples t-tests in each running stage. Repeated measures (RM) ANOVA were employed for testing the effect of running stage on asymmetry level (Supplement 1) and on running speed. Bonferroni corrections were conducted in the case of differences occurring between stages when the RM ANOVA indicated a p < 0.05. Cohen’s d Effect sizes [(ES) (Cohen, Citation1988)] were computed for the entire stance phase of running and their magnitude was interpreted as follows: <0.2, trivial; 0.2 to <0.6, small; 0.6 to 1.2, moderate; >1.2, large (Hopkins et al., Citation2009). Results were discussed when p < 0.05 and a moderate or greater effect was observed. The SPM analysis was performed using the open-source spm1d statistical package (www.spm1d.org) for Matlab®.
Results
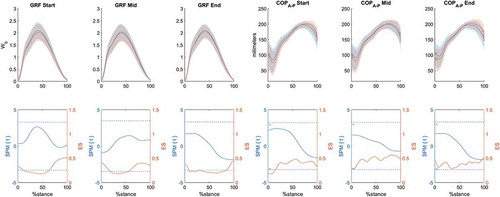
Mean power output during the cycling stage was 235 (35) W and the mean 5 km running time was 20.4 (2.4) minutes. The mean running speed was 14.4 (1.8), 15.2 (4.8) and 15.5 (2.7) km.h−1 in the Start, Mid and End stages respectively. Running speed significantly increased from Start to Mid (p = 0.03, ES = 0.93), and Start to End stage (p = 0.03, ES = 0.94). No differences between limbs were observed in GRF (Wb) or COPA-P towards the stance phase (). GRF (Wb) and COPA-P SPM{t} mean values during stance at each stage were 1.1, 0.63, 0.05 and 0.82, 0.47, 0.05 respectively. ES mean values during stance at each stage were 0.30, 0.29, 0.25 and 0.38, 0.47, 0.38, for GRF (Wb) and COPA-P respectively.
Figure 1. GRF and COPA-P mean ±1 standard deviation (shaded areas) values for the preferred (solid blue line, upper panels) and non-preferred limb (solid orange line, upper panels) at each running stage (Start, Mid, End). Respective SPM{t} and ES analysis are presented below each GRF and COPA-P panels. SPM{t} = solid blue lines; t threshold = blue dashed lines; ES = solid orange lines
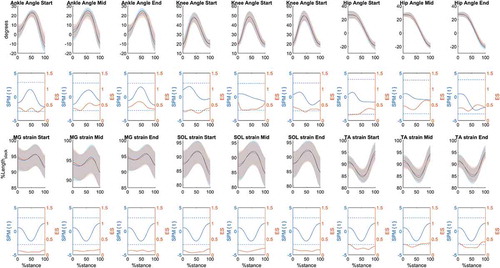
No differences were observed in joint or tendon kinematics during the stance phase between limbs at any stage (). Ankle angle SPM{t} and ES mean values during stance at each stage were −0.27, 0.16, 0.22 (SPM{t}), 0.34, 0.44, 0.47 (ES); knee angle values were 0.66, −0.07, −0.36 (SPM{t}), 0.30, 0.39, 0.35 (ES); and hip angles values −0.40, −0.17, −1.37 (SPM{t}), 0.27, 0.48, 0.40 (ES). SPM{t} and ES mean values for MG, SOL and TA tendon strain during stance at each running stage were −0.39, 0.15, 0.26 (SPM{t}), 0.10, 0.13, 0.13 (ES); −0.18, 0.16, 0.25 (SPM{t}), 0.10, 0.14, 0.14 (ES), 0.15, −0.13, −0.24 and (SPM{t}), 0.22, 0.31, 0.29 (ES) respectively.
Figure 2. Joint and tendon kinematics mean ±1 standard deviation (shaded areas) values for the preferred (solid blue line) and non-preferred (solid orange line) limb at each running stage (Start, Mid, End). Respective SPM{t} and ES analysis are presented below each joint and tendon kinematics panel. SPM{t} = solid blue lines; t threshold = blue dashed lines; ES = solid orange lines
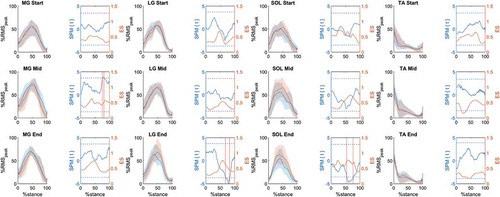
SPM{t} mean values for muscle activation comparisons across the stance at each running stage were 0.46, 1.8, 1.13 (MG), 0.21, −0.10, −0.52 (LG), <0.01, −0.75, −2.29 (SOL), 0.39, 0.78, 1.02 (TA). Mean ES during stance at each stage were 0.43, 0.47, 0.52 (MG), 0.41, 0.37, 0.45 (LG), 0.55, 0.49, 0.61 (SOL), 0.47, 0.41, 0.28 (TA) (). A greater MG activation in the P limb (p = 0.0153) was observed at Mid stage from 75.24 to 80.78% of stance, although with an ES of small magnitudes (ES ranged from 0.41 to 0.51) (). A lower activation of LG EMG (p < 0.001) in the P limb was observed at the End stage from 67.75 to 82.66% of stance, although of small magnitude (ES ranged from 0.39 to 0.58) (). A lower activation of SOL EMG (p < 0.001) in the P limb was observed at the End stage from 53.40 to 75.89% of stance showing small to moderate magnitude (ES ranged from 0.59 to 0.80) ().
Figure 3. Medial gastrocnemius (MG), lateral gastrocnemius (LG), soleus (SOL) and tibialis anterior (TA) mean ±1 standard deviation (shaded areas) values for the preferred (solid blue line) and non-preferred limb (solid orange line) at each running stage (Start, Mid, End). Respective SPM{t} and ES analysis are presented beside each muscle activation panel. SPM{t} = solid blue lines; t threshold = blue dashed lines; ES = solid orange lines. Vertical red lines indicate the portion of stance phase in which p < 0.05
Discussion
In this study inter-limb differences in GRF, COPAA-P, lower limb kinematics, tendon strain and muscle activation were investigated during the stance phase of running after cycling in a group of injury-free triathletes. Running speed increased from the Start to Mid, and from Start to End stages. However, no differences were observed in kinetics or kinematics between the preferred and non-preferred limbs or in the asymmetry level (Supplement 1) across stages. SOL activation was lower in the preferred limb compared to the non-preferred limb after 53.4% of the stance phase at the End stage of running. Results from GRF values were slightly lower than previously reported for treadmill running (Kram et al., Citation1998), which may have been due to treadmill damping or drift occurring in the pressure insole sensors (Hurkmans et al., Citation2006). Joint kinematic results were in line with prior studies during running at similar speeds (Orendurff et al., Citation2018), and this also applied for to the simulated tendon kinematics from a musculoskeletal model during running (Lai et al., Citation2018). Muscle activation patterns were similar to those reported for triceps surae muscles during running after cycling at comparable cycling and running intensities (Le Meur et al., Citation2012).
Hip (Rendos et al., Citation2013), knee (Bonacci, Blanch et al., Citation2010) and ankle kinematics (Bonacci, Green et al., Citation2010) have been reported to be altered when running after cycling when compared to a run without prior cycling. The reported effects of cycling on subsequent running have been attributed to triathletes’ experience or training level (Bonacci, Blanch et al., Citation2010; Bonacci, Green et al., Citation2010; Rendos et al., Citation2013). The relative cycling power output from triathletes in our study (3.26 W.kg−1) was close to that reported for elite level triathletes (3.6 to 3.9 W.kg−1) (Bernard et al., Citation2009; Etxebarria et al., Citation2014). The mean cycling power output in the present study (236 ± 35 W) was also close to that reported for elite triathletes during competitions (230 ± 53 W to 252 ± 33 W) (Bernard et al., Citation2009; Etxebarria et al., Citation2014). The running performance (duration = ~20 min, speed = ~15 km.h−1) was comparable to the ~17 min performance on a 5 km run without a preceding cycling trial in regional to national level triathletes (Girard et al., Citation2013). Running speed in the present study (14.4, 15.2 and 15.5 km.h−1 at Start, Mid and End stages respectively) is comparable to that of well-trained triathletes running to exhaustion (~15.7 km.h−1) for a shorter time (~15 min) (Le Meur et al., Citation2012). Inter-limb differences in running mechanics that are dependent on kinetics and kinematics have been observed to occur at speeds above 18 km.h−1 (Dalleau et al., Citation1998; Exell et al., Citation2017; Girard et al., Citation2017). The adoption of a preferred pace (~15 km.h−1) during the whole 5 km run by triathletes in this study may therefore have limited the occurrence of inter-limb differences in kinetics and kinematics previously observed at faster running speeds (Dalleau et al., Citation1998; Exell et al., Citation2017; Girard et al., Citation2017).
A reduction in SOL activation amplitude in the preferred limb was observed at the End stage of running. This finding is partially supported by previous findings of a reduced SOL EMG amplitude at the end of a cycle-run transition (Le Meur et al., Citation2012). Regarding the lower activation in the preferred limb, previous studies observed that one limb has a preferential role in propulsion than the other during different supporting tasks and locomotion (Chavet et al., Citation1997; Dalleau et al., Citation1998; Sadeghi et al., Citation1997). Furthermore, a greater SOL activation in the dominant limb and an association between neural drive and limb dominance has previously been reported during walking (Õunpuu & Winter, Citation1989). Due to the bi- (e.g., MG and LG) and uni-articular (SOL) characteristics of triceps surae muscles, a possible greater mechanical demand on SOL compared to LG or MG may occur during running. For example, a greater activation of SOL has been described as a neuromuscular strategy to overcome a lower MG activation when knee flexion induces shorter fascicle lengths in this muscle (Lauber et al., Citation2014). Thus, it is possible that the triathletes’ preferred limb may have played a propulsive role throughout the whole cycle-run protocol, thus placing a greater mechanical demand on SOL and explaining the observed reduced SOL activation in that limb. However, although of small magnitude, LG activation was also lower in the preferredlimb in a similar range of the stance phase as observed for SOL (), implying that a cycle-run transition may induce inter-limb neuromuscular alterations in other triceps surae muscles than only in SOL. Further studies should be conducted to confirm these suggested effects of limb preference and the bi and uniarticular characteristics of triceps surae muscles on their neuromuscular profiles during running after cycling.
The absence of kinetic and kinematic inter-limb differences suggests no differences in the external loading experienced by each limb, implying that the observed difference in SOL activation between limbs was not driven by external loading. However, external loading is not a good predictor of internal loading (Matijevich et al., Citation2019; Scott & Winter, Citation1990). Triceps surae force production has been suggested to result in non-homogenous forces, displacements and strains within the Achilles tendon (Arndt et al., Citation1998; Franz & Thelen, Citation2015; Froberg et al., Citation2017; Lersch et al., Citation2012), which in combination with the results from this study may indicate possible differences in Achilles tendon loading, displacements and strains between limbs. Inter-limb differences in SOL activation systematically occurring after mid stance and beginning of push off when the Achilles tendon experiences its peak forces (Scott & Winter, Citation1990), might increase chances of muscle or tendon overloading in triathletes, thus increasing injury risk.
This study is not without limitations. Fatigue levels were not directly assessed and future studies should address the effects of fatigue on triathletes’ inter-limb differences during cycle-run trials. A high risk of overuse injuries remains elusive when assumptions are based only on inter-limb differences in muscle activation, while inter-limb differences in variables related to external loading limit direct association to internal loading. Furthermore, strains estimated from musculoskeletal models provide only an approximation of the real strain experienced by muscle-tendon components, and thus inter-limb differences in strain should be further investigated during running by direct measurements such as ultrasonography (Aeles & Vanwanseele, Citation2019). Finally, the findings in this study may not have been revealed if 0d metrics were adopted, and therefore inter-limb differences in injury free individuals should be further investigated by 1d analysis. As a practical application coaches and clinicians should implement plantar flexor strength training protocols aiming to prevent the occurrence of inter-limb differences in triceps surae activations during running after cycling.
In conclusion, inter-limb differences in kinetic and kinematic variables were not observed in triathletes during running after cycling and thus might not represent a risk for overloading in this population. However, within the experimental conditions of this study, inter-limb differences in triceps surae activation were observed. These may represent a possible factor leading to overloading and therefore a possible link to the high rates of overuse injuries in triathletes. Triathletes might benefit from bilateral neuromuscular monitoring and strength training during the training season to minimize overload-related injuries in the triceps surae muscle-tendon complex.
Supplemental Material
Download PDF (381.5 KB)Disclosure statement
No potential conflict of interest was reported by the authors.
SUPPLEMENTAL DATA
Supplemental data for this article can be accessed online https://doi.org/10.1080/02640414.2020.1809176.
Additional information
Funding
References
- Aeles, J., & Vanwanseele, B. (2019). Do stretch-shortening cycles really occur in the medial gastrocnemius? A detailed bilateral analysis of the muscle-tendon interaction during jumping. Frontiers in Physiology, 10, 1504. https://doi.org/10.3389/fphys.2019.01504
- Arndt, A., Komi, P. V., Bruggemann, G.-P., & Lukkariniemi, J. (1998). Individual muscle contributions to the in vivo achilles tendon force. Clinical Biomechanics, 13(7), 532. https://doi.org/10.1016/S0268-0033(98)00032-1
- Azevedo, L. B., Lambert, M. I., Vaughan, C. L., O’connor, C. M., & Schwellnus, M. P. (2009). Biomechanical variables associated with Achilles tendinopathy in runners. British Journal of Sports Medicine, 43(4), 288. https://doi.org/10.1136/bjsm.2008.053421
- Baur, H., Muller, S., Hirschmuller, A., Cassel, M., Weber, J., & Mayer, F. (2011). Comparison in lower leg neuromuscular activity between runners with unilateral mid-portion Achilles tendinopathy and healthy individuals. Journal of Electromyography and Kinesiology, 21(3), 499. https://doi.org/10.1016/j.jelekin.2010.11.010
- Becker, J., James, S., Wayner, R., Osternig, L., & Chou, L.-S. (2017). Biomechanical factors associated with achilles tendinopathy and medial tibial stress syndrome in runners. American Journal of Sports Medicine, 45(11), 2614. https://doi.org/10.1177/0363546517708193
- Bernard, T., Hausswirth, C., Le Meur, Y., Bignet, F., Dorel, S., & Brisswalter, J. (2009). Distribution of power output during the cycling stage of a Triathlon World Cup. Medicine & Science in Sports & Exercise, 41(6), 1296. https://doi.org/10.1249/MSS.0b013e318195a233
- Bonacci, J., Blanch, P., Chapman, A. R., & Vicenzino, B. (2010). Altered movement patterns but not muscle recruitment in moderately trained triathletes during running after cycling. Journal of Sports Sciences, 28(13), 1477. https://doi.org/10.1080/02640414.2010.514279
- Bonacci, J., Green, D., Saunders, P. U., Blanch, P., Franettovich, M., Chapman, A. R., & Vicenzino, B. (2010). Change in running kinematics after cycling are related to alterations in running economy in triathletes. Journal of Science and Medicine in Sport, 13(4), 460. https://doi.org/10.1016/j.jsams.2010.02.002
- Brown, A. M., Zifchock, R. A., & Hillstrom, H. J. (2014). The effects of limb dominance and fatigue on running biomechanics. Gait & Posture, 39(3), 915. https://doi.org/10.1016/j.gaitpost.2013.12.007
- Carpes, F. P., Mota, C. B., & Faria, I. E. (2010). On the bilateral asymmetry during running and cycling – A review considering leg preference. Physical Therapy in Sport, 11(4), 136. https://doi.org/10.1016/j.ptsp.2010.06.005
- Chavet, P., Lafortune, M. A., & Gray, J. R. (1997). Asymmetry of lower extremity responses to external impact loading. Human Movement Science, 16(4), 391. https://doi.org/10.1016/S0167-9457(96)00046-2
- Cohen, J. (1988). Statistical power analysis for the behavioral sciences, L. Erlbaum Associates.
- Dalleau, G., Belli, A., Bourdin, M., & Lacour, J.-R. (1998). The spring-mass model and the energy cost of treadmill running. European Journal of Applied Physiology, 77(3), 257. https://doi.org/10.1007/s004210050330
- Davis, I. S., Bowser, B. J., & Mullineaux, D. R. (2016). Greater vertical impact loading in female runners with medically diagnosed injuries: A prospective investigation. British Journal of Sports Medicine, 50, 887-892. http://dx.doi.org/10.1136/bjsports-2015-094579
- Delp, S. L., Anderson, F. C., Arnold, A. S., Loan, P., Habib, A., John, C. T., Guendelman, E., & Thelen, D. G. (2007). OpenSim: Open-source software to create and analyze dynamic simulations of movement. IEEE Transactions on Biomedical Engineering, 54(11), 1940. https://doi.org/10.1109/TBME.2007.901024
- Donoghue, O. A., Harrison, A. J., Coffey, N., & Hayes, K. (2008). Functional data analysis of running kinematics in chronic Achilles tendon injury. Medicine & Science in Sports & Exercise, 40(7), 1323. https://doi.org/10.1249/MSS.0b013e31816c4807
- Donoghue, O. A., Harrison, A. J., Laxton, P., & Jones, R. K. (2008). Lower limb kinematics of subjects with chronic achilles tendon injury during running. Research in Sports Medicine, 16(1), 23. https://doi.org/10.1080/15438620701693231
- Elias, L. J., Bryden, M. P., & Bulman-Fleming, M. B. (1998). Footedness is a better predictor than is handedness of emotional lateralization. Neuropsychologia, 36(1), 37. https://doi.org/10.1016/S0028-3932(97)00107-3
- Etxebarria, N., D’auria, S., Anson, J. M., Pyne, D. B., & Ferguson, R. A. (2014). Variability in power output during cycling in international Olympic-distance triathlon. International Journal of Sports Physiology and Performance, 9(4), 732. https://doi.org/10.1123/ijspp.2013-0303
- Exell, T., Irwin, G., Gittoes, M., & Kerwin, D. (2017). Strength and performance asymmetry during maximal velocity sprint running. Scandinavian Journal of Medicine & Science in Sports, 27(11), 1273. https://doi.org/10.1111/sms.12759
- Franz, J. R., & Thelen, D. G. (2015). Depth-dependent variations in Achilles tendon deformations with age are associated with reduced plantarflexor performance during walking. Journal of Applied Physiology, 119 (3), 242. (1985). https://doi.org/10.1152/japplphysiol.00114.2015
- Froberg, Å., Cisse, A.-S., Larsson, M., Martensson, M., Peolsson, M., Movin, T., & Arndt, A. (2017). Altered patterns of displacement within the Achilles tendon following surgical repair. Knee Surgery, Sports Traumatology, Arthroscopy, 25(6), 1857. https://doi.org/10.1007/s00167-016-4394-5
- Girard, O., Brocherie, F., Morin, J.-B., & Millet, G. P. (2017). Lower limb mechanical asymmetry during repeated treadmill sprints. Human Movement Science, 52, 203-214. https://doi.org/10.1016/j.humov.2017.02.008
- Girard, O., Millet, G. P., Slawinski, J., Racinais, S., & Micallef, J. P. (2013). Changes in running mechanics and spring-mass behaviour during a 5-km time trial. International Journal of Sports Medicine, 34(9), 832. https://doi.org/10.1055/s-0032-1329958
- Gosling, C. M., Gabbe, B. J., & Forbes, A. B. (2008). Triathlon related musculoskeletal injuries: The status of injury prevention knowledge. Journal of Science and Medicine in Sport, 11(4), 396. https://doi.org/10.1016/j.jsams.2007.07.009
- Hermens, H. J., Freriks, B., Disselhorst-Klug, C., & Rau, G. (2000). Development of recommendations for SEMG sensors and sensor placement procedures. Journal of Electromyography and Kinesiology, 10(5), 361. https://doi.org/10.1016/S1050-6411(00)00027-4
- Hopkins, W. G., Marshall, S. W., Batterham, A. M., & Hanin, J. (2009). Progressive statistics for studies in sports medicine and exercise science. Medicine & Science in Sports & Exercise, 41(1), 3. https://doi.org/10.1249/MSS.0b013e31818cb278
- Hurkmans, H. L., Bussmann, J. B., Selles, R. W., Horemans, H. L., Benda, E., Stam, H. J., & Verhaar, J. A. (2006). Validity of the Pedar Mobile system for vertical force measurement during a seven-hour period. Journal of Biomechanics, 39(1), 110. https://doi.org/10.1016/j.jbiomech.2004.10.028
- Karamanidis, K., Arampatzis, A., & Br??ggemann, G.-P. (2003). Symmetry and reproducibility of kinematic parameters during various running techniques. Medicine & Science in Sports & Exercise, 35(6), 1009. https://doi.org/10.1249/01.MSS.0000069337.49567.F0
- Kram, R., Griffin, T. M., Donelan, J. M., & Chang, Y. H. (1998). Force treadmill for measuring vertical and horizontal ground reaction forces. Journal of Applied Physiology, 85 (2), 764. (1985). https://doi.org/10.1152/jappl.1998.85.2.764
- Lai, A. K. M., Lichtwark, G. A., Schache, A. G., & Pandy, M. G. (2018). Differences in in vivo muscle fascicle and tendinous tissue behavior between the ankle plantarflexors during running. Scandinavian Journal of Medicine & Science in Sports, 28(7), 1828. https://doi.org/10.1111/sms.13089
- Lauber, B., Lichtwark, G. A., & Cresswell, A. G. (2014). Reciprocal activation of gastrocnemius and soleus motor units is associated with fascicle length change during knee flexion. Physiological Reports, 2(6), 6. https://doi.org/10.14814/phy2.12044
- Le Meur, Y., Dorel, S., Rabita, G., Bernard, T., Brisswalter, J., & Hausswirth, C. (2012). Spring–mass behavior and electromyographic activity evolution during a cycle-run test to exhaustion in triathletes. Journal Of Electromyography And Kinesiology, 22(6), 835. https://doi.org/10.1016/j.jelekin.2012.04.011
- Lersch, C., Grotsch, A., Segesser, B., Koebke, J., Bruggemann, G.-P., & Potthast, W. (2012). Influence of calcaneus angle and muscle forces on strain distribution in the human Achilles tendon. Clinical Biomechanics, 27(9), 955. https://doi.org/10.1016/j.clinbiomech.2012.07.001
- Magnusson, S. P., Langberg, H., & Kjaer, M. (2010). The pathogenesis of tendinopathy: Balancing the response to loading. Nature Reviews Rheumatology, 6(5), 262. https://doi.org/10.1038/nrrheum.2010.43
- Matijevich, E. S., Branscombe, L. M., Scott, L. R., Zelik, K. E., & Grabowski, A. (2019). Ground reaction force metrics are not strongly correlated with tibial bone load when running across speeds and slopes: Implications for science, sport and wearable tech. PLoS One, 14(1), e0210000. https://doi.org/10.1371/journal.pone.0210000
- Orendurff, M. S., Kobayashi, T., Tulchin-Francis, K., Tullock, A. M. H., Villarosa, C., Chan, C., Kraus, E., & Strike, S. (2018). A little bit faster: Lower extremity joint kinematics and kinetics as recreational runners achieve faster speeds. Journal of Biomechanics, 71, 167-175. https://doi.org/10.1016/j.jbiomech.2018.02.010
- Õunpuu, S., & Winter, D. A. (1989). Bilateral electromyographical analysis of the lower limbs during walking in normal adults. Electroencephalography and Clinical Neurophysiology, 72(5), 429. https://doi.org/10.1016/0013-4694(89)90048-5
- Pappas, P., Paradisis, G., & Vagenas, G. (2015). Leg and vertical stiffness (a)symmetry between dominant and non-dominant legs in young male runners. Human Movement Sciences, 40, 273-283. https://doi.org/10.1016/j.humov.2015.01.005
- Pataky, T. C., Robinson, M. A., & Vanrenterghem, J. (2013). Vector field statistical analysis of kinematic and force trajectories. Journal of Biomechanics, 46(14), 2394. https://doi.org/10.1016/j.jbiomech.2013.07.031
- Radzak, K. N., Putnam, A. M., Tamura, K., Hetzler, R. K., & Stickley, C. D. (2017). Asymmetry between lower limbs during rested and fatigued state running gait in healthy individuals. Gait & Posture, 51, 268-274. https://doi.org/10.1016/j.gaitpost.2016.11.005
- Rajagopal, A., Dembia, C. L., Demers, M. S., Delp, D. D., Hicks, J. L., & Delp, S. L. (2016). Full-body musculoskeletal model for muscle-driven simulation of human gait. IEEE Transactions on Biomedical Engineering, 63(10), 2068. https://doi.org/10.1109/TBME.2016.2586891
- Rendos, N. K., Harrison, B. C., Dicharry, J. M., Sauer, L. D., & Hart, J. M. (2013). Sagittal plane kinematics during the transition run in triathletes. Journal of Science and Medicine in Sport, 16(3), 259. https://doi.org/10.1016/j.jsams.2012.06.007
- Ros, S. J., Muljadi, P. M., Flatow, E. L., & Andarawis-Puri, N. (2019). Multiscale mechanisms of tendon fatigue damage progression and severity are strain and cycle dependent. Journal of Biomechanics, 85, 148-156. https://doi.org/10.1016/j.jbiomech.2019.01.026
- Sadeghi, H., Allard, P., & Duhaime, M. (1997). Functional gait asymmetry in able-bodied subjects. Human Movement Science, 16(2–3), 243. https://doi.org/10.1016/S0167-9457(96)00054-1
- Sadeghi, H., Allard, P., Prince, F., & Labelle, H. (2000). Symmetry and limb dominance in able-bodied gait: A review. Gait & Posture, 12(1), 34. https://doi.org/10.1016/S0966-6362(00)00070-9
- Scott, S. H., & Winter, D. A. (1990). Internal forces at chronic running injury sites. Medicine & Science in Sports & Exercise, 22(3), 357. https://doi.org/10.1249/00005768-199006000-00013
- Van Ginckel, A., Thijs, Y., Hesar, N. G., Mahieu, N., De Clercq, D., Roosen, P., & Witvrouw, E. (2009). Intrinsic gait-related risk factors for Achilles tendinopathy in novice runners: A prospective study. Gait & Posture, 29(3), 387. https://doi.org/10.1016/j.gaitpost.2008.10.058
- Vleck, V. E., & Garbutt, G. (1998). Injury and training characteristics of male elite, development squad, and club triathletes. International Journal of Sports Medicine, 19(1), 38. https://doi.org/10.1055/s-2007-971877
- Wren, T. A. L., Lindsey, D., Beaupré, G., & Carter, D. (2003). Effects of creep and cyclic loading on the mechanical properties and failure of human achilles tendons. Annals of Biomedical Engineering, 31(6), 710. https://doi.org/10.1114/1.1569267
- Wyndow, N., Cowan, S. M., Wrigley, T. V., & Crossley, K. M. (2013). Triceps surae activation is altered in male runners with Achilles tendinopathy. Journal of Electromyography and Kinesiology, 23(1), 166. https://doi.org/10.1016/j.jelekin.2012.08.010