
ABSTRACT
This study aimed to establish the optimal cut-off point(s) between classes in a new, evidence-based classification system for VI judo. We collected results from international VI judo competitions held between 2012 and 2018. Data on visual acuity (VA) and visual field (VF) measured during classification were obtained. Performance was determined by calculating a win ratio for each athlete. VA was significantly associated with judo performance (r = −.33, p <.001), VF was not (r =.30, p =.15). Decision tree analysis suggested to split the data into two groups with a VA cut-off of 2.5 logMAR units. Stability assessment using bootstrap sampling suggested a split into two groups, but showed considerable variability in the cut-off point between 2.0 and 3.5 logMAR. We conclude that to minimise the impact of impairment on the outcome of competition, VI judo should be split into two sport classes to separate partially sighted from functionally blind athletes. To establish an exact cut-off point and to decide if other measures of visual function need to be included, we argue for continued research efforts together with careful evaluation of research results from a multidisciplinary perspective.
Introduction
In contact sports such as judo or wrestling, kinaesthetic information is considered equally or more important than vision (and other senses), making those sports particularly suitable for individuals with vision impairment (Kuznetsova & Barabanshchikova, Citation2006; Starosta, Citation2013). In Paralympic judo, athletes with different degrees of vision impairment (ranging from partially sighted to fully blind) even compete against each other within the same competitive class, whereas in most Paralympic sports, athletes are allocated to different sport classes to compete against others with a similar activity limitation (Mann & Ravensbergen, Citation2018; Tweedy & Vanlandewijck, Citation2011). The rules of judo for athletes with vision impairment (VI judo) are adapted to better accommodate athletes with low vision. Rather than starting a match a few metres apart, as is done in able-sighted judo, a bout in VI judo starts after the two combatants have taken a standardised two-handed grip on each other’s jacket. This adaptation is designed to make the sport more suitable for those with vision impairment by removing what is presumably the most visually demanding aspect of a judo bout, i.e. obtaining an appropriate grip on the opponent (Piras et al., Citation2014).
Despite the adaptation to the VI judo rules, it remains questionable whether judo athletes (judokas) with different degrees of vision impairment can compete equitably against each other (Jones & Howe, Citation2005). Experts within VI judo (coaches, athletes, administrators) expressed the opinion that blind judokas do not stand an equal chance of winning when fighting against partially sighted opponents (Krabben et al., Citation2019). This expert opinion is in agreement with statistical analyses of results in elite-level VI judo, showing blind judokas are less successful than partially sighted judokas. Even though VI judo effectively only holds one competitive class for all eligible athletes, athletes are allocated to one of three sport classes based on an assessment of their visual function (). This class allocation has allowed for comparisons of competitive success between athletes of different sport classes, showing functionally blind (class B1) athletes perform worse than their partially sighted (class B2/B3) opponents (Kons et al., Citation2019; Krabben et al., Citation2018; Mashkovskiy et al., Citation2019). Yet VI judokas with most residual vision (class B3) do not win more often when fighting opponents with less residual vision (class B2) (Mashkovskiy et al., Citation2019). These findings suggest that as long as both judokas have some residual functional vision (i.e. they are not blind or limited to their ability to see only light or rudimentary motion), the better-sighted athlete does not hold an advantage over the other on the basis of their vision alone. To further examine the impact of vision on VI judo performance, Krabben et al. (Citation2018) experimentally compared able-sighted judokas fighting with and without blindfolds under VI judo rules. Although blindfolded athletes were still able to maintain reasonable levels of performance, they were significantly disadvantaged when fighting against non-blindfolded opponents. These findings seem to indicate that the current VI judo regulations do not fulfil the aim of Paralympic classification, which is to “minimise the impact of impairment on the outcome of competition” (Tweedy & Vanlandewijck, Citation2011).
Table 1. Current classification criteria for visually impaired (judo) athletes. Athletes can be classified based on tests of visual acuity, a measure of the sharpness or clarity of vision, or visual field, a measure of the area of peripheral vision with which an individual can see (i.e. without moving their eyes). Only one of the two criteria (visual acuity or visual field) needs to be met in order to be allocated to a sport class
Although expert consensus as well as empirical evidence suggest a need to change the way visually impaired judokas are grouped for competition, additional information is needed to establish new and more legitimate classification criteria. Based on the abovementioned comparisons between current classes, it may seem straightforward to divide competition into two separate classes, one for the current class B1 athletes, and another for the current class B2 and B3 athletes. Yet these analyses do not account for the potential impact of differences in visual function between athletes within the same sport class; two athletes may currently fall into the same competitive class, but hold a different degree of impairment which might impact their performance differently. For instance, even within the B1 class, athletes differ in their degree of visual function: some may still perceive light or even hand motion, whereas others have complete loss of vision. It remains possible that those with some remaining vision retain an advantage over those who are completely blind. Similarly, it is possible that athletes with severely limited vision who are now classified in the B2 class could be at a disadvantage when fighting against B2 athletes with better vision, and so may need to be allocated to a sport class separate to those other B2 athletes (i.e. in their own class or joined with the current B1 judokas). To overcome the limitations of comparisons between current classes, the International Paralympic Committee (IPC) mandated that new classification criteria should be based on evidence relating sport performance to direct measures of impairment (Tweedy et al., Citation2016). New classification criteria for VI judo should thus be based on research relating direct measures of visual function to measures of judo performance. To date this has not yet occurred.
A direct assessment of the visual function of all VI athletes is obtained during classification, a process that aims to determine the eligibility of athletes to compete in Para sports and to allocate eligible athletes to sport classes (Mann & Ravensbergen, Citation2018). VI classification is performed by certified classifiers who have a background in optometry or ophthalmology (International Blind Sports Federation, Citation2018). Most VI athletes are classified on the basis of their impaired visual acuity (VA), which is a measure of their sharpness of vision. Alternatively, some athletes may be classified eligible to compete on the basis of visual field (VF) loss. VF is a measure of the area of peripheral vision with which an individual can see (i.e. without moving their eyes). The data on VA and VF of judokas obtained during classification hold promise for a more direct analysis of the impact of vision impairment on judo performance, yet previous studies did not have access to this information and were therefore constricted to comparisons between sport classes.
Another issue not addressed within earlier work is whether the impact of vision impairment differs across the different gender and weight categories within VI judo. VI judo has seven weight classes for men (−60 kg, −66 kg, −73 kg, −81 kg, −90 kg, −100 kg and +100 kg) and six for women (−48 kg, −52 kg, −57 kg, −63 kg, −70 kg and +70 kg). Experts within the VI judo community speculated that the visual demands of judo may be higher for lightweight compared to heavyweight athletes because of the faster nature of the bouts, and therefore vision impairment might impact performance more within the lighter weight categories (Krabben et al., Citation2019). If the impact of impairment on performance would indeed differ between gender and weight categories, this might warrant the development of gender and weight-specific classification criteria for VI judo.
The aim of this study was to establish the optimal cut-off point(s) between sport classes in a new, evidence-based system of classification for VI judo. We examined the relationship between direct measures of visual function collected during classification and the results of international VI judo competitions between 2012 and 2018. For the purposes of this study, the International Blind Sports Federation (IBSA) allowed us to access classification data stored in their database, the IBSA Sports Administration System (ISAS). Based on expert opinions and earlier empirical work, we hypothesised that (1) functionally blind judokas would be less successful than those with some residual functional vision, and (2) the impact of impairment on performance would be lower in the heavier compared to the lighter weight categories. We expected to find a single cut-off point between two ideal classes separating athletes with and without functional vision.
Method
Data sample
We included all available competition results from Paralympic Games, World Championships, World Cups and Continental Championships held between 2012 and 2018.Footnote1 Most of these data were collected from the IBSA website.Footnote2 Additional archived competition results were provided to us by IBSA. Only competitions for which the full results were available were included. Data on the visual function of athletes were collected from ISAS. IBSA granted permission to access this information for the current study. On the advice of our institutional ethical committee, no ethical approval was required for this study because all data were obtained in secondary form and anonymised before being further analysed.
Procedure
For each of the athletes who competed in one or more of the included competitions, we collected all classification data between 2012 and 2018 through ISAS. VA is measured during classification using the Berkeley Rudimentary Vision Test (BRVT; Bailey et al., Citation2012). The BRVT was developed specifically to measure visual function in those with (very) poor vision. VA is measured in logMAR units, with higher VA values representing poorer vision. Young adults without vision impairment are expected to have a VA of approximately 0.0 logMAR units. The current minimum impairment criteria (MIC) for VA to be eligible to compete in VI sports is set at 1.0 logMAR. With the BRVT, VA can be measured up to 2.9 logMAR. For athletes with VA worse than 2.9 logMAR, VA can be classified as either white field discrimination (WFD), black white discrimination (BWD), light perception (LP) or no light perception (NLP) (Bailey et al., Citation2012). For analysis purposes, a numeric value was assigned to these acuity levels: WFD = 3.2 logMAR, BWD = 3.5 logMAR, LP = 3.7 logMAR, NLP = 4.0 logMAR. The values assigned to WFD and BWD are suggested by the BRVT. They are written on the card pairs that are used to perform the test and calculated from the size of the presented target when observing these targets at the designated testing distance of 25 cm. The value of 4.0 logMAR for NLP corresponds with previous studies (Aaberg et al., Citation1998; Allen et al., Citation2019; Jacobs et al., Citation2011) and represents the logMAR equivalent to an object that subtends 180 degrees of visual field (i.e. essentially the whole visual field). We therefore considered 4.0 logMAR to be a theoretical equivalent of complete vision loss.Footnote3 A value of 3.7 logMAR was assigned to LP because this value falls in between the values assigned to WFP and NLP and like other studies, retains a 0.3 logMAR difference between LP and NLP (Ikeda & Kishi, Citation2010; Jackson et al., Citation2016; Moshfeghi et al., Citation2003). VF is measured in degrees radius and is assessed during classification using specific visual field machines. The Goldmann Visual Field Perimeter is preferred, the Humphrey Field Analyser or Octopus Interzeag are also accepted. For descriptions of and comparisons between these machines we refer to Bevers et al. (Citation2019). All measures of visual function data were collected as recorded by the classifiers on the official classification sheets stored in ISAS.
Some VI athletes have progressive medical conditions causing their visual function to change over time. Therefore, most athletes who undergo classification need to be re-evaluated to establish whether their visual function has changed. Based on the athlete’s condition, classifiers may decide that athletes need to be reclassified within either the next one, two or four years. In case the classifier believes an athlete’s condition is highly unlikely to progress, the athlete may obtain a confirmed status; they do not need to be re-evaluated in classification (this is mainly for athletes with severe vision loss, i.e. LP or NLP).
Data analysis
In case multiple classifications of the same athlete were available, we selected the classification under which the athlete competed most for further analysis, to ensure independence of observations. In any cases where an athlete turned 18 between 2012 and 2018, we included in our analyses the data only from those competitions where the athlete was 18 years or older at the time of the competition. Performance was assessed using a win ratio, calculated as the number of fights won divided by the total number of fights the athlete competed in within the analysed time frame (i.e. when the selected classification was valid). Most international VI judo competitions are organised using (different variations of) a knock-out system, which means losing competitors are eliminated as the competition progresses. Within an elimination system, the average win ratio across all competitors is therefore expected to be lower than 50%.
The relationship between visual function and performance was analysed through calculation of Pearson’s correlation coefficient. Decision tree analyses were used to determine whether or not the data supported splitting VI judo into more than one sport class, and if so, what the ideal cut-off point(s) between these classes should be. We applied the unbiased recursive partitioning algorithm (Hothorn et al., Citation2006), which recursively aims to perform univariate splits in the input variables as long as these are significantly associated with the response variable. The results of recursive partitioning are known to be potentially unstable, as small changes in the data sample may lead to substantially different decision trees being built (Strobl et al., Citation2009). To assess the stability of the decision tree, we examined the variability in cut-off selection by bootstrapping of 10,000 random resamples of our data, using the toolkit for stability assessment of tree-based learners (Philipp et al., Citation2016). 10,000 samples were randomly drawn with replacement from the original dataset and had the same size as the original dataset. For each of these 10,000 samples, a separate decision tree was built. We summarised the number of splits and the values of the split points over all decision trees to estimate the optimal number of classes and cut-off point(s).
To assess whether the impact of impairment on performance differed across weight categories, we repeated the analyses described above when grouping the three lightest and the three heaviest weight categories for men and women (we did not analyse each weight category separately because of low numbers of athlete in each category, which would have rendered the analyses underpowered). For each group, we calculated the Pearson’s correlation coefficient between visual function and win ratio. Additionally, we also used decision tree analyses to assess whether the data for each gender and weight group supported splitting competition into different sport classes.
Results
Judo performance
Match data for eighteen different tournaments were collected (), spanning 3101 individual fights. A total of 617 different ISAS-registered athletes competed in one or more of these fights. On average athletes competed in 3.7 ± 2.9 of the included tournaments, where they obtained an average win ratio of 0.34 ± 0.29. A boxplot showed that athletes who competed more often performed better (). Athletes who only competed once or twice were particularly less likely to be competitive compared to athletes who competed in at least three competitions (t(570.75) = 10.7, p< .001, d= 0.9). Including these athletes in our analysis might cloud the true impairment-performance relationship, because these athletes apparently performed worse not necessarily as a result of their degree of impairment. Therefore we excluded 282 athletes who only competed once or twice, leaving 335 athletes for further analyses.
Figure 1. Box plot of win ratio by number of tournaments an athlete competed in. Athletes who competed more often in international competitions performed better. A t-test confirmed that athletes who only competed in one or two competitions performed worse than the others (t(570.75) = 10.7, p<.001, d= 0.9)
Table 2. Tournaments included within the dataset
Visual function
For 39 out of the 335 athletes, no classification data were available. For 294 out of the 296 remaining athletes (99.3%), a measure of VA could be retrieved from the collected classification data. For only 25 athletes (8.4%), VF was measured during classification. VA was bimodally distributed ()), with most athletes having either a VA between 1.0 and 2.5 logMAR (79.1% of all athletes), or worse than 3.5 logMAR (12.8%; these were athletes with either LP or NLP). Only 5.1% all athletes had a VA between 2.6 and 3.5 logMAR. Seven athletes (2.4%) had a VA better (i.e. lower) than the current MIC of 1.0 logMAR; these athletes all qualified to compete on the basis of an impaired VF.
Figure 2. Visualisations of impairment and performance data. A) Distribution of the analysed athletes’ visual acuity. B) Relationship between visual acuity and win ratio. C) Same data as Figure B presented as a boxplot where each box represents an equal number of athletes
Relationship between visual acuity and judo performance
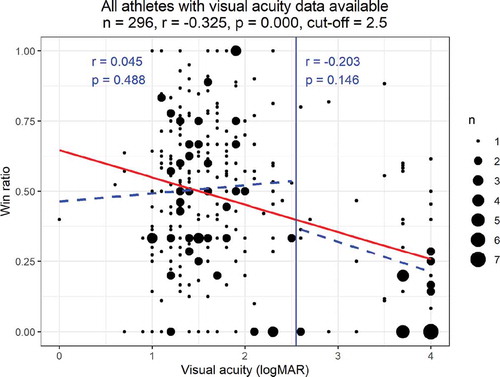
We found a significant, moderate correlation between VA and win ratio (r= −.33, p< .001; )), indicating that athletes with better vision won a higher percentage of their fights. The decision tree algorithm found a binary split in the data at a VA of 2.5 logMAR (). Athletes with a VA of 2.5 logMAR or better (n= 243), had an average win ratio of 0.51 ± 0.25 (M± SD, 95%CI [0.49,0.52]). Athletes with vision worse than 2.5 logMAR (n= 53) had an average win ratio of 0.25 ± 0.24 (M± SD, 95%CI [0.22,0.29]). The difference between these two groups was significant and showed a large effect size (t(78.9) = 6.8, p< .001, d= 1.0). No additional split was made by the algorithm, suggesting the win ratio of athletes could not be better predicted by further splitting the data on the basis of VA. Analyses of the impairment-performance relationships after splitting the data at a VA of 2.5 logMAR, clearly showed visual function is not related to performance within the first subgroup of athletes with VA of 2.5 logMAR or better (r= .04, p= .49). Yet within the subgroup of athletes with vision worse than 2.5 logMAR, a trend for a negative relationship between impairment and performance remained present (r= −.20, p= .15).
Figure 3. Relationship between visual acuity and win ratio. The vertical black line represents the suggested cut-off point. The red line represents the linear fit between visual function and performance over all athletes. The black dotted lines represent the linear fits between visual function and performance for each of the two subgroups created by the split
Bootstrapping results confirmed that VA could be used as a variable to split the data into groups with different performance levels. For each of the 10,000 bootstrap samples, the decision tree split the data into multiple groups on the basis of VA. The majority of the bootstrap trees (65.8%) stopped after a single split. For 25.9% of the bootstrap samples, a second split on VA was made and 8.3% of the trees made even three or more splits on the basis of VA. The histogram of the first cut-off points selected for VA shows a large spread, with 96.5% of the first splits made between 2.0 and 3.5 logMAR (). This indicates that the normal variability in data which can be expected from sampling might cause the selected value for the split point to vary substantially within this range. The most frequently selected cut-off point was 2.5 logMAR (17.5% of the 10,000 cases). The next most frequently selected VA cut-off points were 3.5 logMAR (17.1%), 2.9 logMAR (13.0%) and 2.0 logMAR (11.7%).
Figure 4. Histogram of the first split points for VA using 10,000 bootstrapped samples. Each of the 10,000 samples was randomly drawn with replacement from the original dataset and for each sample a separate decision tree was built. All of these 10,000 decision trees split the data into multiple groups. 2.5 logMAR was most frequently selected as the first split point (in 17.5% of all cases); 96.5% of all cases selected a first split point between 2.0 and 3.5 logMAR
Relationship between visual field and judo performance
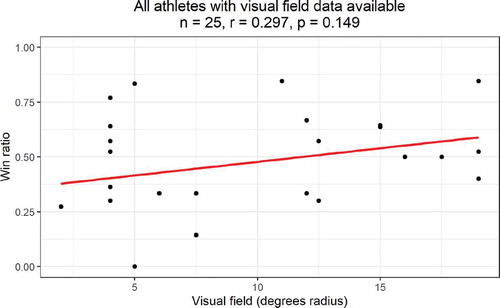
We found no significant correlation between VF and win ratio (r= .30, p= .15; ). No split could be made in the data on the basis of VF. This might indicate VF is not related to performance in VI judo, yet with only 25 athletes included we should acknowledge this analysis is likely to be underpowered.
Figure 5. Relationship between visual field and win ratio. The red line represents the linear fit between visual function and performance
Impact of impairment across weight categories
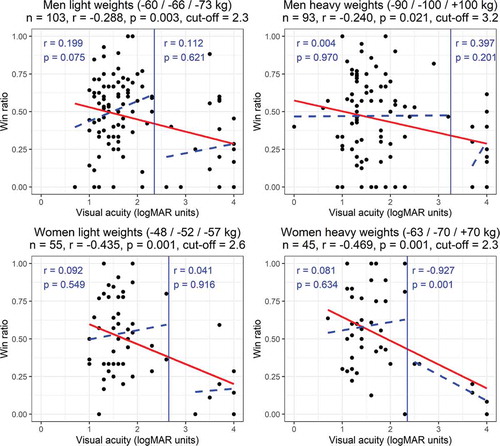
Similar trends in the relationship between impairment and performance were observed across the different gender and weight groups (). A significant negative correlation was found between VA and win ratio in all groups (men light weights: r= −.29, p= .003; men heavy weights: r= −.24, p= .021; women light weights: r= −.43, p = .001; women heavy weights: r= −.47, p= .001). Decision tree analyses suggested to split competition into two classes in all four groups, with the suggested cut-off points ranging from 2.3 to 3.2 logMAR.
Figure 6. Impairment-performance relationships for separate gender and weight groups. Red lines represents the linear fit between visual function and performance over all athletes within the group. Blue vertical lines show suggested cut-off values from decision tree analyses. The blue dotted lines represent the linear fits between visual function and performance for each of the two subgroups created by the split
Discussion
The aim of this study was to establish the optimal cut-off point(s) between sport classes in a new, evidence-based classification system for VI judo. We collected seven years of international competition results and related these data to the visual function of the athletes measured during classification. We did not achieve our aim of finding a specific optimal cut-off point. Still, the results add weight to earlier findings showing the most severely impaired athletes in VI judo are less successful than their better-sighted opponents (Kons et al., Citation2019; Krabben et al., Citation2018; Mashkovskiy et al., Citation2019). Yet where earlier work compared existing groups based on current classes, in the current study we directly related visual function to performance. This approach allowed us to provide more firm support for the development of new, evidence-based classes for VI judo and to help further establish the cut-off between classes (Tweedy et al., Citation2016).
We found that the current one-class system in VI judo does not fulfil the Paralympic aim to “minimise the impact of impairment on the outcome of competition” (Tweedy & Vanlandewijck, Citation2011). Decision tree analysis suggested to split competition into two classes with substantially different performance levels, one class for athletes with VA up to 2.5 logMAR and another class for athletes with VA worse than 2.5 logMAR. It is worth noting that this cut-off point is close to that currently used to distinguish those with most severe impairment from all other athletes in most VI sports (2.6 logMAR, see ). The current findings support the expert opinion that competition should be split into separate classes for functionally blind and partially sighted athletes. However, we did not find support for the development of gender or weight specific classification criteria hypothesised by VI judo experts (Krabben et al., Citation2019).
It might seem counterintuitive to suggest a split into multiple sport classes when the overall correlation between VA and win ratio was only weak. Yet a strong correlation between impairment and performance is not necessary to justify a split in the data. Actually, for a two-class system, rather than a strong correlation, we should ideally find two clusters in the data: one with better performance for those with less impairment, and another with worse performance with more impairment. This pattern is largely consistent with what we find in our data (). Indeed the overall correlation between impairment and performance was only weak, largely because there is no association between vision and judo performance in the VA range from 1.0 to 2.5 logMAR. Crucially, we interpret this to be a good outcome for the purposes of classification because it means that that group should compete fairly. If there were to be a strong correlation within that group then it would be necessary to split the group into further classes. In other words, a strong correlation between impairment and performance will in all likelihood indicate the need for many classes. The antithesis is not true: a weak correlation doesn’t mean that no split is required.
Although the bootstrap analysis could not identify one specific optimal cut-off point, it further supported the conclusion to split VI judo into multiple sport classes. Stability assessment of the main decision tree over 10,000 bootstrap samples suggested in all cases to split competition into more than one sport class on the basis of VA. Yet the range of split points varied substantially between 2.0 up to 3.5 logMAR, indicating that the normal variability in the data which can be expected from sampling might cause the selected value for the split point to vary substantially within this range. These findings supported the need for a split into (at least) two sport classes, to ensure the most severely impaired athletes (those with only LP or NLP) do not compete against those with relatively better visual function (better than 2.0 logMAR). Each split point between 2.0 and 3.5 logMAR will achieve this aim and would therefore be a considerable improvement compared to the current one-class system. Yet the results were inconclusive whether any split point between 2.0 and 3.5 logMAR is more optimal than any other.
Analyses of the impairment-performance relationships after applying a split in the data at 2.5 logMAR showed a trend for impairment to impact performance for athletes with vision worse than 2.5 logMAR (). Even when applying a split into two classes, additional measures might still be needed to equalise chances for athletes in a new class meant for the most severely impaired athletes. One option might be to blindfold all competitors in this class. Blindfolding is generally not considered appropriate in VI sports, although experts in VI sports expressed there might be some situations where the use of blindfolds is appropriate (Ravensbergen et al., Citation2016). In VI swimming for instance, blackened swimming goggles are considered appropriate only for athletes within the most severe VI class (Ravensbergen et al., Citation2018).
We did not achieve our aim to establish specific criteria for new sport classes for VI judo. Instead of a specific cut-off point, we could only identify a range of VA values. Several challenges exist in further narrowing down to an exact cut-off point within the suggested range of VA values. First of all, VA values within this range were underrepresented in our data sample, with VA values between 2.5 and 3.5 logMAR especially rare ()). It may be that these VA values are generally uncommon amongst the visually impaired population. Yet it might also be that classifiers currently do not accurately measure VA when it is worse than 2.6 logMAR, which is the current cut-off point for the B1 class. Classifiers often have limited time and might therefore opt to simply classify an athlete with vision worse than 2.6 logMAR as having either LP or NLP rather than continuing to test with the BRVT.Footnote4 The implication is that the substantially lower performance levels we have found for the group of athletes with only LP or NLP might actually concern a broader group of athletes with VA worse than 2.6 logMAR. If so, more accurate assessment of the visual function of these athletes would have likely reduced the range of possible VA cut-off values we have found, but it does not alter the fundamental conclusion that the group with VA worse than 2.5 logMAR performs more poorly than the group with VA 2.5 logMAR or better. Nonetheless, we recommend careful and accurate assessment of VA in those with severe vision impairment in combination with continued monitoring of their performance in future VI judo competitions.
A second challenge in establishing the cut-off point is the large degree of variability in performance across the whole range of VA values in the athletes included in our study. Even though the most severely impaired athletes performed on average significantly worse than those with some residual vision, many (functionally) blind judokas achieved high levels of performance, and many partially sighted athletes did not perform well at all. This is in agreement with earlier work showing even without vision, judokas are still capable of throwing sighted opponents when fighting under VI judo rules (Krabben et al., Citation2018). A considerable component of judo performance thus seems determined by factors other than vision, presumably factors related to talent and training. The joint IPC-IBSA position stand on VI classification therefore encourages researchers to collect background information on confounding factors such as practice volume to control for these factors while establishing the impairment-performance relationship (Mann & Ravensbergen, Citation2018). Moreover, classification currently only considers tests of VA and VF. Yet other aspects of vision (e.g. the ability to perceive contrast or motion) might be more strongly associated with judo performance and would therefore be more suitable for use in classification. Indeed, a panel of VI judo experts identified six additional measures of visual function besides VA and VF which might be important enough for VI judo to be included in classification (motion perception, dynamic visual acuity, light sensitivity, ocular coordination, depth perception, and contrast sensitivity; Krabben et al., Citation2019). Future research should aim to evaluate whether the inclusion of those additional tests of visual function would increase the amount of variability in performance explained by VI, in which case those tests could be included in classification. Alternately, it is possible that at least one of those measures could be a better predictor of performance in judo. In VI shooting for example, the evaluation of additional tests of visual function led to the recommendation to include a test of contrast sensitivity in classification (Allen et al., Citation2018). Finally, we should acknowledge that our analysis of the relationship between VF and performance was limited. VF was assessed during classification in only 8.4% of all athletes in our data sample, and just 2.7% qualified to compete in VI judo on the basis of an impaired VF. This makes it challenging to establish evidence-based classification criteria for VF on the basis of existing data. Considering that a panel of VI judo experts unanimously agreed that VF should remain included in classification for VI judo (Krabben et al., Citation2019), additional research efforts into the relationship between VF and judo performance would seem warranted.
Yet even with additional research results available, it remains plausible that research data may at best provide a range of values rather than an exact cut-off point to distinguish sport classes. It may be that there is a more gradual decrease in judo performance in the range of visual acuity from 2.0 to 3.5 logMAR, rather than judo performance decreasing drastically at a single level of impairment to visual acuity. If so, decisions on the establishment of new classification criteria would need to be taken on other than purely data-driven grounds. One consideration might be the risk of setting the cut-off too high (i.e. at a too severe level of impairment within the range provided by research) or too low (i.e. too mild). On the one hand, athletes with a level of visual function within the provided range might still benefit from their limited vision, meaning they would hold an unfair advantage when being allocated to a class with functionally blind athletes. Yet their level of visual function might also not be sufficient anymore to support their performance, in which case they would be disadvantaged when being allocated to a class with better-sighted athletes. Depending on which of these scenarios would be judged more harmful to the legitimacy of VI judo competition, the cut-off point between classes might be set at a more or less severe level of impairment. Alternatively, the cut-off might be set at a more conceptual border between “partially sighted” and “blind”. One option might be at the current cut-off for the B1 class of 2.6 logMAR, which is based on the World Health Organisation’s definition for blindness (World Health Organization, Citation2004). Another option might be 2.9 logMAR, which is the highest numeric VA value measurable by the BRVT (Bailey et al., Citation2012). The decision where to “draw the line” on the basis of research data might therefore not be straightforward and/or objectively possible. To bridge the gap between research findings and the establishment of new classification criteria, experts from other fields might need to be consulted such as philosophers or legal experts. As argued by McNamee (Citation2017, p. 207):
“[W]hat would be required is a classification system and committee that found space for philosophers and social scientists, not merely scientific and clinically trained evaluators of structure and function for classification eligibility issues.”
Besides continued research efforts, careful evaluation of research results from a multidisciplinary perspective may prove critical to establish the most legitimate way to structure VI judo competition.
Conclusion
Vision impairment is significantly associated with performance when applying the current classification system for VI judo. This means judokas with less vision impairment have a competitive advantage over those with more severe impairment. Results of the current study suggest to split VI judo into two sport classes on the basis of VA, with a suggested cut-off point between 2.0 and 3.5 logMAR. To further narrow down to an exact cut-off point and to decide if other measures of visual function need to be included, we argue for continued research efforts together with careful evaluation of research results and philosophical considerations from a multidisciplinary perspective.
Notes
Disclosure statement
No potential conflict of interest was reported by the authors.
Additional information
Funding
Notes
1 As classification procedures for VI sports underwent significant changes in the lead up to the Paralympic Games of London 2012, only data obtained from 2012 onwards was included.
3 logMAR stands for the logarithm of the minimum angle of resolution, i.e. the minimum visual angle at which a person can resolve details, measured in minutes of arc (1 minute of arc is 1/60th degree). A logMAR score of 4.0 corresponds to a visual field of 10800 minutes of arc or 180 degrees. Any value above 4.0 logMAR would refer to a minimal angle of resolution larger than a full visual field.
4 On some of the classification sheets we accessed during data collection for this study, we even found VA values reported as “>2.6” rather than specific values. These classifications were excluded from the research data as we could not extract an exact VA value, but it suggests that indeed classifiers might be more concerned with determining the correct sport class of an athlete than the exact level of VA.
References
- Aaberg, T. M., Flynn, H. W., Schiffman, J., & Newton, J. (1998). Nosocomial acute-onset postoperative endophthalmitis survey: A 10-year review of incidence and outcomes. Ophthalmology, 105(6), 1004–1010. https://doi.org/10.1016/S0161-6420(98)96000-6
- Allen, P. M., Latham, K., Ravensbergen, R. H. J. C., Myint, J., & Mann, D. L. (2019). Rifle shooting for athletes with vision impairment: does one class fit all? Frontiers in Psychology, 10(1727). https://doi.org/10.3389/fpsyg.2019.01727
- Allen, P. M., Ravensbergen, H. J. C., Latham, K., Rose, A., Myint, J., & Mann, D. L. (2018). Contrast sensitivity is a significant predictor of performance in rifle shooting for athletes with vision impairment. Frontiers in Psychology, 9(950). https://doi.org/10.3389/fpsyg.2018.00950
- Bailey, I. L., Jackson, A. J., Minto, H., Greer, R. B., & Chu, M. A. (2012). The berkeley rudimentary vision test. Optometry and Vision Science, 89(9), 1257–1264. https://doi.org/10.1097/OPX.0b013e318264e85a
- Bevers, C., Blanckaert, G., Van Keer, K., Fils, J.-F., Vandewalle, E., & Stalmans, I. (2019). Semi-automated kinetic perimetry: Comparison of the octopus 900 and humphrey visual field analyzer 3 versus Goldmann perimetry. Acta ophthalmologica, 97(4), e499–e505. https://doi.org/10.1111/aos.13940
- Hothorn, T., Hornik, K., & Zeileis, A. (2006). Unbiased recursive partitioning: A conditional inference framework. Journal of Computational and Graphical Statistics, 15(3), 651–674. https://doi.org/10.1198/106186006X133933
- Ikeda, F., & Kishi, S. (2010). Inner neural retina loss in central retinal artery occlusion. Japanese Journal of Ophthalmology, 54(5), 423–429. https://doi.org/10.1007/s10384-010-0841-x
- International Blind Sports Federation. (2018). IBSA classification rules. http://www.ibsasport.org/documents/files/182-1-IBSA-Classification-rules-2018.pdf
- Jackson, T. L., Johnston, R. L., Donachie, P. H. J., Williamson, T. H., Sparrow, J. M., & Steel, D. H. W. (2016). The royal college of ophthalmologists’ national ophthalmology database study of vitreoretinal surgery: report 6, diabetic vitrectomy. JAMA Ophthalmology, 134(1), 79–85. https://doi.org/10.1001/jamaophthalmol.2015.4587
- Jacobs, D. J., Leng, T., & Flynn, J. H. W. (2011). Delayed-onset bleb-associated endophthalmitis: Presentation and outcome by culture result. Clinical Ophthalmology (Auckland, N.Z.), 5, 739–744. https://doi.org/10.2147/OPTH.S17975
- Jones, C., & Howe, P. D. (2005). The conceptual boundaries of sport for the disabled: classification and athletic performance. Journal of the Philosophy of Sport, 32(2), 133–146. https://doi.org/10.1080/00948705.2005.9714678
- Kons, R. L., Krabben, K., Mann, D. L., Fischer, G., & Detanico, D. (2019). The effect of vision impairment on competitive and technical-tactical performance in judo: Is the present system legitimate? Adapted Physical Activity Quarterly: APAQ, 36(3), 388–398. https://doi.org/10.1123/apaq.2018-0181
- Krabben, K., Ravensbergen, R. H. J. C., Nakamoto, H., & Mann, D. L. (2019). The development of evidence-based classification of vision impairment in judo: A delphi study. Frontiers in Psychology, 10(98). https://doi.org/10.3389/fpsyg.2019.00098
- Krabben, K., van der Kamp, J., & Mann, D. L. (2018). Fight without sight: The contribution of vision to judo performance. Psychology of Sport and Exercise, 37, 157–163. https://doi.org/10.1016/j.psychsport.2017.08.004
- Kuznetsova, A. S., & Barabanshchikova, V. V. (2006). The effects of self-regulation techniques on human functional states: The moderating role of dominant sensory modality. Review of Psychology, 12(1), 45–53.
- Mann, D. L., & Ravensbergen, H. J. C. (2018). International Paralympic committee (IPC) and international blind sports federation (IBSA) joint position stand on the sport-specific classification of athletes with vision impairment. Sports Medicine, 48(9), 2011–2023. https://doi.org/10.1007/s40279-018-0949-6
- Mashkovskiy, E., Magomedova, A., & Achkasov, E. (2019). Degree of vision impairment influence the fight outcomes in the Paralympic judo: A 10-year retrospective analysis. The Journal of Sports Medicine and Physical Fitness, 59(3), 376–379. https://doi.org/10.23736/s0022-4707.18.08232-4
- McNamee, M. J. (2017). Paralympism, Paralympic values and disability sport: A conceptual and ethical critique. Disability and Rehabilitation, 39(2), 201–209. https://doi.org/10.3109/09638288.2015.1095247
- Moshfeghi, D. M., Kaiser, P. K., Scott, I. U., Sears, J. E., Benz, M., Sinesterra, J. P., Kaiser, R. S., Bakri, S. J., Maturi, R. K., Belmont, J., Beer, P. M., Murray, T. G., Quiroz-Mercado, H., & Mieler, W. F. (2003). Acute endophthalmitis following intravitreal triamcinolone acetonide injection. American Journal of Ophthalmology, 136(5), 791–796. https://doi.org/10.1016/S0002-9394(03)00483-5
- Philipp, M., Zeileis, A., & Strobl, C. (2016). A toolkit for stability assessment of tree-based learners. https://EconPapers.repec.org/RePEc:inn:wpaper:2016-11
- Piras, A., Pierantozzi, E., & Squatrito, S. (2014). Visual search strategy in judo fighters during the execution of the first grip. International Journal of Sports Science & Coaching, 9(1), 185–198. https://doi.org/10.1260/1747-9541.9.1.185
- Ravensbergen, H. J. C., Genee, A. D., & Mann, D. L. (2018). Expert consensus to guide the classification of paralympic swimmers with vision impairment: A delphi study. Frontiers in Psychology, 9(1756). https://doi.org/10.3389/fpsyg.2018.01756
- Ravensbergen, H. J. C., Mann, D. L., & Kamper, S. J. (2016). Expert consensus statement to guide the evidence-based classification of Paralympic athletes with vision impairment: A delphi study. British Journal of Sports Medicine, 50(7), 386–391. https://doi.org/10.1136/bjsports-2015-095434
- Starosta, W. (2013). Kinesthetic sense and awareness in wrestling: the structure, conditions and development of an “opponent’s feeling”. International Journal of Wrestling Science, 3(2), 29–50. https://doi.org/10.1080/21615667.2013.10878987
- Strobl, C., Malley, J., & Tutz, G. (2009). An introduction to recursive partitioning: Rationale, application, and characteristics of classification and regression trees, bagging, and random forests. Psychological Methods, 14(4), 323–348. https://doi.org/10.1037/a0016973
- Tweedy, S. M., Mann, D. L., & Vanlandewijck, Y. C. (2016). Research needs for the development of evidence-based systems of classification for physical, visual and intellectual impairments. In Y. C. Vanlandewijck & W. R. Thompson (Eds.), Training and coaching of the paralympic athlete. IOC PressWiley Blackwell. 122-149. https://doi.org/10.1002/9781119045144.ch7
- Tweedy, S. M., & Vanlandewijck, Y. C. (2011). International Paralympic committee position stand—background and scientific principles of classification in Paralympic sport. British Journal of Sports Medicine, 45(4), 259. https://doi.org/10.1136/bjsm.2009.065060
- World Health Organization. (2004). International statistical classification of diseases and related health problems (Vol. 1).