
 ?Mathematical formulae have been encoded as MathML and are displayed in this HTML version using MathJax in order to improve their display. Uncheck the box to turn MathJax off. This feature requires Javascript. Click on a formula to zoom.
ABSTRACT
The purpose of this study was to identify the relationship between ACL relevant knee joint loading and the free (reaction) moment during 90° sidestepping task. It was hypothesized that the specific movement strategy of an athlete will impact this relationship and therefore contribute to joint loading. Functional principal component and canonical correlation analysis were used to understand the nature of free moments and their interaction with 3D joint loading in 52 athletes. It was observed that the orientation of either a positive or negative free moment is associated with different orientations and location of the foot segment at initial touch down. This impacted the rotational moment that is transferred to the knee joint: A higher internal reaction moment is observed when athletes were exposed to a positive free reaction moment, which potentially increases the load on the ACL. Furthermore, the free moment predicted joint moments and joint reaction forces. The interpretation of the principal components identified the function of the free moment to control body rotation. Free moments of different orientation were generated during the same movement, which highlights the importance of investigating individual movement strategies to understand potential injury risk and control factors.
1. Introduction
Sidestepping manoeuvres are a key component of team sports actions and executed up to 100 times by each player during a soccer game (Sheppard & Young, Citation2006). At the same time, this movement task demands the athlete to keep control over their segments in all three motion planes while rotating the body along its longitudinal axis and deflecting the centre of mass speed (Patla et al., Citation1999). The complexity of the movement might be one source for the high incidence of serious lower limb injuries – especially anterior cruciate ligament (ACL) ruptures – during fast changes of direction and landing tasks which occur often during team sports games (Hootman et al., Citation2007; Moses et al., Citation2012).
The factors that increase the load on the ACL are well research and reported: Research utilizing in vivo, cadaver or simulation studies advocate that a combination of unfavourable knee valgus and internal rotation moments combined with a nearly extended knee joint are amongst the biomechanical risk factors of importance (Mclean et al., Citation2004, Citation2008; Mclean et al., Citation2005).
According to the higher ACL rupture incidence in female and less skilled athletes, it was assumed that the aforementioned risk factors are reported more dominant in these groups (Havens & Sigward, Citation2015; McLean et al., Citation2005). However, while current studies reported differences in the kinematics, no effect on the joint kinetics was detected. Therefore, the relationship between injury risk and the reported risk factors seems incompletely explained. Dempsey et al. showed that it is possible to modify the load-associated joint kinetics which are identified as risk factors by changes in the body posture during the cutting manoeuvre (Dempsey et al., Citation2009). In addition to that, recent studies of our workgroup identified specific movement strategies that are closely associated with those ACL relevant risk factors (David et al., Citation2017, Citation2018). Despite the effort of research groups to identify risk factors for ACL injuries to prevent such, the numbers of ruptures are increasing (Hootman et al., Citation2007; Waldén et al., Citation2016). Most of the studies focus on the frontal plane knee joint moments as transverse plane motion in the knee joint is small and measuring them is error-prone. Therefore, the overloading of the ACL by an increased internal rotation of the tibia against the femur was not addressed so far although the limitation of internal rotation is one of the main functions of the ACL.
Also, a single joint’s movement is not isolated from the rest of the body. The rotation of segments can be introduced by a top-down mechanism as seen in runners (Willwacher et al., Citation2016), where the motion of the arms and legs generate a rotation that is transferred through the body to the ground. With the foot fixed to the ground, a counter-rotation in the opposed direction is generated that acts bottom-up. The moment that is responsible for this phenomenon is described as the free (reaction) moment (FM). In running, the FM is an important factor that allows explaining knee-related overuse injuries (Willwacher et al., Citation2016). Wannop et al. (Citation2010) already investigated the FM in sidestepping and reported higher knee external rotation moments during 45° cutting manoeuvres when wearing high traction shoes, indicating an increased transfer of segmental rotation to the ground and reverse. Adding to this, high-traction shoes were shown to lower curve sprinting performance when exceeding a critical traction value (Luo & Stefanyshyn, Citation2011). It was concluded that the musculoskeletal system cannot stabilize the joints in the frontal plane which prevents the athlete from a further performance improvement. Interestingly, the FM was very rarely investigated in sidestepping research with a joint injury focus. In an exploratory analysis by Robinson and Donnelly (Citation2017) a significant correlation between the FM during 45° cutting manoeuvres and the knee joint moments were reported for the weight acceptance phase. However, they concluded that the small number of subjects are limiting their results and it remained unclear whether the athlete’s movement strategy contributes to the relationship between FM and knee joint loading (Robinson & Donnelly, Citation2017). The FM in their study had the same orientation as the direction of rotation of the sidestepping manoeuvre. This is contrasting the findings of Jindrich et al. (Citation2006), that reported braking forces during sidestepping. Although not reported, these braking forces have to be associated with an FM that acts against the direction of rotation of the manoeuvre as they limit the rotation of the athlete’s body.
Also, it is still unknown if sidestepping angles of more than 45° will increase the effect of the FM on ACL relevant knee joint loading.
To our knowledge, the relationship between the athlete’s movement strategy and the generation of FMs was not investigated so far. Due to the novelty of the FM as a parameter in the sidestepping literature, this study aims in investigating the behaviour of the FM in different movement strategies during full effort 90° cutting manoeuvres. It is hypothesized, that according to the reported findings, as well FMs that support the rotation of the change of direction as such that limit the rotation of the athlete’s body can be generated during a 90° sidestepping manoeuvre. The orientation of the FM is likely to be depending on an athlete’s individual movement strategy. Further, due to the increased amount of rotation needed to fulfil a 90° cutting manoeuvre, it is hypothesized, that the effect of the FM on knee joint loading will increase when compared to the reported results during 45° sidestepping.
2. Materials and methods
This study was designed as cross-sectional and observational. The kinematics and kinetics of anticipated full effort 90° sidestepping manoeuvres to the athlete’s preferred movement direction were captured by using an optoelectronic motion capture system and force plates and an inverse dynamics approach.
2.1 Participants
52 athletes of a dataset used in a previous publication (David et al., Citation2017) with 228 valid trials in total were included in this study (female: 30, age: 22.2 ± 3.0 years, height: 1.7 ± 0.1, mass: 65.0 ± 6.2 kg; male: 22, age: 22.9 ± 3.5, hight: 1.8 ± 0.1 m, weight: 76.3 ± 10.0 kg). The included participants were all actively participating in various disciplines such as team sports (soccer, basketball, team handball) or track and field (sprinting and jumping). All athletes were free of injury and pain without any history of major injuries. The study was approved by the Ethical Committee of the German Sport University Cologne and all participants provided their informed written consent to participate. After a self-selected warm-up and several trials to control whether the testing procedure was understood, each athlete performed a minimum of 5 valid trials of 90° sidestepping manoeuvres to their preferred direction with maximum effort (approach distance ~3 m).
2.2 Apparatus and data analysis
For better comparability of the shoe-surface traction values, all athletes were using the same indoor soccer shoes (Under Armour Speed Force ID). The floor was covered with conventional PVC flooring. The trajectories of 28 lower limb marker trajectories and ground reaction forces of the execution and first acceleration step were recorded in a 3D motion capture setup with 14 cameras (200 Hz, Vicon, Oxford, UK) and 2 force plates (1000 Hz, Kistler, Winterthur, Switzerland).
To simplify the postprocessing and avoid mistakes with regards to orientations of the FM and the movement directions, we mirrored all marker positions and rotated the ground reaction forces and moments around the global reference frame of athletes who used the right as the execution leg to correspond to a sidestep to the right with the left leg being the execution leg as displayed in . For the rest of this paper, we refer to the orientation of the athlete’s rotation as clockwise and a positive FM to have the same orientation.
Figure 1. Laboratory set up and orientations. Left: All athletes performed planned full effort 90° sidestepping manoeuvres. GRF was recorded for the execution (EXEC) and depart contact. The free moments, transverse foot and segment orientation, as well as knee joint loading characteristics, were calculated and time normalized within the contact phase of the EXEC contact. Right: A positive FM is associated with a rotation towards the new movement direction, while a negative FM acts against this direction of rotation
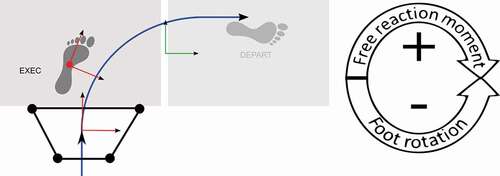
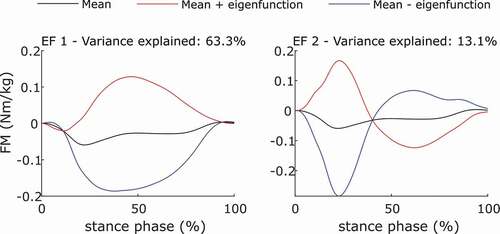
Figure 2. Representative curves for the first 2 Principal component’s modes of variation explaining a total of 90% of the variation present in the current dataset. The first eigenfunction describes the general positive or negative orientation of the FM, which already accounts for 63.3% of the variation. The second eigenfunction describes a change of the orientation during the first 50% of stance, adding another 13.1% of explained variation
Inverse kinematics and dynamics calculations were carried out with a 15-segments anatomic-landmark-scaled Lower-Body-Model (Lund et al., Citation2015) in the AnyBody™ Modelling Software (Version 6.0, AnyBody Technology, Aalborg, Denmark) to determine the kinematics and kinetics. The joint centres and coordinate systems of the hip and ankle joint were modelled according to the ISB recommendations (Wu et al., Citation2002) while the knee joint was defined with reference to Pennock and Clark with three degrees of freedom (Pennock & Clark, Citation1990). To better represent the athlete’s individual properties, the model anthropometry was adapted according to Hanavan (Citation1964) using the measures as input that were taken before the testing.
The GRFs and marker trajectories were filtered with a recursive second order low pass filter and a cut-off frequency of 20 Hz (Kristianslund et al., Citation2012). For final data analysis Matlab (2018a, Mathworks, Natick, USA) was used. The FM of the ground reaction force was estimated during the ground contact of the execution step () using the following equation:
Where Mz is the Moment around the origin of the force platform, COPx and COPy are the centre of pressure coordinates and Fy and Fx are the horizontal shear forces.
The FM is expressed as reaction moments normalised to body mass (Wannop et al., Citation2010). According to the sign convention, a positive FM resists an external rotation of the foot and has the same orientation as a clockwise rotation of the athlete’s body ().
To understand the relationship between an athlete’s specific movement strategy and the generation of FM patterns, the FM (Nm/kg), the orientation of the pelvis and the foot segment in the global transverse plane (°) were calculated (). An increasing foot and pelvis angle is representing a rotation of the segments towards the new movement direction. The left leg’s external 3D knee joint moment (flexion (+)/ extension (-), abduction (+)/ adduction (-), internal (+)/ external rotation (-), Nm/kg) and the 3D knee joint reaction force (anterior (+)/ posterior (-), lateral (+)/ medial (-), vertical, N/kg, expressed in the shank coordinate system, Richards et al., Citation2018) as surrogate measures for knee joint loading, were extracted from the model results to analyse their interaction with the FM. All the above-mentioned parameters were time normalized to the contact phase of the execution contact.
The statistical analysis consisted of two parts: (1) using a data reduction procedure to understand the general characteristics of the FM waveforms and allow for their interpretation and (2) regression analysis to test whether joint loading is predictable from FM data.
2.2.1. Functional principal component analysis
The interpretation of the FM waveforms is complex due to the large variability of their shapes ()). By plotting all of them it is difficult to identify certain characteristics (e.g., direction, typical progression). One way of extracting representative modes of this variation is by using Functional principal component analysis (FPCA, (Jones & Rice, Citation1992)). Using this method will result in a subset of functions, the so-called eigenfunctions, that will represent different groups of curves of the original dataset each, enabling the understanding of general curve behaviour and characteristics (Jones & Rice, Citation1992). FPCA was therefore used to extract the general characteristics of the 228 FM waveforms of the 52 athletes.
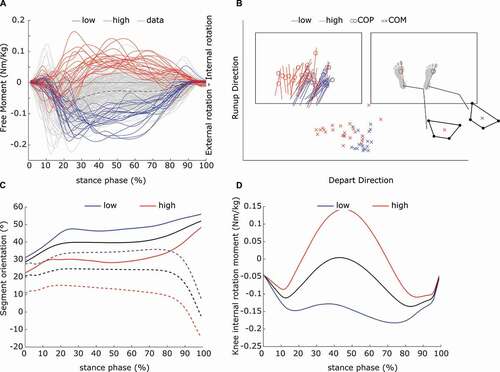
Figure 3. (A) FM waveforms of the 228 included trials (grey), the mean FM (black dashed line), the waveforms of the highest 10% (red) and lowest 10% (blue) of the Eigen scores of the first principal component. (B) left: average location of the COP, COM and foot axis of the top (red) and bottom (blue) 10% trials during the weight acceptance phase. The right side displays two examples of high and low score trials highlighting the relationship between foot orientation and body location. (C) Progression of the transverse pelvis (solid lines) and foot (dashed lines) orientation during EXEC. Red lines represent trials with the 10% highest PC scores, blue lines the bottom 10%. The mean progression is displayed in black. (D) Average knee internal rotation moment of the top (red) and bottom (blue) 10% of the trials. The mean progression is displayed in black
The FPCA is a useful tool for the aim of displaying typical curve characteristics as it is a procedure for dimension reduction. First, it estimates the total variability within the dataset. Then, each of the 228 curves can be represented by a single score of the eigenfunctions, expressing the ranking within this variation, which can be used for further analysis. These scores can be utilized to identify particular curves which clearly demonstrate the form and extent of that variation (Jones & Rice, Citation1992). The interpretation of the different eigenfunction was carried out based on the mean FM, and the top and bottom 10% of the scores (Jones & Rice, Citation1992) and their respective waveforms. By using this approach, it is not necessary to group the parameters used in this study (e.g high joint load vs. low joint load) as the FPCA scores allow to respect the continuity of them.
2.2.2. Canonical correlation analysis
To understand the effect of the FM on the knee joint loading a canonical correlation analysis (cca, Pataky et al., Citation2013), the SPM vector-field equivalent of linear regression (α = 0.05), was performed with the negative peak FM during the weight acceptance (WA) phase (first 30% of stance) and the time-varying 3D knee joint moment vectors (Mz-x-y) and knee joint reaction forces (JRFz-y-x) respectively as input parameters. The negative peak FM was chosen as the grand mean of FMs was negative during the WA phase (). This is in contrast to the study of Robinson and Donnelly (Citation2017). Robinson and Donelly which performed a similar analysis on 45° sidestepping but used the positive peak FM during the cca. However, they reported mainly positive FM during the WA phase. In case of a significant cca result, post hoc analysis was performed using ccas on the 2D moment and JRF vector couples (Mz-x, Mz-y, Mx-y, JRFz-x, JRFz-y. JRFx-y) and regression analysis of the single vectors with a Bonferroni corrected alpha level (α = 0.02).
3. Results
3.1 Functional principal component analysis (FPCA)
The first four eigenfunctions determined by the FPCA explained 90% of the variance in the FM (Appendix). To ease the interpretation of the extracted eigenfunctions (EF), displays the effect of the first two eigenfunctions on the grand mean of the FM. The first eigenfunction explained 63.3% of the variance by modulating the general internal/external rotation characteristic of the FM curve. The eigenfunctions two to four resulted in an oscillating behaviour of the mean curve. These oscillations can be described by their periods, lasting from approximately 100% (EF 2), over 66% (EF 3) to 50% (EF 4) of stance time. The scores of the first eigenfunction ranged from 64.9 to −57.7.
As this study focuses on a general understanding of the interaction between the FM and an athlete’s individual movement strategy, only the first two eigenfunctions will be discussed, which already explain 76.6% of the total variation of the dataset. The first eigenfunction described the general positive and negative characteristic of the FM time series. This means that the athletes were exposed either to a positive (clockwise) or negative (counter-clockwise) FM although executing the same movement task towards the same direction. Further, the investigation of those trials with the highest PC scores (top 10%) of the first eigenfunction revealed a low preorientation of the foot at initial touch down (10.9 ± 14.7°) with a trend towards an external rotation of the foot segment stance (). Conversely, trials with the lowest PC scores (bottom 10%) showed a comparably higher amount of preorientation of the foot segment towards the new movement direction at initial touch down (27.7 ± 10.0°) and a slight increase of the internal rotation after the WA phase (). The appearance of both negative and positive FMs can be mechanically explained by the location and the orientation of the foot and COP relative to the COM. The foot rotates around the COP while the force of the moving body acts at the shank-foot interception. In the case of the high score trials (), red), this interception is located medially relative to the COP. Therefore, the foot is forced into an external rotation, which causes a positive free reaction moment. In contrast to that, the low scoring trials (), blue) show a location of the shank-foot interception lateral to the COP, therefore causing an internal rotation of the foot, with a negative free reaction moment.
Analogous behaviour was observed for the pelvis segment, where high scores were related to less preorientation towards the new movement direction (22.6 ± 11.2°). However, athletes with a high amount of preorientation (31.4 ± 7.7°) were exposed to a negative FM moment.
The second eigenfunction explained an additional 13.1% of the variance of the FM. As shown in , the EF2 described the oscillating behaviour of the FM with one change of sign during ground contact. Investigating the FMs that scored in the top and bottom 10% of EF2, reveals that trials with a high score show a tendency to positive FM within the WA Phase, while low scoring FMs are negative in this phase.
3.2. Canonical correlation analysis
The negative peak FM occurred at 20.6 ± 7.4% of the stance phase which is within the weight acceptance phase (WA phase). The cca detected a significant correlation between the negative peak FM and the 3D knee joint moment vector within the WA phase (2.4–41.2% of stance, p < 0.001), during midstance (53.8–81.7%, p < 0.001) and even during the final push off (92.4–100% of stance, p = 0.022) of the execution contact (). The following post hoc analysis uncovered, that this correlation was explained by all three moment couples during the WA phase (p < 0.001 to p = 0.005, ). Further, the regression analysis on the single motion planes showed a significant relationship between the FM and the knee’s internal rotation (p < 0.001) and adduction moment (p = 0.006), whereas no such relationship on the flexion moment was detected. The positive relationship indicated that a positive FM is associated with an increased internal rotation and adduction moment.
Figure 4. Top row: Result of the cca on the negative peak FM and the 3D knee joint moment vector. The analysis detected a significant correlation between 2.4–41.2%, 53.8–81.7%, p < 0.001 and 92.4–100% of stance, which is expressed as suprathreshold clusters. The focus of this analysis is on the WA phase, highlights as the light grey shaded area. Middle row: Posthoc analysis revealed significant correlations for all moment couples and the FM, while further post hoc testing detected the frontal and transverse knee joint moments (bottom row) as the dominant contributors of the correlation
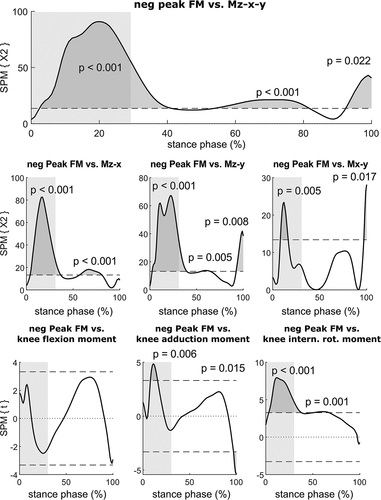
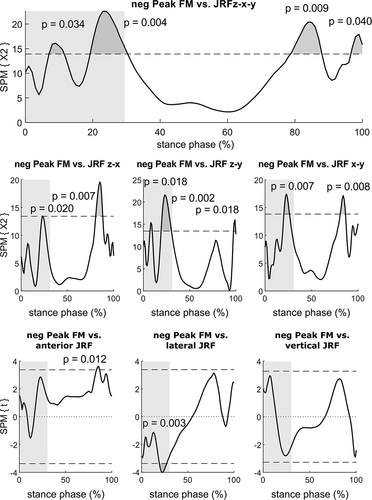
The cca on the negative peak FM vs. the 3D knee joint reaction forces also revealed a significant relationship during the WA phase (7.0–11.5%, p = 0.034 and 19.2–30.4%, p = 0.004, ). The post hoc analysis showed that this relationship is mainly explained by the JRF z-y (p = 0.002) and JRF x-y couples (p = 0.007), with the JRF y component potentially being dominant (). The medio-lateral JRF is dominantly explaining this relationship (p = 0.003) as shown by the regression analysis. As the relationship was negative, a positive FM is associated with a medially acting JRF (forcing towards knee abduction, ).
Figure 5. Top row: Result of the cca on the negative peak FM and the 3D knee joint reaction force vector. The analysis detected a significant correlation during the WA Phase (7.0–11.5%, 19.2–30.4% of stance), which is expressed as suprathreshold clusters. The focus of this analysis is on the WA phase, highlights as the light grey shaded area. Middle row: Posthoc analysis revealed significant correlations for all reaction force couples and the FM, while further post hoc testing detected the frontal knee joint reaction forces (bottom row) as the dominant contributor of the correlation
4. Discussion
The investigation of the FM by using FPCA identified the different features of the characteristics of the FM across all trials of the 52 subjects. Interestingly, the execution of the same task resulted in FMs with a different orientation, which supports our first hypothesis (). By linking the FPCA scores of the FM to lower limb segment orientations (foot and pelvis) and the knee’s internal rotation moment, it was possible to understand that a negative (counter-clockwise) FM that was reported for athletes that used a movement strategy with a high preorientation towards the new movement direction will hold off the rotation of the body (). Although this might be a disadvantage at first sight, this is likely to be mechanically useful. Jindrich et al. (Citation2006) discussed the function of braking forces during 45° and 60° cutting manoeuvres in a simulation study. They argued, that the presence of braking forces will prevent the athlete from over-rotation. This hypothesis was supported by the results of their model calculation, supposing that without these – in their case – braking forces the rotation angle would have been 1.4–3 times higher. This is one possible explanation why the athletes in the present study do not show a considerable increase in pelvis rotation towards the new movement direction after the WA phase (8.2 ± 7.3°) while athletes with a positive (clockwise) FM clearly show rotational behaviour (17.5 ± 8.4°) especially in the last 30% of stance ()). Further, a sign change of the FM, indicated by EF2 can be explained by the movement strategy during contact as well. As described before, athletes that show a negative FM during the WA phase experience a deceleration of their initial body rotation as a reaction. This deceleration has to be counteracted by the athlete as their aim was to turn around 90°. In contrast to that, athletes that show a positive FM in the beginning, do so because of the relative position of the COP, the shank-foot interception and the COM. These athletes actively generate the rotation of the body by contraction of the hip surrounding muscles leading to an increase in hip abduction (David et al., Citation2018). This initiation of the rotation has to generate a counteracting moment on the ground, keeping in mind, the position of the foot relative to the body. The reaction of such an active rotation of the body is a negative (counter-clockwise) FM and therefore explains the sign change from positive to negative.
It was hypothesized that the FM will also affect lower limb joint loading and therefore contribute to ACL injury risk-relevant loading that was linked to specific movement strategies. The identification of high and low scoring trials with regards to the internal rotation moment at the knee joint supported this idea because a positive FM is associated with an internal rotation moment at the knee joint () which is functionally increasing the load on the ACL.
Going one step further, it can be assumed, that an early rotation of the body is a top-down strategy to change direction during running. A previous paper on the used dataset showed that the preorientation towards the new movement direction is already introduced during the penultimate step of the manoeuvre (David et al., Citation2018). It is therefore conceivable that the generated negative (counter-clockwise) FM limits a further clockwise rotation of the body that was initialized before touch down. In contrast to that, without preorientation, the FM might contribute to the initiation of the rotation of the body. This can be described as a bottom-up strategy. However, Jindrich et al. (Citation2006) reported this only for the function of the braking forces and the impact of the FM is likely to be much smaller due to the lower amounts. The study of Wannop et al. (Citation2010) on different show traction values showed that the FM is transferred to the shank segment and can cause changes in the knee joint moment. However, the amount of added loading still has to be discussed. In this study, the FM reached similar values as the knee internal rotation moment (peak values of the FM range between ± 0.15 Nm*kg−1).
The canonical correlation analysis showed that it is possible to use the FM to predict the 3D knee joint loading patterns and therefore the potential for ACL injury risk. This result was also shown for 45° sidestepping (Robinson & Donnelly, Citation2017) but with less correlation strength during the WA phase. The results of the current paper show that the effect of the FM in 3D knee joint loading is higher with an increased cutting angle. While Robinson and Donnelly (Citation2017) only reported a significant relationship between 6% and 8% of stance for 45° sidestepping, the results on 90° sidestepping showed a significant relationship between 2% and 41% which covers the whole WA phase. This might not be surprising as the amount of rotational forces should increase with increasing cutting angles. The investigation of the FM has a positive aspect of not being related to any model calculations. Therefore, measurements between studies are comparable.
One of the most important findings of this study is the high variability of the FM even within an athlete. This result, on the one hand, shows, that the athlete can change the orientation of the FM by adapting the movement strategy. On the other hand, it tells us that averaging an athlete’s trials or grouping athletes due to global parameters like sex or skill level, might cover important findings.
However, the interpretation of the FM is not as easy as it is affected by several external factors. The shoe-surface traction is highly dependent on the area of the foot that is in contact with the floor (Holden & Cavanagh, Citation1991). Athletes with an eversion of the foot, might not generate high FMs. Also, rear- vs forefoot strike patterns have to be taken into account. In earlier studies, it was shown that preorientation of the foot and pelvis towards the new movement direction is strongly related to foot strike patterns, with rearfoot striking being present in athletes with a low preorientation of the pelvis and foot segment (David et al., Citation2017). Another factor is the design of the sole, which usually provides high traction values only in selected directions. Although all athletes were using the same shoe model for this study this might have biased the outcome of this study.
For this study, the single trials of the athletes were used as input for the FPCA analysis instead of using the average per athlete. This might lead to a bias in the results as this can affect the relationship between parameters due to the within-subject dependency of the trials. However, the nature of sidestepping datasets is high within and between-subject variability. By averaging the trials of one subject there is a high probability, that the resultant time series does not match any of the original trials anymore. Further, the FPCA scores can be used to describe the within-subject variability by using the span of the scores (Preatoni et al., Citation2013).
5. Conclusion
The findings of this study add valuable detail to our current understanding of the causes of knee joint overloading in athletes, that are using a movement strategy without considerable preorientation of the foot and trunk segments. Additionally, this understanding can help to design footwear and especially cleats configurations, that modify the FM where needed. However, the most important finding is that we should not group athletes based on global characteristics. The findings of this study displayed, that the same movement can be achieved by oppositely directed forces. Therefore, within-subject variation and between-subject differences should be considered when grouping athletes and investigations on specific athlete motion are needed to fully understand this complex task. Using appropriate statistical tools to analyse a multi-component dataset is necessary to uncover important factors and to consider the continuous nature of most parameters instead of creating artificial sub-groups.
Acknowledgments
Special thanks go to Under Armour who sponsored the shoes for this project.
Disclosure statement
The author(s) confirm there are no relevant financial or non-financial competing interests to report.
References
- David, S., Komnik, I., Peters, M., Funken, J., & Potthast, W. (2017). Identification and risk estimation of movement strategies during cutting maneuvers. Journal of Science and Medicine in Sport, 20(12), 1075–1080. https://doi.org/https://doi.org/10.1016/j.jsams.2017.05.011
- David, S., Mundt, M., Komnik, I., & Potthast, W. (2018). Understanding cutting maneuvers – The mechanical consequence of preparatory strategies and foot strike pattern. Human Movement Science, 62, 202–210. https://doi.org/https://doi.org/10.1016/j.humov.2018.10.005
- Dempsey, A. R., Lloyd, D. G., Elliott, B. C., Steele, J. R., & Munro, B. J. (2009). Changing sidestep cutting technique reduces knee valgus loading. The American Journal of Sports Medicine, 37(11), 2194–2200. https://doi.org/https://doi.org/10.1177/0363546509334373
- Hanavan, E. P., JR. (1964). A mathematical model of the human body. DTIC Document. Wright-Patterson Air Force Base, Ohio: Aerospace Medical Research Laboratories. http://www.dtic.mil/docs/citations/AD0608463
- Havens, K. L., & Sigward, S. M. (2015). Joint and segmental mechanics differ between cutting maneuvers in skilled athletes. Gait & Posture, 41(1), 33–38. https://doi.org/https://doi.org/10.1016/j.gaitpost.2014.08.005
- Holden, J. P., & Cavanagh, P. R. (1991). The free moment of ground reaction in distance running and its changes with pronation. Journal of Biomechanics, 24(10), 887–897. https://doi.org/https://doi.org/10.1016/0021-9290(91)90167-L
- Hootman, J. M., Dick, R., & Agel, J. (2007). Epidemiology of collegiate injuries for 15 sports: Summary and recommendations for injury prevention initiatives. Journal of Athletic Training, 42(2), 311–319. https://pubmed.ncbi.nlm.nih.gov/17710181/
- Jindrich, D. L., Besier, T. F., & Lloyd, D. G. (2006). A hypothesis for the function of braking forces during running turns. Journal of Biomechanics, 39(9), 1611–1620. https://doi.org/https://doi.org/10.1016/j.jbiomech.2005.05.007
- Jones, M. C., & Rice, J. A. (1992). Displaying the important features of large collections of similar curves. The American Statistician, 46(2), 140. https://doi.org/https://doi.org/10.2307/2684184
- Kristianslund, E., Krosshaug, T., & van den Bogert, A. J. (2012). Effect of low pass filtering on joint moments from inverse dynamics: Implications for injury prevention. Journal of Biomechanics, 45(4), 666–671. https://doi.org/https://doi.org/10.1016/j.jbiomech.2011.12.011
- Lund, M. E., Andersen, M. S., Zee, M. D., & Rasmussen, J. (2015). Scaling of musculoskeletal models from static and dynamic trials. International Biomechanics, 2(1), 1–11. https://doi.org/https://doi.org/10.1080/23335432.2014.993706
- Luo, G., & Stefanyshyn, D. (2011). Identification of critical traction values for maximum athletic performance. Footwear Science, 3(3), 127–138. https://doi.org/https://doi.org/10.1080/19424280.2011.639807
- Mclean, S. G., Huang, X., Su, A., & van den Bogert, A. J. (2004). Sagittal plane biomechanics cannot injure the ACL during sidestep cutting. Clinical Biomechanics, 19(8), 828–838. https://doi.org/https://doi.org/10.1016/j.clinbiomech.2004.06.006
- Mclean, S. G., Huang, X., & van den Bogert, A. J. (2005). Association between lower extremity posture at contact and peak knee valgus moment during sidestepping: Implications for ACL injury. Clinical Biomechanics, 20(8), 863–870. https://doi.org/https://doi.org/10.1016/j.clinbiomech.2005.05.007
- Mclean, S. G., Huang, X., van den Bogert, A. J., & Mclean, S. G. (2008). Investigating isolated neuromuscular control contributions to non-contact anterior cruciate ligament injury risk via computer simulation methods. Clinical Biomechanics (Bristol, Avon), 23(7), 926–936. https://doi.org/https://doi.org/10.1016/j.clinbiomech.2008.03.072
- McLean, S. G., Walker, K. B., & van den Bogert, A. J. (2005). Effect of gender on lower extremity kinematics during rapid direction changes: An integrated analysis of three sports movements. Journal of Science and Medicine in Sport, 8(4), 411–422. https://doi.org/https://doi.org/10.1016/S1440-2440(05)80056-8
- Moses, B., Orchard, J., & Orchard, J. (2012). Systematic review: Annual incidence of ACL injury and surgery in various populations. Research in Sports Medicine (Print), 20(3–4), 157–179. https://doi.org/https://doi.org/10.1080/15438627.2012.680633
- Pataky, T. C., Robinson, M. A., & Vanrenterghem, J. (2013). Vector field statistical analysis of kinematic and force trajectories. Journal of Biomechanics, 46(14), 2394–2401. https://doi.org/https://doi.org/10.1016/j.jbiomech.2013.07.031
- Patla, E. A., Adkin, A., & Ballard, T. (1999). Online steering: Coordination and control of body center of mass, head and body reorientation. Experimental Brain Research, 129(4), 629–634. https://doi.org/https://doi.org/10.1007/s002210050932
- Pennock, G. R., & Clark, K. J. (1990). An anatomy-based coordinate system for the description of the kinematic displacements in the human knee. Journal of Biomechanics, 23(12), 1209–1218. https://doi.org/https://doi.org/10.1016/0021-9290(90)90378-G
- Preatoni, E., Hamill, J., Harrison, A. J., Hayes, K., van Emmerik, R. E. A., Wilson, C., & Rodano, R. (2013). Movement variability and skills monitoring in sports. Sports Biomechanics/International Society of Biomechanics in Sports, 12(2), 69–92. https://doi.org/https://doi.org/10.1080/14763141.2012.738700
- Richards, R. E., Andersen, M. S., Harlaar, J., & van den Noort, J. C. (2018). Relationship between knee joint contact forces and external knee joint moments in patients with medial knee osteoarthritis: Effects of gait modifications. Osteoarthritis and Cartilage, 26(9), 1203–1214. https://doi.org/https://doi.org/10.1016/j.joca.2018.04.011
- Robinson, M. A., & Donnelly, C. J. (2017). An exploratory analysis correlating force plate free moments and multi-component knee moments during sidestepping. In Proceedings of the XXVI Congress of the International Society of Biomechanics (p. 71), Brisbane, Australia.
- Sheppard, J. M., & Young, W. B. (2006). Agility literature review: Classifications, training and testing. Journal of Sports Sciences, 24(9), 919–932. https://doi.org/https://doi.org/10.1080/02640410500457109
- Waldén, M., Hägglund, M., Magnusson, H., & Ekstrand, J. (2016). Acl injuries in men’s professional football: A 15-year prospective study on time trends and return-to-play rates reveals only 65% of players still play at the top level 3 years after ACL rupture. British Journal of Sports Medicine, 50(12), 744–750. https://doi.org/https://doi.org/10.1136/bjsports-2015-095952
- Wannop, J. W., Worobets, J. T., & Stefanyshyn, D. J. (2010). Footwear traction and lower extremity joint loading. The American Journal of Sports Medicine, 38(6), 1221–1228. https://doi.org/https://doi.org/10.1177/0363546509359065
- Willwacher, S., Goetze, I., Fischer, K. M., & Brüggemann, G.-P. (2016). The free moment in running and its relation to joint loading and injury risk. Footwear Science, 8(1), 1–11. https://doi.org/https://doi.org/10.1080/19424280.2015.1119890
- Wu, G., Siegler, S., Allard, P., Kirtley, C., Leardini, A., Rosenbaum, D., Whittle, M., D’Lima, D. D., Cristofolini, L., Witte, H., Schmid, O., & Stokes, I. (2002). ISB recommendation on definitions of joint coordinate system of various joints for the reporting of human joint motion—part I: Ankle, hip, and spine. Journal of Biomechanics, 35(4), 543–548. https://doi.org/https://doi.org/10.1016/S0021-9290(01)00222-6