
ABSTRACT
This study aimed to a) determine whether wrist acceleration varies by accelerometer brand, wear location, and age for self-paced “slow”, “normal” and “brisk” walking; b) develop normative acceleration values for self-paced walking and running for adults. One-hundred-and-three adults (40–79 years) completed self-paced “slow”, “normal” and “brisk” walks, while wearing three accelerometers (GENEActiv, Axivity, ActiGraph) on each wrist. A sub-sample (n = 22) completed a self-paced run. Generalized estimating equations established differences by accelerometer brand, wrist, and age-group (walking only, 40–49, 50–59, 60–69, 70–79 years) for self-paced walking and running. Brand*wrist interactions showed ActiGraph dominant wrist values were ~10% lower than GENEActiv/Axivity values for walking and running, and non-dominant ActiGraph values were ~5% lower for running only (p < 0.001). Acceleration during brisk walking was lower in those aged 70–79 (p < 0.05). Normative acceleration values (non-dominant wrist, all brands; dominant wrist GENEActiv/Axivity) for slow and normal walking were 140 mg and 210 mg. Brisk walking, values were 350 mg in those aged 40–69 years, but 270 mg in those aged 70–79 years. Accelerations >600 mg approximated running. These values facilitate user-friendly interpretation of accelerometer-determined physical activity in large cohort and epidemiological datasets.
Introduction
When wearable accelerometers are used to assess physical activity, a cut-point approach is frequently used to translate the data into clinically meaningful outcomes, e.g., time spent in moderate-to-vigorous physical activity (MVPA) or brisk walking. However, there are multiple cut-points available in the literature, meaning that data are often not comparable between studies. For example, estimates of the percentage of adults meeting the MVPA guidelines can vary from 5 to 98%, depending on which cut-points are used (Loprinzi et al., Citation2012). Similar variation exists when comparisons are made for children with the percentage meeting the guidelines varying from 8% to 98% (Migueles et al., Citation2019a).
Cut-point values frequently used to classify adults’ MVPA from raw accelerometer data (milli-gravitational units (mg)) typically come from relatively small laboratory studies (Duncan et al., Citation2020; Esliger et al., Citation2011; Fraysse et al., Citation2020; Hildebrand et al., Citation2014). A recent paper applied the widely used 100 mg MVPA cut-point (Hildebrand et al., Citation2014) for wrist worn accelerometers, to describe accelerometer-determined physical activity levels in people with chronic disease in the UK Biobank prospective cohort study (Barker et al., Citation2019a), the most extensive study to date to incorporate device-based measures of physical activity (Doherty et al., Citation2017). In a commentary on the paper, Dibben et al. (Citation2019) suggested that in people with chronic disease, e.g., heart failure, the MVPA acceleration cut-point should be closer to 50 mg, reflecting this population’s reduced exercise capacity. They subsequently applied this lower cut-point to data from participants with heart failure (Dibben et al., Citation2020). Using population-specific cut-point values has been suggested previously, e.g., in relation to age-group and/or obesity status, wherein lower acceleration values for a given activity intensity were seen for slightly older obese individuals compared with younger healthy individuals (Aadland & Anderssen, Citation2012). Whilst acknowledging the point, the response to the commentary highlighted that this would not be possible until population-specific values for accelerometer data were available (Barker et al., Citation2019b).
Accelerometer data can also be translated in terms of indicative activities, e.g., time spent walking. As little as 10 minutes per day of device-measured brisk walking has been shown to reduce the risk of premature mortality (Chudasama et al., Citation2019). Self-reported brisk walking has also been associated with improved all-cause and cardiovascular mortality outcomes in middle-aged and older people (Stamatakis et al., Citation2018; Yates et al., Citation2017). Walking is an activity which is familiar to many people and easy to interpret at a population level. However, as people get older, the walking speed they perceive as “brisk” tends to decrease, reflecting lower physical fitness and reduced exercise capacity (Bohannon & Andrews, Citation2011; Himann et al., Citation1988). This is reflected in the preferred walking speed being lower in adults who are older (Karavirta et al., Citation2020). Thus, establishing acceleration values associated with self-paced walking and running across different age groups would enable simple, but age-appropriate, translation of accelerometer-determined outcomes in large epidemiological datasets such as the UK Biobank.
In addition to the potential influence of age, device brand and wear location also affect the acceleration generated when walking and running (Rowlands et al., Citation2019b). Three research-grade accelerometer device brands recently used in sizeable physical activity studies are the GENEActiv, Axivity and ActiGraph (Brady et al., Citation2019; Doherty et al., Citation2017; Troiano, Citation2005), with the Axivity device used to collect accelerometer data in UK Biobank. When processed identically, physical activity outcomes from the GENEActiv device have previously been shown to be comparable to the Axivity device (Rowlands et al., Citation2018); however, the ActiGraph device appears to generate a lower acceleration value, particularly on the dominant wrist (Rowlands et al., Citation2019b). The UK Biobank uses the Axivity at the dominant wrist, and the National Health and Nutrition Examination Survey (NHANES) uses the ActiGraph at the non-dominant wrist (Doherty et al., Citation2017; Troiano, Citation2005). Current evidence is inconsistent on whether there is a disparity between accelerometer outcomes measured at the dominant and non-dominant wrist (Duncan et al., Citation2020). Thus, it is important to consider the potential influence of age, device brand and wear location when generating normative values.
Previous research assessing the association between accelerometer output and ambulatory speed is largely based on laboratory-based protocols, metronomes to control the walking pace, and/or employed treadmills (Duncan et al., Citation2020; Esliger et al., Citation2011; Fraysse et al., Citation2020; Hildebrand et al., Citation2014). Using a treadmill is effective for standardising walking and running speed. However, the energy cost can be higher than during overground walking (Barnett et al., Citation2015; Parvataneni et al., Citation2009) and the co-ordination between upper and lower arm limbs may also differ (Carpinella et al., Citation2010). Gait speed assessed in a laboratory can also differ from that assessed in daily life (Van Ancum et al., Citation2018). Thus, data from self-paced outdoor walking would provide a dataset with greater ecological validity and generalisability (Tudor-Locke & Rowe, Citation2012).
The main aim of this study was to facilitate simple and meaningful translation of wrist worn accelerometer data. To do this, we aimed to a) determine whether wrist acceleration varies by age-group, accelerometer brand and wear location during self-paced “slow”, “normal” and “brisk” walking and self-paced running, and b) develop estimates of normative acceleration values for self-paced walking and running for adults aged 40–79 years for commonly used accelerometers when placed on the dominant or non-dominant wrist.
Methods
Participants and procedures
A convenience sample of 105 adults (40–79 years of age) was recruited via email, social media, and direct contact. Ethical approval was obtained from the University of Leicester’s College of Life Sciences ethics representatives in February 2019. Following informed consent, anthropometric measures were taken (height, mass, and body mass index (BMI)). Demographic variables (age, sex and ethnicity) were self-reported. Ethnicity was categorised as white European or other due to small numbers in the other categories of ethnicity. Age was categorised into four age groups: 40–49, 50–59, 60–69 and 70–79 years. Participants were fitted with three accelerometers on each wrist: ActiGraph Link, Axivity AX3 and GENEActiv. These devices have high inter-device reliability (Esliger et al., Citation2011; Ladha et al., Citation2013).
Participants completed three self-paced walks (slow, normal, and brisk) in a park along a hard path. Each participant completed the study visits individually. The walks were undertaken in order of ascending speed. For the slow walk, participants were asked to walk “at a pace they may use when strolling along chatting”, for the normal walk, to “walk at their preferred pace”, and for the brisk walk, to “walk at a pace that feels brisk or purposeful”. Next, participants were given the option of a self-paced run around the park. For the run, participants were asked to “maintain a comfortable and consistent pace which they could maintain for 5 km”. The start and end time of each walk and run was recorded and used to calculate walking speed.
Accelerometer setup and data processing
The accelerometers used were the Axivity AX3 (Axivity Ltd, Newcastle, UK), GENEActiv Original (Activinsights Ltd., Cambridgeshire, UK) and ActiGraph GT9X Link (ActiGraph LLC, Pensacola, FL, USA). The ActiGraph, Axivity and GENEActiv were worn on both wrists i.e., the participants wore six accelerometers in total. The first device was placed at the wrist, with a second proximal to this and a third attached on top of one of the first two devices, with the order of devices consistent between wrists for each participant. The relative position of each device was randomly generated for each participant. All accelerometers were synchronised to the computer clock to ensure consistency in identification of walk and run times. The monitors were initialised to collect data at 100 Hz with a dynamic range of ±8 g, where g is equal to the Earth’s gravitational acceleration. The Axivity devices were set up, data downloaded and saved in .cwa format with OmGui open-source software (OmGui Version 1.0.0.37, Open Movement, Newcastle, UK). The GENEActiv monitors were initialised, data downloaded and saved as .bin files using GENEActiv PC software version 3.2. The ActiGraph monitors were initialised, data downloaded and saved in raw format as .gt3x, then converted to .csv format for further processing, using ActiLife version 6.13.4.
All accelerometer data were processed using GGIR package in R version 1.10–7 (https://cran.r-project.org/web/packages/GGIR/) (Migueles et al., Citation2019b). The default GGIR settings were used to process the data and Euclidean Norm minus 1 g (ENMO, the vector magnitude taken from the three axes minus the value of gravity (g) (x2 + y2 + z2)1/2 – 1, with negative values rounded up to zero (Hildebrand et al., Citation2014)) was the accelerometer signal aggregation metric used. Signal processing in GGIR includes auto-calibration using local gravity as a reference (Van Hees et al., Citation2014), detection of sustained abnormally high values, calculation of the average magnitude of dynamic acceleration (i.e., the vector magnitude of acceleration corrected for gravity (ENMO) in milli-gravitational units (mg) averaged over 5 second epochs (Van Hees et al., Citation2014). Files were excluded if accelerometer files showed post-calibration error greater than 0.01 g (10 mg) (Rowlands et al., Citation2016).
Epoch level comma-separate values files (.csv) were generated and matched across monitors for each participant. The time period and accelerations associated with each walk/run were identified, and the mean acceleration for each walk/run was calculated. Each walk/run was trimmed by 20 seconds at the start and the end in order to account for acceleration and deceleration at the start and end of each walk/run. Average acceleration for each walk and run was reported in milli-gravitational units (mg).
Statistical analysis
Descriptive data were calculated for each variable using the mean (SD). Data were split by age group for the walking sample but presented for the whole group for running due to the low number of participants opting to undertake the run.
Acceleration during self-paced slow, normal and brisk walking
General estimating equation (GEE) models with an exchangeable correlation matrix, taking account of repeated measures was used to explore whether the acceleration (mg, dependent variable) at each walking pace (slow, normal, brisk) differed by accelerometer brand, and/or age group. As previous research suggests that brand differences may differ by placement (Hildebrand et al., Citation2014; Rowlands et al., Citation2019b), first we assessed whether associations between acceleration and pace for a given wrist (dominant/non-dominant) were moderated by device brand, using a “wear location * device brand” interaction term. There was a main effect for wear location (p = 0.002) and an interaction between wear location (dominant/non-dominant) and device brand (p < 0.001) (supplementary Table S1). The interaction showed that on the dominant wrist the ActiGraph produced a lower acceleration than either the GENEActiv or Axivity, while there was no significant difference on the non-dominant wrist. Hence, analyses were stratified by wear location (dominant and non-dominant wrist). Potential covariates included in the model were sex, height, and mass. The interaction between walking pace and age group was explored to determine whether normative values should differ by age group.
Acceleration during self-paced running
Similarly, GEE models were used to explore whether the acceleration (mg, dependent variable) during self-paced running differed by accelerometer brand. We assessed whether the acceleration during running for each wrist was moderated by device brand, using a “wear location * device brand” interaction term. There was a significant interaction between wear location (dominant/non-dominant) and device brand (p < 0.001) (supplementary Table S2). The interaction showed that on both wrists the ActiGraph produced a lower acceleration than either the GENEActiv or Axivity, however the difference was less on the non-dominant wrist than on the dominant wrist. Hence, analyses were stratified by wear location (dominant and non-dominant wrist). As the sample size was insufficient to break down into age-groups, age (years) was instead entered as a co-variate with sex, height, and mass.
All analyses were run using Stata 16 (StataCorp LP, Texas, USA).
Results
Descriptive information for the sample, including speed and acceleration for self-paced walking (by age-group) and self-paced running, can be seen in . Of the 105 participants consented into the study, two participants were excluded (one unable to complete the study visit in full and one removed due to device error). Therefore, 103 participants were included in the analysis. The running sample was a self-selected sub-sample of the walking dataset; 25 participants volunteered to complete the running protocol, and three were excluded (due to device error) resulting in 22 participants data for the analysis ().
Table 1. Participant characteristics, walking speed and acceleration during self-paced slow, normal and brisk walking and running. Values mean (standard deviation) or N [%]
Acceleration during self-paced slow, normal and brisk walking
Self-paced walking
Dominant wrist
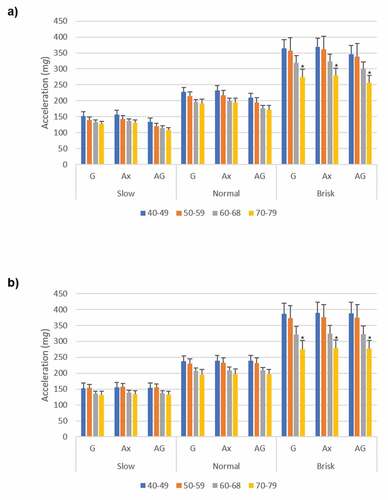
Mean (SD) acceleration for the slow, normal and brisk walk across the devices at the dominant wrist was 132.9 mg (46.3 mg), 202 mg (67.7 mg) and 323.9 mg (160.1 mg) respectively (values not shown in table). Adjusted means for the normal and brisk walks were 69.1 mg (95% CI: 61.6, 76.6 mg) and 191 mg (164.9, 217.2 mg) higher, respectively than the slow walk (both p < 0.001) (). The GENEActiv and Axivity devices were not significantly different; however, the mean acceleration measured by the ActiGraph device was 18.6 mg (26.0, 11.2 mg) lower (p < 0.001) ().
Table 2. Generalised estimating equation of acceleration for each walking pace (slow, normal, brisk) adjusted for clustering at participant level. Impact of device brand, age-group, sex, height, mass
The association between age group and acceleration was modified by walking pace category (p = 0.026), such that there was a significant difference in acceleration between age groups for brisk walking but not at slow or normal walking ()). For those aged 70–79 years, the acceleration for brisk walking was on average 89.7 mg (95% CI: 81.4, 97.9 mg, )) lower than those in the reference group (40–49 years).
Figure 1. Acceleration for each walking pace, by device brand and age group. Values are presented as marginal means with standard error bars: a) Dominant wrist b) Non-dominant wrist. * Indicates significantly different from slow walk. G = GENEActiv, Axe = Axivity, AG = ActiGraph. Values are adjusted for sex, height and mass.
Non-dominant wrist
Mean (SD) acceleration for the slow, normal and brisk walk across the devices at the non-dominant wrist was 145 mg (56 mg), 218.2 mg (82.1 mg) and 333.9 mg (179.3 mg) respectively (values not shown in table). Adjusted means for the normal and brisk walks were 73.2 mg (95% CI: 65.3, 81.2 mg) and 194.9 mg (167.4, 222.5 mg) higher, respectively than the slow walk (both p < 0.001) (). In contrast to the dominant wrist, no significant difference was seen between the device brands.
Consistent with the dominant wrist, the association between age group and acceleration was modified by walking pace category, (p = 0.005), with a significant difference in acceleration between age groups for brisk walking but not slow or normal walking ()). In 70–79 year olds, the acceleration for brisk walking was on average 110.7 mg (95% CI: 95.1, 126.4 mg) lower than those in the reference group (40–49 years).
Self-paced running
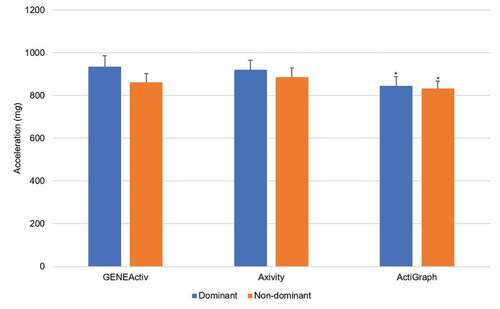
Mean (SD) acceleration for self-paced running across the devices was 900.2 mg (225.8 mg) at the dominant wrist and 859.9 mg (192.5 mg) at the non-dominant wrist (values not shown in table). Consistent with walking, the GENEActiv and Axivity devices were not significantly different at either wrist. However, the mean acceleration measured by the ActiGraph device was 89.2 mg (121.1, 57.3 mg) lower (p < 0.001) at the dominant wrist and 28.8 mg (48.1, 9.5 mg) lower (p = 0.003) at the non-dominant wrist ().
Table 3. Generalised estimating equation of acceleration for running on each device brand (GENEActiv, Axivity, ActiGraph) adjusted for clustering at participant level. Impact of wear location age, sex, height, mass
Normative acceleration values for self-paced walking and running
Consistent normative acceleration values for interpreting/translating accelerometer data in terms of self-paced slow and normal walking are appropriate for those aged 40–79 years. However, based on the findings from the interaction model, for brisk walking it is appropriate to present the normative values based on age: those aged up to 69 years and those aged 70 years and over. Regarding device brand and wear location, there were no significant differences for self-paced walking, with the exception of the ActiGraph worn at the dominant wrist which was approximately 10% lower (, )). Thus, to facilitate simple translation of accelerometer data, we present estimates of normative acceleration appropriate for all three accelerometer brands worn on the non-dominant wrist, and the GENEActiv or Axivity worn on the dominant wrist. For slow and normal walking normative values are for appropriate for all age groups (40–79 years). For brisk walking, normative values are presented for those aged up to 69 years and those over 70 years old.
Acceleration values of 140 mg and 210 mg approximated slow and normal walking, respectively. For those aged up to 69 years and 70 years and over, an acceleration value of 350 mg and 270 mg respectively approximated brisk walking. However, if applied to ActiGraph data from the dominant wrist, these values should be decreased by 10%.
For estimating a similar value for self-paced running, it was not possible to differentiate into age- groups due to sample size. For the 95% of the participants who ran at >8 km·h−1, acceleration was >600 mg for all devices (), despite the significantly lower acceleration values for the ActiGraph. Thus, a value of >600 mg is recommended to represent self-paced running.
Figure 2. Acceleration for self-selected running, by device brand and wear location. Values are presented as marginal means with standard error bars. *Indicates ActiGraph was significantly lower than Axivity and GENEActiv. Values are adjusted for age, sex, height and mass.
Discussion
This study presents the accelerations recorded by wrist-worn accelerometers when undertaking self-paced slow, normal and brisk walking. Linking accelerations to self-paced walking facilitates use of accelerometer data to estimate the prevalence of physical activity of sufficient relative intensity to potentially benefit health (Chudasama et al., Citation2019; Rowlands et al., Citation2019a). Accelerations measured at the wrist clearly differentiated between self-paced slow, normal and brisk walking, irrespective of age-group, device or wrist of wear. The lower accelerations associated with self-paced brisk walking in the older age groups reflected their lower absolute speed, evident here and consistent with previous research (Bohannon & Andrews, Citation2011). People aged 70–79 years walked 0.7 km·h−1 slower and measured acceleration was correspondingly 100 mg lower than those aged 40–49 years when walking briskly. This difference could lead to underestimation of self-paced brisk walking when translating accelerometer assessed physical activity in older age groups. Thus, while the normative acceleration values for slow and normal walking are consistent across age groups, for brisk walking the estimate is lower for those aged 70–79 years.
The approximations hold across all devices on the non-dominant wrist. Researchers using the ActiGraph on the dominant wrist should be aware that values were approximately 10% lower than the other devices, consistent with previous research (Rowlands et al., Citation2019b), and the normative values should be adjusted accordingly. However, a value of ≥600 mg was reflective of running in our self-selected sub-sample irrespective of device.
MVPA cut-points are typically based on 3 METs (metabolic equivalent of task), which equates to walking at 4 km·h−1 (Ainsworth et al., Citation2011). An acceleration value of 100 mg has been presented to quantify MVPA (>3 METs) from wrist accelerometry during laboratory-based treadmill walking in adults (Hildebrand et al., Citation2014). However, in this study the self-paced walking speeds associated with slow (4.6 km·h−1), normal (5.6 km·h−1) and brisk walking (6.5 km·h−1) were all higher than 4 km·h-1, with corresponding acceleration values on average above 100 mg. Thus, these findings indicate that self-paced walking, even at a pace perceived as slow, people exceeded the 100 mg threshold. This indicates a potential discrepancy between metabolic and behavioural definitions of moderate intensity walking. For example, MVPA can be exemplified as “brisk walking” (Bjørkelund et al., Citation2016; Kwan et al., Citation2020), but note the 3 MET lower bound of the MVPA category aligns with the energy expenditure associated with walking at 4 km·h−1 (Ainsworth et al., Citation2011), which was ~1 standard deviation slower than the mean speed of a self-paced slow walk in the current study.
Walking is an easily understandable form of physical activity. Thus, to illustrate the association between accelerometer-determined physical activity and premature mortality in the UK Biobank cohort, Chudasama and colleagues used a value of 250 mg to translate accelerometer data in terms of time spent walking briskly (Chudasama et al., Citation2019). The 250 mg acceleration threshold was estimated from the linear regression equation presented by Hildebrand et al. (Citation2014) using 4.3 METs, the energy expenditure indicative of walking at a “brisk pace for exercise” (Ainsworth et al., Citation2011). This demonstrates how thresholds can be used to develop simple, but effective, public health messages from associations between accelerometer-determined physical activity and health. In the current study, 250 mg equates to a pace between a self-paced normal and brisk walk for 40–69 year olds, but for those aged 70–79 years it approximated a self-paced brisk walk. Thus, for those 40–69 years, prescribing self-paced brisk walking may elicit a higher intensity than intended. Clinicians should bear this in mind when recommending or prescribing brisk walking.
Acceleration data from the ActiGraph were around 10% lower at the dominant wrist during walking and running and 5% lower for the non-dominant wrist when running. This has been shown previously, predominantly for acceleration measured at the dominant wrist (Rowlands et al., Citation2018). The relatively lower output from the ActiGraph may be related to filtering applied by the ActiGraph proprietary software to the data (Rowlands et al., Citation2019b). As accelerations are higher at the dominant wrist, this explains why it may be evident for the dominant wrist only during walking, but noticeable at both wrists for the higher intensity activity or running.
Strengths of the study include use of three of the main research-grade accelerometers, and self-paced walking and running in a free-living environment, which more accurately represents daily life gait and walking (Barnett et al., Citation2015; Van Ancum et al., Citation2018). However, there are several limitations that should be noted. Firstly, despite having a larger total sample than previous studies, this study is limited by the relatively small numbers in the oldest age-group and was pre-dominantly white Europeans. Secondly, as three different brands of devices were used, only one could be placed directly on the optimal wrist position. However, the relative placement of the monitors was randomised, as in previous studies (Plekhanova et al., Citation2020; Rowlands et al., Citation2019b). Thirdly, participants are likely to be healthier than the general population which could lead to faster walking speeds for a given pace compared to those recently presented in a large meta-analysis (Bohannon & Andrews, Citation2011; Murtagh et al., Citation2020). For example, recent research has shown that approximately 4.4 km·h−1 was the preferred walking speed of someone aged 70 years, whereas in this study 4.4 km·h−1 equated more closely to their slow self-paced walk (Karavirta et al., Citation2020). However, the normal walking speeds for the 40–69 years group are similar to others reported in the literature (Taylor et al., Citation2010). Finally, the methods used in this study for the translation of accelerometer data into time spent walking assumes that accelerations above the thresholds comes from ambulation. This may be a reasonable assumption given that walking is a major contributor to physical activity, particularly activity in older adults (Valenti et al., Citation2016).
In conclusion, these estimates of normative accelerations for self-paced walking and running facilitate simple but meaningful public-health friendly translation of accelerometer data (Dawkins et al., Citation2020; Rowlands et al., Citation2019a), that is relevant to different age groups, and can be easily applied to large datasets. Application of the acceleration values presented herein will facilitate age-specific and user-friendly translation of accelerometer-determined physical activity. These values may be particularly useful for large cohort or epidemiological datasets.
Future research should build on the normative values presented to expand the generalisability of values and, where necessary, facilitate the generation of values specific to a broader range of populations. Further to age, ethnic differences in walking speed could be explored, as South Asian populations are often shorter and lighter than White Europeans (Ntuk et al., Citation2017), potentially affecting the relationship between speed and acceleration.
Abbreviations
Body mass index - BMI
Euclidean norm minus 1 g – ENMO
Generalised estimating equation - GEE
Metabolic equivalent of task - MET
Milli-gravitational unit – mg
Moderate-to-vigorous physical activity – MVPA
Supplemental Material
Download MS Word (27.9 KB)Acknowledgments
The authors would like to thank Megan Chiffers for her assistance with data collection and the participants for their involvement with this study.
Author Contributions: NPD, AVR, TY, AASS and MB planned the study. NPD and AASS undertook data collection. NPD completed the main analysis of the study, with contributions from AVR and TY. NPD prepared the first draft of the manuscript. All authors read, provided feedback and approved the final manuscript.
Disclosure statement
The author(s) report no conflict of interest.
Supplementary material
Supplemental data for this article can be accessed online https://doi.org/10.1080/02640414.2021.1976491.
Additional information
Funding
References
- Aadland, E., & Anderssen, S. A. (2012). Treadmill calibration of the Actigraph GT1M in young-to-middle-aged obese-to-severely obese subjects. Journal of Obesity, 2012, Article ID318176, 1–8. https://doi.org/10.1155/2012/318176
- Ainsworth, B. E., Haskell, W. L., Herrmann, S. D., Meckes, N., Bassett JR, D. R., Tudor-Locke, C., Greer, J. L., Vezina, J., Whitt-Glover, M. C., & Leon, A. S. (2011). 2011 compendium of physical activities: A second update of codes and MET values. Medicine and Science in Sports and Exercise, 43(8), 1575–1581. https://doi.org/10.1249/MSS.0b013e31821ece12
- Barker, J., Smith Byrne, K., Doherty, A., Foster, C., Rahimi, K., Ramakrishnan, R., Woodward, M., & Dwyer, T. (2019a). Physical activity of UK adults with chronic disease: Cross-sectional analysis of accelerometer-measured physical activity in 96 706 UK Biobank participants. International Journal of Epidemiology, 48(4), 1167–1174. https://doi.org/10.1093/ije/dyz148
- Barker, J., Smith Byrne, K., Doherty, A., Foster, C., Rahimi, K., Ramakrishnan, R., Woodward, M., & Dwyer, T. (2019b). Response to: One size does not fit all—application of accelerometer thresholds in chronic disease. International Journal of Epidemiology, 48(4), 1381. https://doi.org/10.1093/ije/dyz165
- Barnett, A., Cerin, E., Vandelanotte, C., Matsumoto, A., & Jenkins, D. (2015). Validity of treadmill-and track-based individual calibration methods for estimating free-living walking speed and VO 2 using the Actigraph accelerometer. BMC Sports Science, Medicine and Rehabilitation, 7(1), 1–11. https://doi.org/10.1186/s13102-015-0024-7
- Bjørkelund, O. A., Degerud, H., & Bere, E. (2016). Socio-demographic, personal, environmental and behavioral correlates of different modes of transportation to work among Norwegian parents. Archives of Public Health, 74(1), 1–9. https://doi.org/10.1186/s13690-016-0155-7
- Bohannon, R. W., & Andrews, A. W. (2011). Normal walking speed: A descriptive meta-analysis. Physiotherapy, 97(3), 182–189. https://doi.org/10.1016/j.physio.2010.12.004
- Brady, E. M., Hall, A. P., Baldry, E., Chatterjee, S., Daniels, L. J., Edwardson, C., Khunti, K., Patel, M. I., Henson, J. J., Rowlands, A., Smith, A. C., Yates, T., & Davies, M. J. (2019). Rationale and design of a cross-sectional study to investigate and describe the chronotype of patients with type 2 diabetes and the effect on glycaemic control: The CODEC study. BMJ Open, 9(11), e027773. https://doi.org/10.1136/bmjopen-2018-027773
- Carpinella, I., Crenna, P., Rabuffetti, M., & Ferrarin, M. (2010). Coordination between upper-and lower-limb movements is different during overground and treadmill walking. European Journal of Applied Physiology, 108(1), 71–82. https://doi.org/10.1007/s00421-009-1168-5
- Chudasama, Y. V., Khunti, K. K., Zaccardi, F., Rowlands, A. V., Yates, T., Gillies, C. L., Davies, M. J., & Dhalwani, N. N. (2019). Physical activity, multimorbidity, and life expectancy: A UK Biobank longitudinal study. BMC Medicine, 17(1), 108. https://doi.org/10.1186/s12916-019-1339-0
- Dawkins, N. P., Yates, T., Edwardson, C. L., Maylor, B., Davies, M. J., Dunstan, D., Highton, P. J., Herring, L. Y., Khunti, K., & Rowlands, A. V. (2020). Comparing 24 h physical activity profiles: Office workers, women with a history of gestational diabetes and people with chronic disease condition(s). Journal of Sports Sciences, 39(2), 219-226. https://doi.org/10.1080/02640414.2020.1812202
- Dibben, G. O., Gandhi, M. M., Taylor, R. S., Dalal, H. M., Metcalf, B., Doherty, P., Tang, L. H., Kelson, M., & Hillsdon, M. (2020). Physical activity assessment by accelerometry in people with heart failure. BMC Sports Science, Medicine and Rehabilitation, 12(1), 1–12. https://doi.org/10.1186/s13102-020-00196-7
- Dibben, G. O., Taylor, R. S., Dalal, H. M., & Hillsdon, M. (2019). One size does not fit all— Application of accelerometer thresholds in chronic disease. International Journal of Epidemiology, 48(4), 1380. https://doi.org/10.1093/ije/dyz164
- Doherty, A. R., Jackson, D., Hammerla, N., Plötz, T., Olivier, P., Granat, M. H., White, T., Van Hees, V. T., Trenell, M. I., Owen, C. G., Preece, S. J., Gillions, R., Sheard, S., Peakman, T., Brage, S., & Wareham, N. J. (2017). Large scale population assessment of physical activity using wrist worn accelerometers: The UK Biobank study. PloS One, 12(2), e0169649. https://doi.org/10.1371/journal.pone.0169649
- Duncan, M. J., Rowlands, A., Lawson, C., Leddington Wright, S., Hill, M., Morris, M., Eyre, E., & Tallis, J. (2020). Using accelerometry to classify physical activity intensity in older adults: What is the optimal wear-site? European Journal of Sport Science, 20(8), 1131–1139. https://doi.org/10.1080/17461391.2019.1694078
- Esliger, D. W., Rowlands, A. V., Hurst, T. L., Catt, M., Murray, P., & Eston, R. G. (2011). Validation of the GENEA accelerometer.Medicine and Science in Sports and Excercise, 43,1085-1093.
- Fraysse, F., Post, D., Eston, R., Kasai, D., Rowlands, A. V., & Parfitt, G. (2020). Physical activity intensity cut-points for wrist-worn GENEActiv in older adults. Frontiers in Sports and Active Living, 2, 579279, 1-9. https://doi.org/10.3389/fspor.2020.579278
- Hildebrand, M., Van Hees, V. T., Hansen, B. H., & Ekelund, U. (2014). Age group comparability of raw accelerometer output from wrist- and hip-worn monitors. Medicine and Science in Sports and Exercise, 46(9), 1816–1824. https://doi.org/10.1249/MSS.0000000000000289
- Himann, J. E., Cunningham, D. A., Rechnitzer, P. A., & Paterson, D. H. (1988). Age-related changes in speed of walking. Medicine and Science in Sports and Exercise, 20(2), 161–166. https://doi.org/10.1249/00005768-198820020-00010
- Karavirta, L., Rantalainen, T., Skantz, H., Lisko, I., Portegijs, E., Rantanen, T., & Newman, A. (2020). Individual scaling of accelerometry to preferred walking speed in the assessment of physical activity in older adults. The Journals of Gerontology: Series A, 75(9), e111–e118. https://doi.org/10.1093/gerona/glaa142
- Kwan, R. Y., Lee, D., Lee, P. H., Tse, M., Cheung, D. S., Thiamwong, L., & Choi, K.-S. (2020). Effects of an mhealth brisk walking intervention on increasing physical activity in older people with cognitive frailty: Pilot randomized controlled trial. JMIR mHealth and uHealth, 8(7), e16596. https://doi.org/10.2196/16596
- Ladha, C., Ladha, K., Jackson, D., & Olivier, P. (2013). Shaker table validation of OpenMovement AX3 accelerometer. Ahmerst (ICAMPAM 2013 AMHERST): In 3rd International Conference on Ambulatory Monitoring of Physical Activity and Movement. 69–70.
- Loprinzi, P. D., Lee, H., Cardinal, B. J., Crespo, C. J., Andersen, R. E., & Smit, E. (2012). The relationship of actigraph accelerometer cut-points for estimating physical activity with selected health outcomes: Results from NHANES 2003-06. Research Quarterly for Exercise and Sport, 83(3), 422–430. https://doi.org/10.1080/02701367.2012.10599877
- Migueles, J. H., Cadenas-Sanchez, C., Tudor-Locke, C., Löf, M., Esteban-Cornejo, I., Molina-Garcia, P., Mora-Gonzalez, J., Rodriguez-Ayllon, M., Garcia-Marmol, E., & Ekelund, U. (2019a). Comparability of published cut-points for the assessment of physical activity: Implications for data harmonization. Scandinavian Journal of Medicine & Science in Sport, 29(4), 223–574. https://doi.org/10.1111/sms.13356
- Migueles, J. H., Rowlands, A. V., Huber, F., Sabia, S., & Van Hees, V. T. (2019b). GGIR: A research community–driven open source R package for generating physical activity and sleep outcomes from multi-day raw accelerometer data. Journal for the Measurement of Physical Behaviour, 2(3), 188–196. https://doi.org/10.1123/jmpb.2018-0063
- Murtagh, E., Mair, J. L., Aguair, E., Tudor-Locke, C., & Murphy, M. H. (2020). Outdoor walking speeds of apparently healthy adults: A systematic review and meta-analysis. Sports Medicine, 51(1), 125-141. https://doi.org/10.1007/s40279-020-01351-3
- Ntuk, U., Celis‐Morales, C., Mackay, D., Sattar, N., Pell, J., & Gill, J. (2017). Association between grip strength and diabetes prevalence in black, South‐Asian, and white European ethnic groups: A cross‐sectional analysis of 418 656 participants in the UK Biobank study. Diabetic Medicine, 34(8), 1120–1128. https://doi.org/10.1111/dme.13323
- Parvataneni, K., Ploeg, L., Olney, S. J., & Brouwer, B. (2009). Kinematic, kinetic and metabolic parameters of treadmill versus overground walking in healthy older adults. Clinical Biomechanics, 24(1), 95–100. https://doi.org/10.1016/j.clinbiomech.2008.07.002
- Plekhanova, T., Rowlands, A. V., Yates, T., Hall, A., Brady, E. M., Davies, M., Khunti, K., & Edwardson, C. L. (2020). Equivalency of sleep estimates: Comparison of three research-grade accelerometers. Journal for the Measurement of Physical Behaviour, 3(4), 294–303. https://doi.org/10.1123/jmpb.2019-0047
- Rowlands, A. V., Dawkins, N. P., Maylor, B., Edwardson, C. L., Fairclough, S. J., Davies, M. J., Harrington, D. M., Khunti, K., & Yates, T. (2019a). Enhancing the value of accelerometer-assessed physical activity: Meaningful visual comparisons of data-driven translational accelerometer metrics. Sports Medicine - Open, 5(1), 1–11. https://doi.org/10.1186/s40798-019-0225-9
- Rowlands, A. V., Mirkes, E. M., Yates, T., Clemes, S., Davies, M., Khunti, K., & Edwardson, C. L. (2018). Accelerometer-assessed physical activity in epidemiology: Are monitors equivalent? Medicine and Science in Sports and Exercise, 50(2), 257–265. https://doi.org/10.1249/MSS.0000000000001435
- Rowlands, A. V., Plekhanova, T., Yates, T., Mirkes, E. M., Davies, M., Khunti, K., & Edwardson, C. L. (2019b). Providing a basis for harmonization of accelerometer-assessed physical activity outcomes across epidemiological datasets. Journal for the Measurement of Physical Behaviour, 2(3), 131–142. https://doi.org/10.1123/jmpb.2018-0073
- Rowlands, A. V., Yates, T., Davies, M., Khunti, K., & Edwardson, C. L. (2016). Raw accelerometer data analysis with GGIR R-package: Does accelerometer brand matter? Medicine and Science in Sports and Exercise, 48(10), 1935–1941. https://doi.org/10.1249/MSS.0000000000000978
- Stamatakis, E., Kelly, P., Strain, T., Murtagh, E. M., Ding, D., & Murphy, M. H. (2018). Self-rated walking pace and all-cause, cardiovascular disease and cancer mortality: Individual participant pooled analysis of 50 225 walkers from 11 population British cohorts. British Journal of Sports Medicine, 52(12), 761–768. https://doi.org/10.1136/bjsports-2017-098677
- Taylor, K. L., Fitzsimons, C., & Mutrie, N. (2010). Objective and subjective assessments of normal walking pace, in comparison with that recommended for moderate intensity physical activity. International Journal of Exercise Science, 3(3), 87. https://www.ncbi.nlm.nih.gov/pmc/articles/PMC4738894/
- Troiano, R. P. (2005). A timely meeting: Objective measurement of physical activity. Medicine and Science in Sports and Exercise, 37(11), S487. https://doi.org/10.1249/01.mss.0000185473.32846.c3
- Tudor-Locke, C., & Rowe, D. A. (2012). Using cadence to study free-living ambulatory behaviour. Sports Medicine, 42(5), 381–398. https://doi.org/10.2165/11599170-000000000-00000
- Valenti, G., Bonomi, A. G., & Westerterp, K. R. (2016). Walking as a contributor to physical activity in healthy older adults: 2 week longitudinal study using accelerometry and the doubly labeled water method. JMIR mHealth and uHealth, 4(2), e56. https://doi.org/10.2196/mhealth.5445
- Van Ancum, J. M., Van Schooten, K. S., Jonkman, N. H., Huijben, B., Van Lummel, R. C., Meskers, C. G., Maier, A. B., & Pijnappels, M. (2018). Gait speed assessed by a 4-meter walk test is not representative of daily-life gait speed in community-dwelling adults. Maturitas, 121, 28–34. https://doi.org/10.1016/j.maturitas.2018.12.008
- Van Hees, V. T., Fang, Z., Langford, J., Assah, F., Mohammad, A., Da Silva, I. C., Trenell, M. I., White, T., Wareham, N. J., & Brage, S. (2014). Autocalibration of accelerometer data for free-living physical activity assessment using local gravity and temperature: An evaluation on four continents. Journal of Applied Physiology, 117(7), 738–744. https://doi.org/10.1152/japplphysiol.00421.2014
- Yates, T., Zaccardi, F., Dhalwani, N. N., Davies, M. J., Bakrania, K., Celis-Morales, C. A., Gill, J. M., Franks, P. W., & Khunti, K. (2017). Association of walking pace and handgrip strength with all-cause, cardiovascular, and cancer mortality: A UK Biobank observational study. European Heart Journal, 38(43), 3232–3240. https://doi.org/10.1093/eurheartj/ehx449