
 ?Mathematical formulae have been encoded as MathML and are displayed in this HTML version using MathJax in order to improve their display. Uncheck the box to turn MathJax off. This feature requires Javascript. Click on a formula to zoom.
ABSTRACT
Adolescence is a period of increased injury risk in youth footballers; however, no studies have considered the influence of growth-related factors and exposure time upon injury risk. Forty-nine elite male youth footballers were prospectively monitored for growth, lower-limb growth, maturation, training volume and injury for one season. Generalised linear mixed-effects models were used to model growth rate, lower-limb growth rate, maturation, and smoothed week-to-week changes in exposure on time-loss injury risk. The relationship between growth rate and injury incidence was linear (P = 0.031) and injury burden was non-linear (P = 0.019). The relationship between lower-limb growth rate and injury incidence was linear and positive (P = 0.098). A non-linear relationship was observed between lower-limb growth rate and injury burden (P = 0.001). A non-linear relationship between Percentage of Predicted Adult Stature and both injury incidence and injury burden were found, with peak risk occurring at 92% and 95% , respectively. There was a positive linear relationship between week-to-week changeand injury incidence (P = 0.001), and a non-linear relationship between week-to-week change and injury burden (P = 0.01). Practitioners should monitor the timing and rate of the growth spurt and exposure time to identify players at greater injury risk.
KEYWORDS:
Introduction
It is common practice for football clubs worldwide to use academies to develop talented youth players (Jones et al., Citation2019). These academies aim to develop youth players into elite players, but injuries may negatively affect this development. A review by Jones et al. (Citation2019) suggested that the likelihood of a high-level youth football player sustaining a time-loss injury during a season was 50%. Additionally, Jones et al. (Citation2019) also suggested that non-contact injuries are prominent in high-level male youth soccer players; with 53% to 72% injuries being non-contact. Thus, the reduction of injuries to youth players in academies is of paramount importance (Read et al., Citation2018). Injuries at the youth level can also have long-term consequences, making players more susceptible to future injuries and long-term health risks (e.g osteoarthritis; Lohkamp et al., Citation2017; Webborn, Citation2012). During adolescence, many changes occur to the body, and so there are several potential causes of an increased injury risk, including the rapid growth of the body during peak height velocity (PHV) and changes to limb length, limb mass, and moments of inertia (Adirim & Cheng, Citation2003; Hawkins & Metheny, Citation2001). Consequently, adolescents might therefore experience temporary delays or regressions in sensorimotor mechanisms and motor control (Quatman-Yates et al., Citation2012), which may adversely impact injury risk.
To date, a limited number of studies in youth football academies have investigated the influence of adolescent growth rates upon injury (Kemper et al., Citation2015; Rommers et al., Citation2019). Kemper et al. (Citation2015) reported that injured male adolescent footballers had a higher rate of growth compared to non-injured players. Rommers et al. (Citation2019) also found that increases in leg length were associated with increased overuse injury risk in youth footballers. In adolescent track and field athletes, Wik et al. (Citation2020) found that both overall growth rate and leg length growth rate were associated with a greater risk of bone and growth plate injuries. In accordance with these findings, research suggests an increase in injuries during the period of peak height velocity (PHV) that accompanies puberty (Bult et al., Citation2018; Maternea et al., Citation2015; Van der Sluis et al., Citation2014). However, the aforementioned studies have employed the maturity offset protocol (Mirwald et al., Citation2002) which uses age, stature, mass and seated stature for estimating age at PHV, the validity and reliability of which has been questioned (Kozieł & Malina, Citation2017, Citation2018). Specifically, the offset method, and its variations, has been shown to under-estimate age at PHV in younger and late-maturing youth and overestimates age at PHV in older and early maturing youth (Kozieł & Malina, Citation2018, Citation2017). A recent study of player development in English academy footballers found that, at 13 years of age, the offset method was only able to correctly categorise 62% of players as being within or outside the + or −1 year band of their observed age at PHV (Parr et al., Citation2020). Using the percentage of predicted adult stature as an alternative indicator of maturation status, Johnson et al. (Citation2019) found that players between 88% and 95% of predicted adult stature (i.e., circa PHV) presented a higher injury incidence rate and burden compared to pre-PHV. However, this work was limited by the fact that it only accounted for match exposure rather than total exposure (match and training). Monasterio et al. (Citation2020) also demonstrated that growth-related injuries are grouped around PHV, and that these injuries occurred from distal to proximal body regions, following the pattern of growth (Malina et al., Citation2004).
To date, no studies have evaluated the relationship between changes in exposure and injury risk in adolescent football players, although positive moderate-to-large associations between training volume (pitch counts) and injury risk have been observed in adolescent baseball players (Lyman et al., Citation2002; Olsen et al., Citation2006). Training load research recommends avoiding large changes in training load particularly in developing athletes (Soligard et al., Citation2016); one method to do this is to monitor week-to-week changes (Lazarus et al., Citation2017). Accordingly, the primary aim of this study was to explore the association between growth, maturity, and total (match and training) exposure related risk factors and injury risk (incidence and burden) in a group of elite male academy football players.
Method
Participants
A total of 49 male football players, across four age groups (U13 – U16) within an English football club’s academy agreed to participate in this study. No a priori sample size calculation was conducted, however, Bahr and Holme (Citation2003) suggest that 20–50 injury cases are needed to detect moderate-to-strong associations between risk factors and injury, and thus this sample size was deemed adequate for this purpose. These age groups were selected for analysis as the aim of this study was to understand the influence of growth, maturation, and exposure variables upon injury risk. Therefore, these groups provided a range of players pre-, circa- and post-PHV. Data from one full competitive season (2018/19) were analysed. This study gained ethical approval from the Research Ethics Approval Committee for Health at the University of Bath. All parents and guardians provided consent and assent for routine data collection as part of the enrolment in the academy and agreed to the potential use of this data for research purposes.
Measurements
Players’ stature, seated stature and mass were measured by one ISAK trained sports science staff member and researcher on a regular basis (3 to 5 times per year). The definitions and instructions in the measurement of stature, seated stature and mass are consistent with the International Society for the Advancement of Kinanthropometry (ISAK) guidelines. The staff member’s absolute and relative intra-rater typical error of measurement for standing stature was 0.03 cm and 0.02%, and for seated stature was 0.02 cm and 0.02%, respectively (Perini et al., Citation2005). Growth rate was calculated for each player as the change in stature over the change in time, giving a rate in cm per year. This rate was then inputted on the midpoint between the two measurement dates and smoothed using a Bessel spline to provide an estimated growth rate for each day. The calculation of the spline allowed an estimate of growth rate for each, which allowed the growth and maturation data to match with daily observations of day training exposure, the spline would fit a curve across the whole time period using the multiple measurement points and subsequently, a growth rate per day could be estimated from this curve. The players’ stature, mass, chronological age, and mid-parent stature were also used to predict the adult stature of each player (Khamis & Roche, Citation1994). Each player’s parents completed a self-report form to provide their stature, this was adjusted for over-estimation using the equations in Epstein et al. (Citation1995). For all players included in the study, it was possible to obtain the stature of both parents. Each player’s current stature was then expressed as a percentage of their predicted adult stature, which was used as an index of somatic maturation (Roche et al., Citation1983). This method has a median error between the actual and the predicted adult stature of males (4–17 years old) that ranges from 0.8 to 2.8 cm (Khamis & Roche, Citation1994). The maturity status (pre-, circa- and post-PHV) and maturity timing (early, on-time and late) were calculated for each measurement point. A Bessel spline was used to provide a data point for each day within the season, for maturity status.
Exposure time in minutes was calculated as the total training, match, and gym time within the academy and recorded daily by the age group coach. Total training, match, and gym time were included to fit with the consensus statement on football injuries, which suggest physical activities under the control of the team’s coaching or fitness staff that are aimed at maintaining or improving players’ football skills or physical condition should be included. Participants with exposure two standard deviations below the mean were excluded as outliers before analysis (Hopkins et al., Citation2009), a low exposure was due to players being released, signed by another club or recently signed to the academy. The total daily exposure, total weekly exposure and the week-to-week change were also calculated. Total weekly exposure was calculated on a rolling basis including the current day and the previous 6 days. The smoothed week-to-week change in exposure was calculated as the change in total weekly exposure between the previous and current weeks; this value was then exponentially smoothed as described in Equation 1 (Lazarus et al., Citation2017):
where represents the degree of time decay. Time decay will be calculated by:
where N is the chosen time decay constant. A decay factor representing a time constant of 7 days (0.069) was used. Activities outside the academy including both at home or school were not registered (Bult et al., Citation2018).
Academy medical staff recorded time-loss injuries using the club’s online database. A time-loss injury was defined as a player being unable to take part in full football training or match play (Fuller et al., Citation2006). Only injuries that occurred during training, gym or football competition were counted, those unrelated to academy activities were not recorded (Fuller et al., Citation2006). Only non-contact injuries were analysed; these were defined as those sustained by a player without extrinsic contact by another player or other object on the field of play (Marshall, Citation2010). Injuries are represented as a total value (cumulative value) and as the number of injuries per 1,000 player-hours (Fuller et al., Citation2006). Injury severity was given by the number of days elapsed between the initial injury date and the player’s return to full availability for training and/or matches (Fuller et al., Citation2006). The injury burden was given by the injury incidence rate multiplied by the mean days missed per injury, giving the days of absence per 1000 hours per (Fuller, Citation2018).
Statistical analysis
All estimations were performed using R (version 3.5.1, R Foundation for Statistical Computing, Vienna, Austria). Generalized linear mixed-effects models were fitted using the lme4 package (Bates et al., Citation2014), to model the association between growth rate, maturity status and week-to-week changes in exposure upon estimated injury likelihood, using a binomial distribution and log-link function.
For analysis of injury burden, data were transferred into weekly values, with the dependent variable being the count of days absent each week. For week-to-week changes in exposure, the injury burden data were lagged by 1 week so that the week-to-week change was associated with burden incurred in the subsequent week. Generalized linear mixed-effects models with a Poisson distribution, log-link function and exposure offset were used, with the same predictor variables input to model their association with injury burden.
Predictor variables were modelled as continuous fixed effects. The growth rate variable was also parsed into two categories to explore the difference between a high growth rate (>7.2 cm/year) and a low growth rate (<7.2 cm/year; Kemper et al., Citation2015). Player ID was included as a random effect to account for repeated observations. Each continuous predictor variable was independently modelled as both a linear and nonlinear effect by including a polynomial term in the model (Cross et al., Citation2016; Hulin et al., Citation2013). For non-linear effects, polynomial terms were retained in the model where P < 0.10. Rate ratio (RR) values were presented as the change in risk per two standard deviation increase (2SD↑) in the predictor variable (Hopkins et al., Citation2009). For non-linear relationships, the “estimate smooth” function from the “model based” package was used to summarise non-linear curves in terms of linear segments and the region of peak risk (Ludecke, Waggoner, & Makowski, 2019; Makowski, Ben-Shachar, & Ludecke, 2019; Makowski, Ben-Shachar, Patil, & Ludecke, 2020; Ludecke, Ben-Shachar, Patil, & Makowski, 2020; Ben-Shachar, Ludecke, & Makowski, 2020) (Makowski et al., Citation2020).
Results
Player demographics and maturity data between age groups are presented in . There were 53 injuries and 8,843 hours of total exposure. The mean exposure for each player was 180.4 (± 40.6) hours, furthermore, the mean (SD) values for Percentage of Predicted Adult Stature = 92.14 (± 4.89), growth rate = 5.39 (± 3.54) cm/year, lower-limb growth rate = 3.06 (± 2.53) cm/year and week-to-week change in total exposure = 3.52 (± 117.62) minutes. The overall injury incidence rate was 6.0 injuries per 1,000 hours (95% CI 4.6–7.8), the mean severity of injuries was 31 days (95% CI 24–40) and injury burden was 184.1 days absent per 1,000 hours (95% CI 140.6–241.0). A comparison between age groups for injury incidence, severity, and burden can be found in ; injury burden in the U16 age group was lower than all other age groups.
Table 1. Stature, body mass, percentage of predicted adult stature and maturity timing (mean ± SD).
Table 2. Injury counts, incidence rates, mean severity, and injury burden for each age group (95% confidence intervals lower – upper).
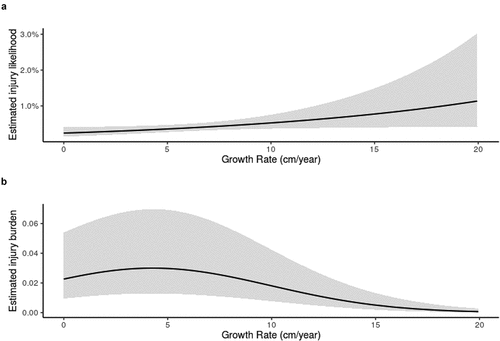
A linear relationship between growth rate (cm/year) and the estimated likelihood of injury was found (RR per 2SD↑: 1.73, 95% CI: 1.05–2.85, P = 0.031; ). There was a greater estimated likelihood of injury for players with a growth rate >7.2 cm/year (RR: 1.74, 95% CI: 1.03–2.94, P = 0.037). A non-linear relationship was observed between growth rate and estimated injury burden (P = 0.019), with peak injury burden occurring at 4.17 cm/year (). There was a RR per 2SD↑ of 1.05 in injury burden between 0.00 cm/year and 4.21 cm/year, and a RR per 2SD↑ of 0.87 between 4.21 cm/year up to 19.94 cm/year.
Figure 1. a) The estimated injury incidence likelihood compared to growth rate (cm/year), b) The estimated injury burden likelihood compared to growth rate (cm/year) (The black line represents the estimated likelihood and grey shaded area represents the 90% confidence intervals).
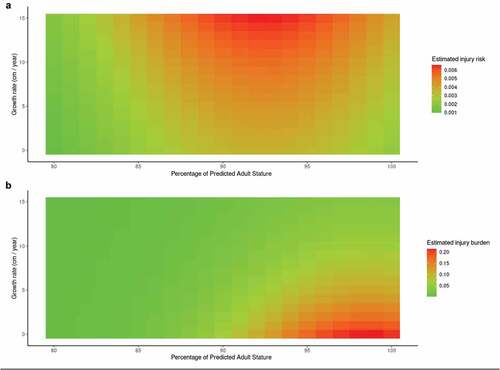
There was a non-linear relationship between Percentage of Predicted Adult Stature and the estimated likelihood of injury incidence (P = 0.082). Peak estimated injury likelihood occurred at 92% Percentage of Predicted Adult Stature (). There was a RR per 2SD↑ of 1.10 in estimated injury likelihood between 83% and 92% Percentage of Predicted Adult Stature, and a RR per 2SD↑ of 0.93 in the estimated injury likelihood between 92% and 100%. There was also a non-linear relationship between Percentage of Predicted Adult Stature and estimated injury burden (P < 0.001). The peak estimated injury burden occurred at 95% Percentage of Predicted Adult Stature (). There was a RR per 2SD↑ of 1.22 in estimated injury likelihood between 83% and 95% Percentage of Predicted Adult Stature, and a RR per 2SD↑ of 0.82 in the estimated injury burden likelihood between 95% and 100% Percentage of Predicted Adult Stature. The combined effects of growth rate and Percentage of Predicted Adult Stature on estimated injury likelihood and injury burden are displayed in ), respectively. The combined effects of growth rate and Percentage of Predicted Adult Stature on injury incidence and burden are displayed in .
Figure 2. The relationship between percentage of predicted adult stature and a) injury incidence, with peak estimated injury likelihood occurring at 91.84%, and b) Injury Burden, with peak risk occurring at 95.24% (The black line represents the estimated likelihood and grey shaded area represents the 90% confidence intervals).
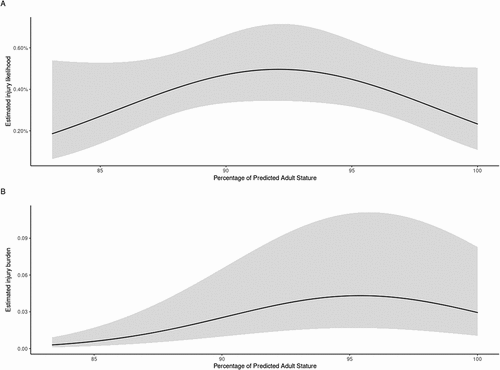
Figure 3. A heat map showing the combined effects of growth rate and percentage of predicted adult stature on estimated a) injury likelihood and b) injury burden.
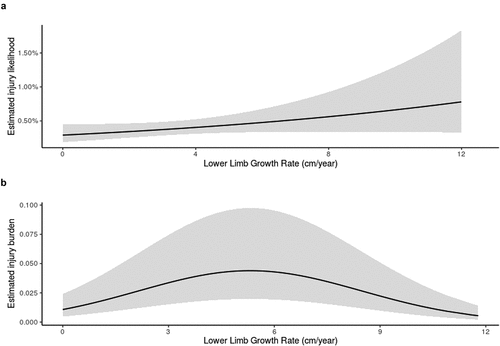
The relationship between lower-limb growth rate (cm/year) and estimated injury likelihood was linear (RR per 2SD↑:1.51, 95% CI: 0.92–2.49, P = 0.098; ). A non-linear relationship was observed between lower-limb growth rate (cm/year) and injury burden (P < 0.001; ). Peak estimated injury burden likelihood occurred at 5.27 cm/year. There was a RR per 2SD↑ of 1.11 in estimated injury burden between 0.00 cm/year and 5.27 cm/year and a RR per 2SD↑ of 0.90 between 5.27 cm/year and 11.78 cm/year.
Figure 4. The relationship between lower-limb growth rate (cm/year) and a) the likelihood of injury incidence and b) Injury burden, with peak risk occuring at 5.27 cm/year (The black line represents the estimated likelihood and grey shaded area represents the 90% confidence intervals).
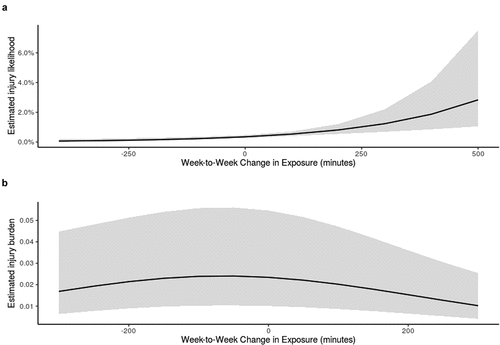
There was a linear relationship between week-to-week change in total exposure and the likelihood of injury incidence (RR per 2SD↑: 2.68, 95% CI: 1.60–4.49, P < 0.001). A non-linear relationship between week-to-week change and injury burden (P = 0.01) was observed; the peak estimated injury burden occurred at −68 minutes. There was a RR per 2SD↑ of 2.03 in injury burden between −273 minutes and −68 minutes and a RR per 2SD↑ of 0.31 between 68 minutes to 287 minutes.
Figure 5. The relationship week-to-week change in exposure and a) the likelihood of injury incidence and B) Injury burden (The black line represents the estimated likelihood and grey shaded area represents the 90% confidence intervals).
Discussion
This study aimed to investigate the effects of growth rate, lower-limb growth rate, percentage of adult stature and week-to-week changes in exposure on the likelihood of injury in adolescent academy footballers. The overall injury incidence rate in this study was 6.0 injuries per 1,000 hours (95% CI 4.6–7.8), the mean severity of injuries was 31 days (95% CI 24–40) and overall injury burden was 184.1 days absent per 1,000 (95% CI 140.6–241.0) hours. A linear relationship between growth rate and estimated injury likelihood, and a non-linear relationship between growth rate and injury burden, was observed. There was also a non-linear relationship between Percentage of Predicted Adult Stature and the likelihood of injury, with peak estimated injury likelihood occurring at 92% Percentage of Predicted Adult Stature. The association between Percentage of Predicted Adult Stature and injury burden was non-linear, with peak estimated injury burden likelihood occurring at 95% Percentage of Predicted Adult Stature. The relationship between lower-limb growth rate and the likelihood of injury incidence was found to be linear, whilst a non-linear relationship was observed between lower-limb growth rate and injury burden. There was a positive linear relationship between smoothed week-to-week changes in total exposure and the likelihood of injury incidence, and a non-linear relationship between week-to-week change and injury burden.
The first major finding of this study is the linear relationship between growth rate and injury incidence (RR per 2SD↑: 1.73, 95% CI: 1.05–2.85, P = 0.031), with higher growth rates associated with a greater estimated likelihood of injury (). It should be noted that the confidence interval for this effect estimate ranged from trivial to large. Kemper et al. (Citation2015) found a similar association, showing that injured players had a greater rate of growth than uninjured players. In Kemper et al. (Citation2015) the injured players had a mean rate of growth of 7.2 cm/year; the present study also found the players with a rate of growth rate >7.2 cm/year were 74% more likely to be injured than players growing less than 7.2 cm/year (P < 0.05). It should be noted that the current study used generalized linear mixed-effects models to account for repeated observations within players, whereas Kemper et al. (Citation2015) violated the assumption of independence in their models, which may have resulted in Type I errors (Windt et al., Citation2018). It is likely that growth rate is specifically associated with the risk of bone and growth plate injuries, as evidenced by Wik et al. (Citation2020) in adolescent athletics athletes. This study also found a non-linear relationship between growth rate and estimated injury burden, with the peak burden estimated at 4.17 cm/year. There was a 5% increase in injury burden per 7.08 cm increase in growth rate between 0.00 cm/year and 4.21 cm/year, but a 13% decrease between 4.21 cm/year up to 19.94 cm/year. This finding is potentially due to players post-growth spurt slowing down in growth but having a high injury burden due to more severe injuries seen in older age groups (Bult et al., Citation2018). Players post-PHV with a moderate growth rate, approximately 4.17 cm/year, are more likely to miss days with an injury
For maturity status (Percentage of Predicted Adult Stature) and injury incidence, there was a non-linear relationship between Percentage of Predicted Adult Stature and the likelihood of injury incidence (P = 0.082) and the peak likelihood of injury occurred at 92% (). The likelihood of injury increased by 10% per 2SD increase in Percentage of Predicted Adult Stature between 83% and 92%, which is equivalent to moving from pre-PHV to circa-PHV. The likelihood of injury decreased by 7% per 2SD↑ when moving from 92% (circa-PHV) to 100% (post-PHV). This corresponds to previous research that has shown an increased risk of injury incidence at 88% and 95% compared to pre and post PHV (Johnson et al., Citation2019). There was also a non-linear relationship between Percentage of Predicted Adult Stature and injury burden (P < 0.001; ). The peak risk for injury burden occurred at 95%, which is a higher Percentage of Predicted Adult Stature than the peak for injury incidence. Furthermore, there was a 22% increase in the estimated injury burden per 2SD↑ between 83% and 95% Percentage of Predicted Adult Stature, followed by an 18% decrease in estimated burden between 95% and 100% Percentage of Predicted Adult Stature. This result is in agreement with Johnson et al. (Citation2019), who found that there was a greater injury burden circa-PHV (88–95%) and post-PHV (95–100%) when compared to pre-PHV. Other literature has shown similar findings regarding injury risk during PHV; Bult et al. (Citation2018) found 3–6 months post-PHV had the highest risk of injury incidence and burden. These findings show that peak risk could occur later than PHV, as per the finding for burden in this study. Similarly to the current study, Van der Sluis et al. (Citation2014) found the year of PHV was associated with a greater number of injuries compared to pre- and post-PHV. However, this study also demonstrated that the days absent were higher during PHV than pre- and post-PHV, contrasting with the present findings. A possible reason for this contrast is that the present study used a different method to calculate the timing of PHV to both Van der Sluis et al. (Citation2014) and Bult et al. (Citation2018). These studies used the maturity offset method, which has been shown to have major limitations with early and late maturing boys (Kozieł & Malina, Citation2018, Citation2017). The likelihood of injury could be due to an increased vulnerability of tissue during this period, in particular growth sites (Monasterio et al., Citation2020) or due to changes in motor and postural control (John et al., Citation2019; Quatman-Yates et al., Citation2012).
authors’ knowledge, this is the first study to analyse the combined effects of growth rate and Percentage of Predicted Adult Stature on estimated injury likelihood and injury burden are displayed in , respectively. As discussed above, these figures show that there is a different relationship between these risk factors and injury incidence or burden. shows an increase in estimated injury likelihood at a high growth rate during PHV, whereas shows an increase in estimated injury burden likelihood at a lower growth rate and higher Percentage of Predicted Adult Stature. These heat maps could be used in a practical setting to track an individual’s growth rate and percentage of adult stature and identify when they are at a greater likelihood of injury. There are several potential explanations for the increased injury burden at a higher Percentage of Predicted Adult Stature. The first is that the types of injuries could change; the current study used all time-loss injuries but the timing of growth-related injuries at various body regions differ (Monasterio et al., Citation2020). The timing of the injuries would likely follow the pattern of growth and progress from distal to proximal (Hermanussen, Citation2016; Malina et al., Citation2004). The types and locations of injuries were not analysed in the present study due to sample size limitations, but this should be a consideration of future research. The greater injury burden post-PHV could be due to the higher incidence and burden of muscle injuries in older ages groups (Wik, Lolli et al., Citation2020), which could potentially be attributed to the increased physical demands at these ages (Goto et al., Citation2015a). In contrast, at the high Percentage of Predicted Adult Stature, there are likely to be fewer growth-related injuries. Wik et al. (Citation2020) found that athletes with greater maturity, using both skeletal age and Percentage of Predicted Adult Stature, were less prone to growth plate injuries. Thus, practitioners should use injury prevention strategies that are appropriate for each player’s stage of development. Practitioners should consider the increased prevalence of muscle injuries and injuries attributed to sprinting in older ages groups (Wik, Lolli et al., Citation2020). Another consideration is the demands of training; both increased age and maturity have been associated with increased match running performance (Buchheit & Mendez-Villanueva, Citation2014). Additionally, a player at this stage could still be vulnerable to injury and growing, although less rapidly. Players could, therefore, experience more severe injuries because of the combined effects of a vulnerable musculoskeletal system and an increase in training load demands (Goto et al., Citation2015b). Another possible explanation is that at older ages, medical staff are more conservative with return-to-play protocols as players’ values are increased and professional contracts are potentially offered at these ages. However, at the adult level, the opposite has been shown, where sports science and medical staff could be under pressure from coaching and management staff to allow players to return to sport sooner (Law & Bloyce, Citation2019). Finally, there is also the possibility that the higher injury burden could be due to a greater likelihood of having sustained a previous injury during their career so far (Krabak et al., Citation2021).
Regarding lower-limb growth rate, there was a linear relationship with the likelihood of injury incidence (RR per 2SD↑: 1.51 95% CI: 0.92–2.49, P = 0.098). This shows that for a two standard deviation increase in lower-limb growth rate (5.06 cm/year) there was a 51% increase in estimated injury likelihood, though the associated confidence intervals were wide and crossed the null. Additionally, a non-linear relationship was observed between lower-limb growth rate and injury burden (P < 0.001), with peak estimated injury burden likelihood occurring at 5.27 cm/year. As per the findings for overall growth rate, it appears that players post-growth spurt, who have a low-to-moderate lower-limb growth rate, have a higher injury burden. Again, this highlights a distinction between the effect of this risk factor on injury incidence and burden, respectively. This finding is in agreement with Rommers et al. (Citation2019), who found the lower-limb growth rate across a season to be associated with a higher risk of overuse injury. Moreover, in a sample of athletics athletes, Wik et al. (Citation2020) found that leg length growth rate was associated with greater overall injury risk, as well as bone and growth plate injuries. Monitoring the rate of growth of the lower limbs is therefore important, especially in sports where lower limb injuries are common (Jones et al., Citation2019). Furthermore, if practitioners are already measuring stature and seated stature it is straightforward to measure this variable without additional procedures or equipment.
Another novel finding from this study is that week-to-week changes in exposure were associated with an increase in estimated injury likelihood. No previous studies have analysed the relationship between changes in exposure and injury risk in adolescent football players. This finding shows that for a 2 SD increase in week-to-week change in exposure (235 minutes), there was a 168% increased estimated injury likelihood (RR: 2.68, 95% CI: 1.60–4.49, P < 0.001). This finding is difficult to compare with other studies as the number of studies considering both youth populations and this metric are limited. In adolescent baseball players, studies have shown that a larger exposure of activity is associated with a greater risk of injury (Lyman et al., Citation2002; Olsen et al., Citation2006). The method of quantifying week-to-week changes in the current study was suggested by Lazarus et al. (Citation2017), where it was used to examine the training-performance relationship. Furthermore, the authors suggested performance staff should avoid prescribing high weekly and substantially increased exposure during the season. For injury burden, there was a non-linear relationship with week-to-week change, showing the peak estimated injury burden likelihood occurred at −68 minutes. There was a 103% increase in injury burden per 2SD↑ in week-to-week change between −273 minutes and −68 minutes, and a corresponding 69% decrease between 68 minutes to 287 minutes. This finding was unexpected, as it suggests that reducing the total exposure from 1 week to the next resulted in an increased burden of injury in the subsequent week. It is important to note that in the confidence intervals are wide, representing large variation within the model. Furthermore, the density of values for week-to-week was greatest at the middle values, approximately 0 minutes. This demonstrates that at the extreme ends of the relationships, large increases or decreases in week-to-week changes had fewer observations and therefore may have been overly influenced by a small number of observations. A potential alternative method to measure the injury burden would be using median severity rather than mean severity (Bult et al., Citation2018). This would reduce the influence of skewed data, where values of very high injury burden could inflate the mean severity.
The findings of this study should be considered alongside contextual and potentially limiting factors. The data were recorded from one academy over a one season period. As such, whilst the current study was powered to detect moderate-to-strong associations, it was likely underpowered to detect smaller associations with injury risk (Bahr & Holme, Citation2003). Moreover, this sample size resulted in wide confidence intervals for many of the reported effects, such that the true population value could range from trivial to large associations with injury risk. Future studies should build on this work by conducting an a priori sample size calculation to ensure adequate power for detecting effects of interest; it may be the case that a multi-team, collaborative project is required to achieve this. In addition, the results of this work cannot be generalised to other teams and settings, as differences in factors, such as resources and training methods may alter these associations. Future studies should investigate the possibility of using interventions and adapting training protocols to reduce injuries during the adolescent growth spurt. Another consideration for future research is using training load rather than exposure, which could be measured through Session RPE (time × RPE) or Global Navigation Satellite Systems metrics (e.g., total distance, accelerations, decelerations, and high-speed running). Understanding both the internal and external training demands could aid in the quantification of specific physical demands during adolescence (Impellizzeri et al., Citation2019). The training load and intensity of the session could have differed between players and groups in our study, but this information was not registered at the individual level. The final consideration is that outside the academy activity was not considered in this analysis; future studies should consider how much activity youth footballers do both inside and outside of the academy environment to understand the complete “load-injury” relationship.
Based on the present findings, the authors recommend that football academies and other youth sports coaches measure growth rate, lower-limb growth rate and maturity status to identify at-risk individuals. Clubs should also monitor large increases in exposure to avoid a rapid overload of players that might lead to a greater likelihood of injury. Clubs should aim to develop interventions targeted at reducing the injury incidence and burden observed during these high-risk phases of adolescence. For example, adaptions to training load (Savelsbergh et al., Citation2018), strength programmes (Kaya et al., Citation2013; Rathleff et al., Citation2020), fundamental movement skills (Savelsbergh et al., Citation2018) or other potential solutions could be investigated. Furthermore, practitioners should develop appropriate injury prevention strategies, to reduce the increase in injury risk seen during PHV. One example of this is Horobeanu et al. (Citation2017), who demonstrated that monitoring maturation and symptoms of overuse injury, and reducing training load in response to these “flags”, reduced the days missed due to Osgood Schlatters disease in adolescent squash players. However, this study was limited in terms of sample size and further research is required to validate these findings. Overall, examples of empirically based and well-controlled interventions in this area are currently lacking, and so the authors recommend that practitioners take a pragmatic approach to potential strategies using the current evidence available.
Overall, this study has provided further evidence for the relationships between growth rate, lower-limb growth rate, maturity status and changes in total exposure with injury incidence and injury burden. Furthermore, this study has shown how understanding the interaction between growth rate and Percentage of Predicted Adult Stature with injury, which can be used in practice to identify adolescent academy football players at a greater likelihood of injury.
Disclosure statement
No potential conflict of interest was reported by the author(s).
Additional information
Funding
References
- Adirim, T. A., & Cheng, T. L. (2003). Overview of injuries in the young athlete. Sports Medicine, 33(1), 75–81. https://doi.org/10.2165/00007256-200333010-00006
- Bahr, R., & Holme, I. (2003). Risk factors for sports injuries—a methodological approach. British Journal of Sports Medicine, 37(5), 384–392. https://doi.org/10.1136/bjsm.37.5.384
- Bates, D., Mächler, M., Bolker, B., & Walker, S. (2014). Fitting linear mixed-effects models using lme4. arXiv preprint arXiv:1406.5823. https://arxiv.org/pdf/1406.5823.pdf
- Buchheit, M., & Mendez-Villanueva, A. (2014). Effects of age, maturity and body dimensions on match running performance in highly trained under-15 soccer players. Journal of Sports Sciences, 32(13), 1271–1278. https://doi.org/10.1080/02640414.2014.884721
- Bult, H. J., Barendrecht, M., & Joeri Ramon Tak, I. (2018). Injury risk and injury burden are related to age group and peak height velocity among talented male youth soccer players. Orthopaedic Journal of Sports Medicine, 6(12), 1–10. https://doi.org/10.1177/2325967118811042
- Cross, M. J., Williams, S., Trewartha, G., Kemp, S. P. T., & Stokes, K. A. (2016). The influence of in-season training loads on injury risk in professional rugby union. International Journal of Sports Physiology and Performance, 11(3), 350–355. https://doi.org/10.1123/ijspp.2015-0187
- Epstein, L. H., Valoski, A. M., Kalarchian, M. A., & McCurley, J. (1995). Do children lose and maintain weight easier than adults: A comparison of child and parent weight changes from six months to ten years. Obesity Research, 3(5), 411–417. https://doi.org/10.1002/j.1550-8528.1995.tb00170.x
- Fuller, C. W. (2018). Injury risk (Burden), risk matrices and risk contours in team sports: A review of principles, practices and problems. Sports Medicine, 48(7), 1597–1606. https://doi.org/10.1007/s40279-018-0913-5
- Fuller, C. W., Ekstrand, J., Junge, A., Andersen, T. E., Bahr, R., Dvorak, J., Hägglund, M., McCrory, P., & Meeuwisse, W. H. (2006). Consensus statement on injury definitions and data collection procedures in studies of football (soccer) injuries. Scandinavian Journal of Medicine & Science in Sports, 16(2), 83–92. https://doi.org/10.1111/j.1600-0838.2006.00528.x
- Goto, H., Morris, J. G., & Nevill, M. E. (2015a). Match analysis of U9 and U10 English premier league academy soccer players using a global positioning system: Relevance for talent identification and development. The Journal of Strength & Conditioning Research, 29(4), 954–963. https://doi.org/10.1519/JSC.0b013e3182a0d751
- Goto, H., Morris, J. G., & Nevill, M. E. (2015b). Motion analysis of U11 to U16 elite English Premier League Academy players. Journal of Sports Sciences, 33(12), 1248–1258. https://doi.org/10.1080/02640414.2014.999700
- Hawkins, D., & Metheny, J. (2001). Overuse injuries in youth sports: Biomechanical considerations. Medicine and Science in Sports and Exercise, 33(10), 1701–1707. https://doi.org/10.1097/00005768-200110000-00014
- Hermanussen, M. (2016). Growth in childhood and puberty. In Puberty. Springer. 65–76.
- Hopkins, W., Marshall, S., Batterham, A., & Hanin, J. (2009). Progressive statistics for studies in sports medicine and exercise science. Medicine & Science in Sports & Exercise, 41(1), 3. https://doi.org/10.1249/MSS.0b013e31818cb278
- Horobeanu, C., Jones, T., & Johnson, A. (2017). Can we limit training days lost due to Osgood Schlatters disease in junior squash athletes? British Journal of Sports Medicine, 51(4), 331–332. https://doi.org/10.1136/bjsports-2016-097372.122
- Hulin, B. T., Gabbett, T. J., Blanch, P., Chapman, P., Bailey, D., & Orchard, J. W. (2013). Spikes in acute workload are associated with increased injury risk in elite cricket fast bowlers. British Journal of Sports Medicine 48(8), 708–712. bjsports-2013-092524. http://dx.doi.org/10.1136/bjsports-2013-092524
- Impellizzeri, F. M., Marcora, S. M., & Coutts, A. J. (2019). Internal and external training load: 15 years on. International Journal of Sports Physiology and Performance, 14(2), 270–273. https://doi.org/10.1123/ijspp.2018-0935
- John, C., Lina Rahlf, A., Hamacher, D., & Zech, A. (2019). Influence of biological maturity on static and dynamic postural control among male youth soccer players. Gait & Posture, 68, 18–22. https://doi.org/10.1016/j.gaitpost.2018.10.036
- Johnson, D. M., Williams, S., Bradley, B., Sayer, S., Murray Fisher, J., & Cumming, S. (2019). Growing pains: Maturity associated variation in injury risk in academy football. European Journal of Sport Science, 20(4), 1–21.
- Jones, S., Almousa, S., Gibb, A., Allamby, N., Mullen, R., Einar Andersen, T., & Williams, M. (2019). Injury incidence, prevalence and severity in high-level male youth football: A systematic review. Sports Medicine, 49(12), 1879–1899. https://link.springer.com/article/10.1007/s40279-019-01169-8
- Kaya, D. O., Toprak, U., Baltaci, G., Yosmaoglu, B., & Ozer, H. (2013). Long-term functional and sonographic outcomes in Osgood–Schlatter disease. Knee Surgery, Sports Traumatology, Arthroscopy, 21(5), 1131–1139. https://doi.org/10.1007/s00167-012-2116-1
- Kemper, G. L. J., Van Der Sluis, A., Brink, M. S., Visscher, C., Frencken, W. G. P., & Elferink-Gemser, M. T. (2015). Anthropometric injury risk factors in elite-standard youth soccer. International Journal of Sports Medicine, 36(13), 1112–1117. https://doi.org/10.1055/s-0035-1555778
- Khamis, H. J., & Roche, A. F. (1994). Predicting adult stature without using skeletal age: The Khamis-Roche method. Pediatrics, 94(4 Pt 1), 504–507. https://publications.aap.org/pediatrics/article-abstract/94/4/504/59488/Predicting-Adult-Stature-Without-Using-Skeletal
- Kozieł, S. M., & Malina, R. M. (2017). Modified maturity offset prediction equations: Validation in independent longitudinal samples of boys and girls. Sports Medicine, 48(1), 1–16. https://link.springer.com/article/10.1007/s40279-017-0750-y
- Kozieł, S. M., & Malina, R. M. (2018). Modified maturity offset prediction equations: Validation in independent longitudinal samples of boys and girls. Sports Medicine, 48(1), 221–236. https://doi.org/10.1007/s40279-017-0750-y
- Krabak, B. J., Roberts, W. O., Tenforde, A. S., Ackerman, K. E., Emilio Adami, P., Baggish, A. L., Barrack, M., Cianca, J., Davis, I., D’Hemecourt, P., Fredericson, M., Goldman, J. T., Harrast, M. A., Heiderscheit, B. C., Hollander, K., Kraus, E., Luke, A., Miller, E., Moyer, M., … Wasfy, M. M. (2021). Youth running consensus statement: Minimising risk of injury and illness in youth runners. British Journal of Sports Medicine, 55(6), 305–318. https://doi.org/10.1136/bjsports-2020-102518
- Law, G., & Bloyce, D. (2019). Pressure to play?’ A sociological analysis of professional football managers’ behaviour towards injured players. Soccer & Society, 20(3), 387–407. https://doi.org/10.1080/14660970.2017.1321540
- Lazarus, B. H., Stewart, A. M., White, K. M., Rowell, A. E., Esmaeili, A., Hopkins, W. G., & Aughey, R. J. (2017). Proposal of a global training load measure predicting match performance in an elite team sport. Frontiers in Physiology, 8, 930. https://doi.org/10.3389/fphys.2017.00930
- Lohkamp, M., Kromer, T. O., & Schmitt, H. (2017). Osteoarthritis and joint replacements of the lower limb and spine in ex-professional soccer players: A systematic review. Scandinavian Journal of Medicine & Science in Sports, 27(10), 1038–1049. https://doi.org/10.1111/sms.12846
- Lyman, S., Fleisig, G. S., Andrews, J. R., & David Osinski, E. (2002). Effect of pitch type, pitch count, and pitching mechanics on risk of elbow and shoulder pain in youth baseball pitchers. The American Journal of Sports Medicine, 30(4), 463–468. https://doi.org/10.1177/03635465020300040201
- Makowski, D., Ben-Shachar, M. S., & Lüdecke, D. (2020). The easystats collection of r packages. https://joss.theoj.org/papers/10.21105/joss.01412
- Malina, R. M., Bouchard, C., & Bar-Or, O. (2004). Growth, maturation, and physical activity, ( Human kinetics).
- Marshall, S. W. (2010). Recommendations for defining and classifying anterior cruciate ligament injuries in epidemiologic studies. Journal of Athletic Training, 45(5), 516–518. https://doi.org/10.4085/1062-6050-45.5.516
- Maternea, O., Farooqb, A., & Johnson, A. (2015). Relationship between injuries and somatic maturation in highly trained youth soccer players. International Research in Science and Soccer II, 20, 182.
- Mirwald, R. L., Baxter-Jones, A. D. A. M. D. G., Bailey, D. A., & Beunen, G. P. (2002). An assessment of maturity from anthropometric measurements. Medicine and Science in Sports and Exercise, 34(4), 689–694. https://doi.org/10.1097/00005768-200204000-00020
- Monasterio, X., Gil, S. M., Bidaurrazaga-Letona, I., Lekue, J. A., Santisteban, J., Diaz-Beitia, G., Martin-Garetxana, I., Bikandi, E., & Larruskain, J. (2020). Injuries according to the percentage of adult height in an elite soccer academy. Journal of Science and Medicine in Sport, 24(3), 218–223. https://doi.org/10.1016/j.jsams.2020.08.004
- Olsen, S. J., Fleisig, G. S., Dun, S., Loftice, J., & Andrews, J. R. (2006). Risk factors for shoulder and elbow injuries in adolescent baseball pitchers. The American Journal of Sports Medicine, 34(6), 905–912. https://doi.org/10.1177/0363546505284188
- Parr, J., Winwood, K., Hodson-Tole, E., Deconinck, F. J., Hill, J. P., & Cumming, S. P. (2021). Maturity-Associated Differences in Match Running Performance in Elite Male Youth Soccer Players. International journal of sports physiology and performance, 1(aop), 1–9
- Perini, T. A., de Oliveira, G. L., Dos Santos Ornellas, J., & de Oliveira, F. P. (2005). Technical error of measurement in anthropometry. Revista Brasileira de Medicina do Esporte, 11(1), 81–85. https://doi.org/10.1590/S1517-86922005000100009
- Quatman-Yates, C. C., Quatman, C. E., Meszaros, A. J., Paterno, M. V., & Hewett, T. E. (2012). A systematic review of sensorimotor function during adolescence: A developmental stage of increased motor awkwardness? British Journal of Sports Medicine, 46(9), 649–655. https://doi.org/10.1136/bjsm.2010.079616
- Rathleff, M. S., Winiarski, L., Krommes, K., Graven-Nielsen, T., Hölmich, P., Lykkegaard Olesen, J., Holden, S., & Thorborg, K. (2020). Pain, sports participation, and physical function in 10-14 year olds with patellofemoral pain and Osgood Schlatter: A matched cross-sectional study of 252 adolescents. Journal of Orthopaedic & Sports Physical Therapy, 50(3), 1–26. https://pubmed.ncbi.nlm.nih.gov/31905093/
- Read, P. J., Oliver, J. L., De Ste Croix, M. B. A., Myer, G. D., & Lloyd, R. S. (2018). A prospective investigation to evaluate risk factors for lower extremity injury risk in male youth soccer players. Scandinavian Journal of Medicine & Science in Sports, 28(3), 1244–1251. https://doi.org/10.1111/sms.13013
- Roche, A. F., Tyleshevski, F., & Rogers, E. (1983). Non-invasive measurements of physical maturity in children. Research Quarterly for Exercise and Sport, 54(4), 364–371. https://doi.org/10.1080/02701367.1983.10605321
- Rommers, N., Rössler, R., Goossens, L., Vaeyens, R., Lenoir, M., Witvrouw, E., & D’Hondt, E. (2019). Risk of acute and overuse injuries in youth elite soccer players: Body size and growth matter. Journal of Science and Medicine in Sport, 23(3), 246–251. https://www.sciencedirect.com/science/article/pii/S144024401930355X
- Savelsbergh, G. J. P., Wormhoudt, R., Dicks, M., O’Halloran, J., & Navarro, M. (2018). Creating adaptive athletes: The athletic skills model for enhancing physical literacy as a foundation for expertise. Movement & Sport Sciences - Science & Motricité, (102), 31–38. https://doi.org/10.1051/sm/2019004
- Soligard, T., Schwellnus, M., Alonso, J.-M., Bahr, R., Ben Clarsen, H. P. D., Gabbett, T., Gleeson, M., Hägglund, M., Hutchinson, M. R., Hutchinson, M. R., Janse van Rensburg, C., Khan, K. M., Meeusen, R., Orchard, J. W., Pluim, B. M., Raftery, M., Budgett, R., & Engebretsen, L. (2016). How much is too much?(Part 1) International Olympic Committee consensus statement on load in sport and risk of injury. British Journal of Sports Medicine, 50(17), 1030–1041. https://doi.org/10.1136/bjsports-2016-096581
- Van der Sluis, A., Elferink-Gemser, M. T., Coelhoe Silva, M. J., Nijboer, J. A., Visscher, C, & Brink, M. S. (2014). Sport injuries aligned to peak height velocity in talented pubertal soccer players. International Journal of Sports Medicine, 35(4), 351–355. https://doi.org/10.1055/s-0033-1349874
- Webborn, N. (2012). Lifetime injury prevention: The sport profile model. British Journal of Sports Medicine, 46(3), 193–197. https://doi.org/10.1136/bjsports-2011-090417
- Wik, E. H., Lolli, L., Chamari, K., Materne, O., Di Salvo, V., Gregson, W., & Bahr, R. (2020). Injury patterns differ with age in male youth football: A four-season prospective study of 1111 time-loss injuries in an elite national academy. British Journal of Sports Medicine, 55(14). bjsports-2020-103430. https://doi.org/10.1136/bjsports-2020-103430
- Wik, E. H., Martínez-Silván, D., Farooq, A., Cardinale, M., Johnson, A., & Bahr, R. (2020). Skeletal maturation and growth rates are related to bone and growth plate injuries in adolescent athletics. Scandinavian Journal of Medicine & Science in Sports, 30(5), 894–903. n/a. https://doi.org/10.1111/sms.13635
- Windt, J., Ardern, C. L., Gabbett, T. J., Khan, K. M., Cook, C. E., Sporer, B. C., & Zumbo, B. D. (2018). Getting the most out of intensive longitudinal data: A methodological review of workload–injury studies. BMJ open, 8(10), e022626. https://doi.org/10.1136/bmjopen-2018-022626