
 ?Mathematical formulae have been encoded as MathML and are displayed in this HTML version using MathJax in order to improve their display. Uncheck the box to turn MathJax off. This feature requires Javascript. Click on a formula to zoom.
ABSTRACT
The aim was to investigate the effects of a gym-based strength training intervention on biomechanics and intermuscular coordination patterns during short-term maximal cycling. Twelve track sprint cyclists performed 3 × 4 s seated sprints at 135 rpm, interspersed with 2 × 4 s seated sprints at 60 rpm on an isokinetic ergometer, repeating the session 11.6 ± 1.4 weeks later following a training programme that included two gym-based strength training sessions per week. Joint moments were calculated via inverse dynamics, using pedal forces and limb kinematics. EMG activity was measured for 9 lower limb muscles. Track cyclists ‘leg strength” increased (7.6 ± 11.9 kg, P = 0.050 and ES = 0.26) following the strength training intervention. This was accompanied by a significant increase in crank power over a complete revolution for sprints at 135 rpm (26.5 ± 36.2 W, P = 0.028 and ES = 0.29). The increase in leg strength and average crank power was associated with a change in biceps femoris muscle activity, indicating that the riders successfully adapted their intermuscular coordination patterns to accommodate the changes in personal constraints to increase crank power.
1 Introduction
Coaches of sports requiring maximal effort over a short period of time (< 60s), such as sprint running, track sprint cycling, sprint kayaking (200 m) and bicycle motocross (BMX), often consider strength training (repetitive muscle actions against high loads) to be a fundamental aspect of an athlete’s training programme (Debraux & Bertucci, Citation2011; Delecluse, Citation1997; García-Pallarés & Izquierdo, Citation2011; Parsons, Citation2010). Accordingly, sprint athletes routinely undertake gym-based strength training in addition to sport-specific training with the aim of increasing the muscle size and strength (Burnie et al., Citation2018; Delecluse, Citation1997; García-Pallarés & Izquierdo, Citation2011; Kordi et al., Citation2020; Parsons, Citation2010).
Although coaches from these sprint sports viewed strength training as a fundamental part of sprint athletes’ training programmes, they do not necessarily believe that there is a direct correlation between improvements in ‘gym strength’ (e.g., assessed by the amount of mass that can be lifted in a non-specific strength exercise with gym equipment) and sports performance (Burnie et al., Citation2018). This experiential observation is supported by empirical evidence, which shows that the transfer of strength training to sports performance varies. Generally, there is positive transfer to sports performance (i.e., strength training improves performance), but sometimes, there is no effect or even a negative transfer (i.e., strength training is detrimental to performance, perhaps impeding movement coordination) (Carroll et al., Citation2001; Kordi et al., Citation2020; Moir et al., Citation2007; Young, Citation2006).
Intermuscular coordination is a mechanism which might explain the varying transfer of strength training to sports performance in two ways. First, muscle recruitment patterns associated with a strength training task could inhibit sports performance when expressed during the sport movement (Carroll et al., Citation2001). For example, the strength training programme of a sprint cyclist commonly consists of non-specific strength training exercises, such as squats, deadlifts and leg presses (Parsons, Citation2010). These exercises, however, have very different intermuscular coordination patterns compared to the act of pedalling (Koninckx et al., Citation2010). For instance, when executing a squat, a stable knee joint is very important to decelerate the load at the end of the range of motion (Cormie et al., Citation2011). To achieve this aim, there is significant co-contraction of the hamstrings and quadriceps (Gullett et al., Citation2009; Slater & Hart, Citation2017). This intermuscular coordination pattern is different from coordination patterns required for cycling where co-contraction between the quadriceps and the hamstrings is necessary to provide fine control of the direction of force applied to the pedal, rather than stabilising the knee joint (Dorel et al., Citation2012; Van Ingen Schenau et al., Citation1992). In this way, non-specific strength training could actually impair pedalling coordination, impacting cycling performance.
Second, improvements in sports performance might only occur if the increase in muscle strength is accompanied by concomitant adaptations in intermuscular coordination. This notion that coordination patterns need to be adapted in response to changing personal constraints (e.g., muscle size, strength and fatigue) is captured by key ideas in ecological dynamics (Button et al., Citation2020). For example, Newell’s model of constraints proposes that coordination patterns emerge from the complex interaction of constraints imposed on a movement system (Newell, Citation1986). In support of this notion, Bobbert and van Soest performed a dynamic optimisation analysis using a musculoskeletal simulation model to identify the intermuscular coordination pattern that maximised the vertical jump height for their musculoskeletal model (Bobbert & van Soest, Citation1994). They found that an increase in leg strength must be accompanied by a change in intermuscular coordination for the vertical jump height to increase (Bobbert & van Soest, Citation1994).
Considering the evidence of how strength training might influence coordination, the aim of this study was to investigate the effects of a gym-based strength training intervention on short-term maximal cycling biomechanics and intermuscular coordination patterns. We hypothesised that
muscle recruitment patterns associated with the strength training exercises would inhibit maximal cycling performance due to dissimilarities in movement tendencies.
improvements in maximal cycling performance would only occur if the increase in muscle strength was accompanied by concomitant adaptations in intermuscular coordination.
In order to address our first hypothesis, we observed if the key mechanical features of maximal cycling previously identified in the literature were impaired following a gym-based strength training intervention. For our second hypothesis, we observed if improvements in both gym-based leg strength and cycling performance were accompanied by concomitant changes in the timing or magnitude of muscle activations during maximal cycling.
2 Materials and methods
2.1 Participants
Twelve track sprint cyclists participated in the study. Participants regularly competed at track cycling competitions at either under 23 international level (5), Master’s international and national level (4), or Junior national level (3). Although the participants were varied in their sex, age and anthropometrics (4 males and 8 females, age: 24.1 ± 13.8 yr, body mass: 68.2 ± 11.1 kg, stature: 1.70 ± 0.07 m), they were similar with respect to the cycling performance level (flying 200 m personal best: 11.61 ± 0.90 s). Participants were provided with study details and gave written informed consent. The study was approved by the Sheffield Hallam University Faculty of Health and Wellbeing Research Ethics Sub-Committee.
2.2 Experimental protocol
An isokinetic ergometer was set up to replicate each participants track bicycle position; all participants used a crank length of 165 mm on their track bicycles. Riders undertook their typical warm-up on the ergometer at a self-selected pedalling rate and resistance for at least 10 minutes, followed by one 4 s familiarisation sprint at 135 rpm. Riders then conducted 3 × 4 s seated sprints at a pedalling rate of 135 rpm, interspersed with 2 × 4 s seated sprints at a pedalling rate of 60 rpm on the isokinetic ergometer with 4 minutes recovery between efforts. A pedalling rate of 135 rpm was chosen as this is representative of the pedalling rate during the flying 200 m event in track cycling and within an optimal pedalling rate range for track sprint cyclists (Dorel et al., Citation2005; Kordi et al., Citation2020). Data from the 60 rpm sprints were not analysed in this study. All participants had previous experience of undertaking gym-based strength training, including traditional resistance training exercises. Many of the participants undertook lighter strength training volume in the period immediately prior to the start of the intervention, owing to the proximity of the competition season or end of season training break. The participants then undertook a training programme for 11.6 ± 1.4 weeks of two gym-based strength training sessions per week consisting of traditional resistance training exercises: squats, leg press and deadlift. The weight lifted, number of repetitions and sets of each exercise were prescribed by each participant’s strength and conditioning coach, along with any other supplementary exercises. The overall content of the training programmes was prescribed by the participants’ cycling coaches and typically included at least two track cycling sessions and one road ride of about 60 to 90 minutes in length a week. Following the training period, the participants undertook an identical testing session to the pre-test. Participants were asked to undertake similar training in the preceding 24 hours before both testing sessions.
2.3 Isokinetic ergometer
A SRM Ergometer (Julich, Germany) cycle ergometer frame and flywheel were used to construct an isokinetic ergometer (Burnie et al., Citation2020). The modified ergometer flywheel was driven by a 2.2-kW AC induction motor (ABB Ltd, Warrington, UK). The motor was controlled by a frequency inverter equipped with a braking resistor (Model: Altivar ATV312 HU22, Schneider Electric Ltd, London, UK) (Burnie et al., Citation2020). This set-up enabled participants to start their bouts at the target pedalling rate, rather than expending energy in accelerating the flywheel. The ergometer controlled the pedalling rate within 1 rpm for each session (mean pedalling rate: session 1, 135.1 ± 1.2 rpm, session 2, 135.2 ± 1.1 rpm). The ergometer was fitted with Sensix force pedals (Model ICS4, Sensix, Poitiers, France) and a crank encoder (Model LM13, RLS, Komenda, Slovenia), and sampling data at 200 Hz. Normal and tangential pedal forces were resolved using the crank and pedal angles into the effective (FE – propulsive) and ineffective (FI – applied along the crank) crank forces and total resultant crank force (FT).
2.4 Kinematic and kinetic data acquisition
Two-dimensional kinematic data of each participant’s left side were recorded at 100 Hz using one high-speed video camera with infrared ring lights (Model: UI-522xRE-M, IDS, Obersulm, Germany; Burnie et al., Citation2020). The camera was perpendicular to the participant, centred and set approximately 3 m from the ergometer. Reflective markers were placed on the pedal spindle, lateral malleolus, lateral femoral condyle and greater trochanter. The same researcher attached the markers for all sessions. Kinematics and kinetics on the ergometer were recorded using CrankCam software (CSER, SHU, Sheffield, UK), which synchronised the camera and pedal force data (down sampled to 100 Hz to match the camera data) and was used for data processing, including auto-tracking of the marker positions.
2.5 EMG data acquisition
EMG signals were recorded continuously from nine muscles of the left leg: vastus lateralis (VL), rectus femoris (RF), vastus medialis (VM), tibialis anterior (TA), long head of biceps femoris (BF), semitendinosus (ST), lateralis gastrocnemius (GL), soleus (SO) and gluteus maximus (GMAX) with Delsys Trigno wireless surface EMG sensors (Delsys Inc, Boston, MA, USA). The skin at the electrode placement sites was prepared by shaving the area and then cleaning it with an alcohol wipe. The EMG sensors were then placed in the centre of the muscle belly – with the bar electrodes perpendicular to the muscle fibre orientation and secured using wraps to reduce motion artefacts during pedalling. The same researcher attached the EMG sensors for all sessions. A Delsys analogue sensor was connected to a reed switch which was fitted to the ergometer, so it omitted a pulse when the left crank arm passed the top dead centre (TDC). The EMG system was operated and recorded in EMGworks Acquisition software (Delsys Inc, Boston, MA, USA), sampling data at 1926 Hz. The Delsys Trigno EMG system automatically applied a bandwidth filter of 20 ± 5 Hz to 450 ± 50 Hz (>80 dB/dec) to the raw signals.
2.6 Leg strength
A back squat exercise was used to evaluate the effectiveness of strength training programmes in improving ’leg strength’ as recommended by Parsons (Citation2010). Participants reported details of the weight lifted, repetitions and sets for the squat they performed in their gym session closest to the laboratory testing sessions. To allow comparison of the ’leg strength’ between participants and sessions, squat predicted one repetition maximum (1RM) (how much weight an individual can lift for one repetition), which was calculated using the formula in Brzycki (Citation1993).
2.7 Data processing
All kinetic and kinematic data were filtered using a Butterworth fourth order (zero lag) low-pass filter using a cut-off frequency of 14 Hz, which was selected using residual analysis (Winter, Citation2009). The same cut-off frequency was chosen for the kinematic and kinetic data as recommended by Bezodis and colleagues to avoid data processing artefacts in the calculated joint moments (Bezodis et al., Citation2013). Instantaneous left crank power was calculated from the product of the left crank torque and the crank angular velocity. The average left crank power was calculated by averaging the instantaneous left crank power over a complete pedal revolution. Joint angles were calculated using the same convention as Burnie et al. (Citation2020). Joint moments were calculated via inverse dynamics (Elftman, Citation1939), using pedal forces, limb kinematics and body segment parameters (De Leva, Citation1996). Joint extension moments were defined as positive and joint flexion moments as negative. Joint powers at the ankle, knee and hip were determined by taking the product of the net joint moment and joint angular velocity. The power transferred across the hip joint was calculated as the dot product of hip joint reaction force and linear velocity (Martin & Brown, Citation2009).
Data were analysed using a custom Matlab (R2017a, MathWorks, Cambridge, UK) script. Each sprint lasted for 4 s, so provided six complete crank revolutions at 135 rpm. Crank forces and powers, joint angles, angular velocities, moments and powers were resampled to 100 data points around the crank cycle. The mean value at each time point was then calculated to obtain a single ensemble-averaged time series for each trial. Owing to technical problems for two participants, their session average for the sprints at 135 rpm were calculated from two instead of three sprints.
Relative distribution of joint powers has been used as a measure of coordination in cycling (Korff et al., Citation2009). To calculate relative joint powers, the joint powers were averaged over the extension and flexion phases as defined by the joint angular velocities (positive velocity for extension and negative velocity for flexion) and then normalised to average left crank power over a complete revolution.
The raw EMG signals for the 135 rpm sprint efforts were high pass filtered (Butterworth second order, cut-off frequency 30 Hz) to diminish motion artefacts (De Luca et al., Citation2010) and root mean squared (RMS, 25 ms window) and then low pass filtered (Butterworth second order, cut-off frequency 24 Hz; Brochner Nielsen et al., Citation2018). To synchronise the EMG data with the kinetic and kinematic data, the TDC locations obtained from the analogue sensor were matched to the corresponding TDCs measured by the crank encoder. The data were then interpolated to 100 data points around the crank cycle (using the spline interpolation method) and then averaged over six crank revolutions to create a linear envelope for each muscle. The EMG signals were normalised to the mean value in the linear envelope across the crank cycle for each muscle. Due to noisy EMG data for specific muscles for several participants, the EMG linear envelopes for these muscles were created from averaging one or two sprints instead of three.
2.8 Assessment of key mechanical features of maximal cycling
Several key mechanical features that represent functional maximal cycling coordination patterns have been identified from previous research: first, the hip and ankle joint work in synergy during the downstroke, to enable the ankle to transfer the power produced by the hip extensor muscles to the crank (Fregly & Zajac, Citation1996; Raasch et al., Citation1997); second, the direction of the external force on the pedal, so that it is directed more effectively (tangentially) (Van Ingen Schenau et al., Citation1992) and third, cyclists actively pull up during the upstroke generating positive crank power in maximal cycling when pedalling at, or below, optimal pedalling rates (Dorel et al., Citation2010).
The strength of the hip-ankle synergy was quantified by the frequency of in-phase coordination patterns between the hip and ankle moments in the downstroke, which was calculated using a vector coding method (Chang et al., Citation2008). The direction of the external force applied to the pedal was assessed by comparing the index of mechanical effectiveness (IE) pre- and post-strength training intervention (Dorel et al., Citation2010). The role of the upstroke in power generation in maximal cycling was assessed by comparing the IE and average crank power produced in the upstroke sector pre- and post-strength training intervention.
2.9 Quantifying Hip-ankle joint synergy
It has been suggested that the hip and ankle joints need to work in synergy to transfer the power produced at the hip joint to the crank (Fregly & Zajac, Citation1996; Raasch et al., Citation1997). Therefore, to quantify hip-ankle joint coordination and the strength of the hip-ankle joint synergy, a vector coding technique was used (Chang et al., Citation2008). Vector coding is typically applied to kinematic data to quantify inter-segment coordination from segmental angle-angle diagrams (Chang et al., Citation2008). The vector coding method was applied to joint moment-moment diagrams, as these were the most appropriate variables to investigate the hip-ankle synergy, as Fregly and Zajac identified that the net hip and ankle joint torques act in synergy during the downstroke (Fregly & Zajac, Citation1996). A modified vector coding technique was used to calculate the coupling angle (γi) from the hip-ankle moment diagrams for each point on the crank cycle (the joint moment data had been interpolated to 101 equally spaced data points around the crank cycle) (Chang et al., Citation2008). The coupling angle was defined as the orientation of the vector (relative to the right horizontal) between two adjacent points on the moment-moment plot.
The coupling angle was calculated for each instant of the crank cycle for all revolutions of the sprints at 135 rpm for each participant. Since the coupling angles are directional in nature, the mean coupling angles for each participant were computed using circular statistics (Batschelet, Citation1981). The mean coupling angle for each participant was categorised into four coordination phases: in-phase, anti-phase, hip-phase and ankle-phase based on the system proposed by Chang et al. (Citation2008).
When the coupling angle values are 45° and 225° (a positive diagonal), the components are in-phase: both the hip and ankle moments are increasing or decreasing at similar rates, i.e., the hip and ankle joints are working in synergy. Conversely, when the coupling angles are 135° and 315° (a negative diagonal), the couple is anti-phase. For example, the hip moment is increasing, whilst the ankle moment is decreasing. When coupling angles are parallel to the horizontal (0° and 180°), the ankle moment is changing but not the hip moment – ankle phase. When coupling angles are parallel to the vertical (90° and 270°), the hip moment is changing but not the ankle moment – hip-phase. Since the coupling angles rarely lie precisely on these angles, the unit circle was split into 45° bins as used by Chang et al. (Citation2008). The frequency the mean coupling angle () lay within each of these coordination patterns during the downstroke (defined between crank angles of 0 to 180°) was calculated for each participant for each session.
2.10 Index of mechanical effectiveness (IE)
The overall index of mechanical effectiveness (IE) for the complete crank cycle was determined as the ratio of the linear impulse of FE to linear integral of FT (Dorel et al., Citation2010; Lafortune & Cavanagh, Citation1983). Mean values of the FE, FT, crank power and IE were calculated for the four functional angular sectors of the crank cycle (Dorel et al., Citation2010). The values of force and power output for the different sectors were weighted by the size of each sector relative to the entire crank cycle (i.e., 60/360 for the top, 120/360 for the downstroke).
2.11 Statistical analysis
Statistical tests for discrete variables were performed using IBM SPSS Statistics Version 24 (IBM UK Ltd, Portsmouth, UK). Differences between discrete values between pre- and post-strength training intervention were assessed using paired t-tests for the normally distributed variables and Wilcoxon matched-pairs tests for the non-parametric variables (coordination phase frequencies). Differences between time series data (instantaneous crank powers, crank forces, joint angles, angular velocities, moments, powers and normalised EMG linear envelopes) between pre- and post-strength training intervention were assessed using statistical parametric mapping (SPM); paired t-tests were used for all variables except crank forces where Hotelling’s paired T2 test was used (Pataky, Citation2010). Crank force consists of two vector components (effective and ineffective crank force), and therefore, a multivariate statistical test was required. The level of statistical significance was set to P < 0.05 for all tests. Effect size (ES) values were calculated for all parametric discrete variables. ES values were interpreted using Cohen’s classification system: effect sizes between 0.2 and 0.5 were considered small, between 0.5 and 0.8 were considered moderate and greater than 0.8 were considered large (Cohen, Citation1988).
3 Results
3.1 Discrete variables
Squat predicted 1RM increased following the strength training intervention (pre: 108.6 ± 29.5 kg, post: 116.2 ± 28.5 kg). This increase was very close to being statistically significant (P = 0.050, ES = 0.26). Average left crank power over a complete revolution for sprints at 135 rpm significantly increased post-strength training intervention (pre: 467.6 ± 88.9 W, post: 494.1 ± 91.2 W, P = 0.028, ES = 0.29).
There were no significant differences in IE for the complete crank cycle or for each of the four functional sectors between pre- and post-strength training intervention (). Average crank power in the bottom sector significantly increased post strength training intervention (, P = 0.007).
Table 1. Index of mechanical effectiveness (IE) and average crank power for the four functional sectors for sprints at 135 rpm: pre- and post-strength training intervention (left side only).
3.2 Time series variables
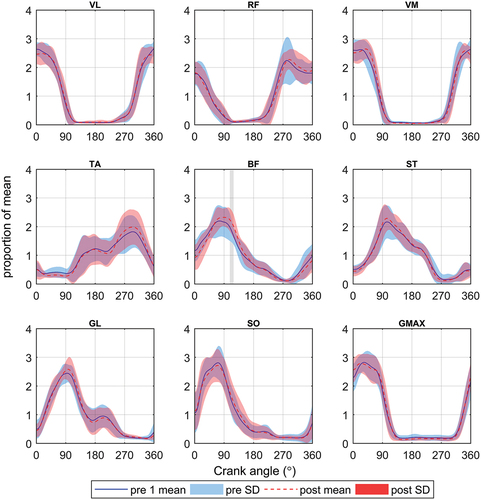
Knee joint angular velocity was significantly smaller (P < 0.05) post-strength training intervention between crank angles 348° and 4° (). Negative knee joint power was significantly greater (P < 0.05) post-strength training intervention between crank angles 337° to 342° (). There were no significant differences between instantaneous crank powers, forces and other joint angles, angular velocities, moments and powers, pre- to post-intervention (). There were no significant differences between relative joint extension and flexion powers between pre and post strength training intervention (). Similarly, there were no significant differences between the frequency of the hip-ankle moment coordination phases during the downstroke between pre- and post-strength training intervention (). Finally, the EMG activity for the BF muscle was significantly greater (P < 0.05) post-strength training intervention between crank angles 107° and 119°, but there were no other significant differences between pre- and post-intervention EMG activity for the other muscles ().
Figure 1. Crank power for sprints at 135 rpm: pre- and post-strength training intervention.
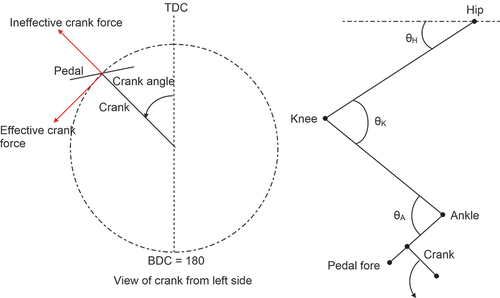
Figure 2. Crank forces for sprints at 135 rpm: pre and post strength training intervention. A: Crank force separated into effective and ineffective components and B: Visualisation of crank forces.
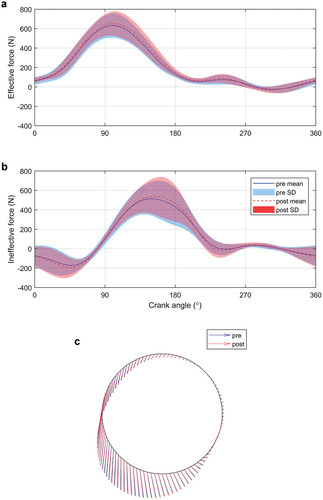
Figure 3. Joint angles, angular velocities, moments and powers for sprints at 135 rpm: pre- and post-strength training intervention. Areas of the graph is shaded grey where the SPM is significant (P < 0.05). For ease of presenting the data, the thigh angle and angular velocity are presented as Hip angle and angular velocity.
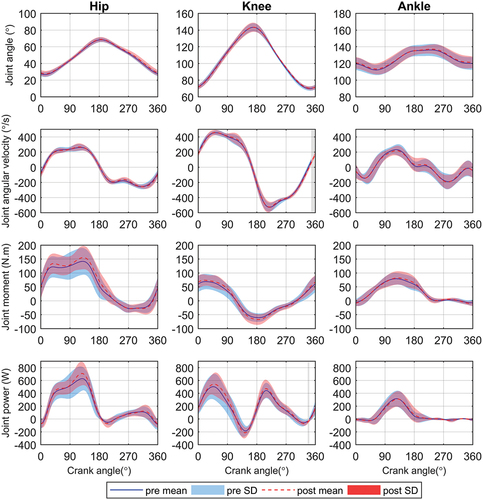
Figure 4. Relative joint powers in extension and flexion phases for sprints at 135 rpm: pre- and post-strength training intervention. HTP = Hip transfer power. The P values and effect sizes for relative joint powers in extension and flexion between pre- and post-strength intervention: Ankle extension: P = 0.284, ES = −0.38, Ankle flexion: P = 0.784, ES = −0.06, Knee extension: P = 0.776, ES = 0.12, Knee flexion: P = 0.921, ES = 0.03, Hip extension: P = 0.924, ES = 0.04, Hip flexion: P = 0.838, ES = −0.04, HTP extension: P = 0.775, ES = 0.04, HTP flexion: P = 0.406 and ES = 0.24.
Figure 5. Hip-ankle moment coordination patterns during the downstroke phase of the crank cycle for sprints at 135 rpm: pre- and post-strength training intervention. The P values for coordination patterns between pre- and post-strength intervention are as follows: In-phase: P = 0.428, anti-phase: P = 0.939, Hip phase: P = 0.311 and Ankle phase: P = 0.632.
Figure 6. EMG linear envelopes (normalised to mean value in signal) for each muscle for sprints at 135 rpm: pre- and post-strength training intervention. VL = vastus lateralis, RF = rectus femoris, VM = vastus medialis, TA = tibialis anterior, BF = biceps femoris, ST = semitendinosus, GL = gastrocnemius lateralis, SO = soleus, GMAX = gluteus maximus. Areas of the graph are shaded grey where the SPM is significant (P< 0.05).
4 Discussion
This study investigated the acute effects of a strength training intervention on the biomechanics and intermuscular coordination in short-term maximal cycling. ;Leg strength”, as quantified by squat predicted 1RM increased post strength training intervention. This change was accompanied by a significant increase in average crank power, supporting the findings of previous research that strength training positively correlates with cycling power (Stone et al., Citation2004). There was no impairment of the key mechanical features of maximal cycling following the strength training intervention, indicating that cycling performance was not impaired due to dissimilarities in movement tendencies between the gym-based strength training intervention and maximal cycling. Furthermore, these increases in leg strength and average crank power were associated with a change in BF muscle activity, indicating that the riders successfully adapted their intermuscular coordination patterns to accommodate the changes in personal constraints (leg strength) to increase crank power.
We hypothesised that muscle recruitment patterns associated with the strength training exercises would inhibit maximal cycling performance. There was no evidence that cycling biomechanics were impaired by the strength training. We found no change in the strength of the hip-ankle synergy in the downstroke, the IE in all crank sectors or the upstroke power following the strength training intervention. This implies that the direction of applied force was unchanged following the strength training intervention. These findings suggest that the coordination patterns used in strength training exercises’ were not expressed during maximal cycling following the strength training intervention and did not impair maximal cycling biomechanics and performance.
We also hypothesised that improvements in maximal cycling performance would only occur if increases in muscle strength are accompanied by concomitant adaptations in intermuscular coordination. Following the strength training intervention, there was a change in BF muscle activity for a region of the crank cycle (107° to 119°). Although this region of difference is relatively small, the biarticular hamstring muscles are particularly important in the control of the direction of the external force applied on the pedal (Van Ingen Schenau et al., Citation1992) – a key mechanical feature of maximal cycling. The IE was unchanged in all crank sectors following the strength training intervention, suggesting that the direction of applied force was unchanged following the strength training intervention. However, the change in BF muscle activity could be to maintain the same IE. When interpreting the EMG activity in relation to muscle force, the electromechanical delay (EMD – time between EMG activity and production of mechanical force) needs to be considered. This is typically around 50 ms (Cavanagh & Komi, Citation1979), which at 135 rpm equates to 50° of the crank cycle. Taking into account the EMD when interpreting the BF muscle activity could mean that the hamstring muscles were producing force for slightly longer and with greater magnitude in the bottom sector of the crank cycle, potentially explaining the increase in the bottom sector crank power following strength training. This finding suggests that riders successfully adapted their intermuscular coordination patterns to accommodate the changes in personal constraints to increase crank power. Supporting the arguments that muscle coordination patterns need to change in response to different physical constraints and might explain the overall increase in cycling power observed in our participants; i.e., participants improved sports performance by concomitant adaptations in coordination together with muscle strength changes.
This study did not include a long-term follow up testing session (such as 8 to 10 weeks following the completion of the strength training intervention). It was therefore not possible to assess whether the participants continued to adapt their coordination patterns after a period of cycling-focused training to use their increased muscle strength developed during the gym-based strength training period. This issue for future research was suggested by Bobbert and van Soest who recommended a period of sports-specific training was required following strength training to allow athletes to adapt their intermuscular coordination patterns to use their increased muscle strength obtained from strength training to improve their sports performance (Bobbert & van Soest, Citation1994).
A limitation of this study concerns the lack of a control group (i.e., a group that did cycling training sessions only during the intervention period). However, as the aim was to recruit elite and high-level track sprint cyclists as participants for this study, it would have been unethical to ask one sample of elite athletes to act as controls for treatment groups owing to the potential for interference in their scheduled training for high-level competitions. This issue, however, makes it difficult to ascertain whether the changes/lack of changes are due solely to the strength training intervention. The use of elite and high-level athletes also meant that it was not possible to standardise the content of the strength training programmes (number of sessions per week, exercise sets and reps), although the programmes all included similar exercises, as it was infeasible to interfere with their performance preparation to such a large extent. Therefore, a more observational analytic approach was implemented in this study to advance our understanding further of elite athletes which are not well represented in scientific research (Williams & Kendall, Citation2007).
Track sprint cyclists’ ’leg strength’ increased following a strength training intervent,ion' and this was accompanied by a significant increase in average crank power. There was no impairment of the key mechanical features of maximal cycling following the strength training intervention, indicating that cycling performance was not impaired due to dissimilarities in movement tendencies between the gym-based strength training intervention and maximal cycling. Furthermore, these increases in leg strength and average crank power were associated with a change in BF muscle activity, indicating that the riders successfully adapted their intermuscular coordination patterns to accommodate the changes in personal constraints (leg strength) to increase crank power. This study provides support for the inclusion of ‘gym-based’” strength training in track sprint cyclists training programmes, as it contributed to an increase in crank power. Further research is required to investigate how cyclists’ intermuscular coordination patterns adapt after different training phases throughout a season, where the components of the training programmes change.
Acknowledgments
The authors are grateful to Todd Pataky for all his help and advice on using and implementing statistical parametric mapping.
Disclosure statement
The authors have no interest to declare.
Additional information
Funding
References
- Batschelet, E. (1981). Circular statistics in biology. Academic Press.
- Bezodis, N. E., Salo, A. I. T., & Trewartha, G. (2013). Excessive fluctuations in knee joint moments during early stance in sprinting are caused by digital filtering procedures. Gait & Posture, 38(4), 653–657. https://doi.org/10.1016/j.gaitpost.2013.02.015
- Bobbert, M. F., & van Soest, A. J. (1994). Effects of muscle strengthening on vertical jump height: A simulation study. Medicine and Science in Sports and Exercise, 26(8), 1012–1020. https://doi.org/10.1249/00005768-199408000-00013
- Brochner Nielsen, N., Hug, F., Guevel, A., Colloud, F., Lardy, J., & Dorel, S. (2018). Changes in motor coordination induced by local fatigue during a sprint cycling task. Medicine and Science in Sports and Exercise, 50(7), 1394–1404. https://doi.org/10.1249/MSS.0000000000001572
- Brzycki, M. (1993). Strength testing—predicting a one-rep max from reps-to-fatigue. Journal of Physical Education, Recreation & Dance, 64(1), 88–90. https://doi.org/10.1080/07303084.1993.10606684
- Burnie, L., Barratt, P., Davids, K., Stone, J., Worsfold, P., & Wheat, J. (2018). Coaches’ philosophies on the transfer of strength training to elite sports performance. International Journal of Sports Science & Coaching, 13(5), 729–736. https://doi.org/10.1177/1747954117747131
- Burnie, L., Barratt, P., Davids, K., Worsfold, P., & Wheat, J. (2020). Biomechanical measures of short-term maximal cycling on an ergometer: A test-retest study. Sports Biomechanics, 1–19. https://doi.org/10.1080/14763141.2020.1773916
- Button, C., Seifert, L., Chow, J., Araújo, D., & Davids, K. (Eds.). (2020). Dynamics of skill acquisition: An ecological dynamics rationale (2nd ed.). Human Kinetics.
- Carroll, T. J., Riek, S., & Carson, R. G. (2001). Neural adaptations to resistance training. Sports Medicine, 31(12), 829–840. https://doi.org/10.2165/00007256-200131120-00001
- Cavanagh, P. R., & Komi, P. (1979). Electromechanical delay in human skeletal muscle under concentric and eccentric contractions. European Journal of Applied Physiology and Occupational Physiology, 42(3), 159–163. https://doi.org/10.1007/BF00431022
- Chang, R., Van Emmerik, R., & Hamill, J. (2008). Quantifying rearfoot–forefoot coordination in human walking. Journal of Biomechanics, 41(14), 3101–3105. https://doi.org/10.1016/j.jbiomech.2008.07.024
- Cohen, J. (1988). Statistical power analysis for the behavioral sciences (2nd ed.). L. Erlbaum Associates.
- Cormie, P., McGuigan, M. R., & Newton, R. U. (2011). Developing maximal neuromuscular power: Part 2 - training considerations for improving maximal power production. Sports Medicine, 41(2), 125–146. https://doi.org/10.2165/11538500-000000000-00000
- de Leva, P. (1996). Adjustments to zatsiorsky-seluyanov’s segment inertia parameters. Journal of Biomechanics, 29(9), 1223–1230. https://doi.org/10.1016/0021-9290(95)00178-6
- De Luca, C. J., Gilmore, L. D., Kuznetsov, M., & Roy, S. H. (2010). Filtering the surface EMG signal: Movement artifact and baseline noise contamination. Journal of Biomechanics, 43(8), 1573–1579. https://doi.org/10.1016/j.jbiomech.2010.01.027
- Debraux, P., & Bertucci, W. (2011). Muscular determinants of performance in BMX during exercises of maximal intensity. Computer Methods in Biomechanics and Biomedical Engineering, 14(sup1), 49–51. https://doi.org/10.1080/10255842.2011.591637
- Delecluse, C. (1997). Influence of strength training on sprint running performance. Sports Medicine, 24(3), 147–156. https://doi.org/10.2165/00007256-199724030-00001
- Dorel, S., Couturier, A., Lacour, J. R., Vandewalle, H., Hautier, C., & Hug, F. (2010). Force-velocity relationship in cycling revisited: Benefit of two-dimensional pedal forces analysis. Medicine and Science in Sports and Exercise, 42(6), 1174–1183. https://doi.org/10.1249/MSS.0b013e3181c91f35
- Dorel, S., Guilhem, G., Couturier, A., & Hug, F. (2012). Adjustment of muscle coordination during an all-out sprint cycling task. Medicine and Science in Sports and Exercise, 44(11), 2154–2164. https://doi.org/10.1249/MSS.0b013e3182625423
- Dorel, S., Hautier, C. A., Rambaud, O., Rouffet, D., Praagh, E. V., Lacour, J. R., & Bourdin, M. (2005). Torque and power-velocity relationships in cycling: Relevance to track sprint performance in world-class cyclists. International Journal of Sports Medicine, 26(9), 739–746. https://doi.org/10.1055/s-2004-830493
- Elftman, H. (1939). Forces and energy changes in the leg during walking. American Journal of Physiology, 125(2), 339–356. https://doi.org/10.1152/ajplegacy.1939.125.2.339
- Fregly, B. J., & Zajac, F. E. (1996). A state-space analysis of mechanical energy generation, absorption, and transfer during pedaling. Journal of Biomechanics, 29(1), 81–90. https://doi.org/10.1016/0021-9290(95)00011-9
- García-Pallarés, J., & Izquierdo, M. (2011). Strategies to optimize concurrent training of strength and aerobic fitness for rowing and canoeing. Sports Medicine, 41(4), 329–343. https://doi.org/10.2165/11539690-000000000-00000
- Gullett, J. C., Tillman, M. D., Gutierrez, G. M., & Chow, J. W. (2009). A biomechanical comparison of back and front squats in healthy trained individuals. Journal of Strength and Conditioning Research, 23(1), 284–292. https://doi.org/10.1519/JSC.0b013e31818546bb
- Koninckx, E., Van Leemputte, M., & Hespel, P. (2010). Effect of isokinetic cycling versus weight training on maximal power output and endurance performance in cycling. European Journal of Applied Physiology, 109(4), 699–708. https://doi.org/10.1007/s00421-010-1407-9
- Kordi, A. M., Folland, J., Goodall, S., Menzies, C., Patel, T. S., Evans, M., Thomas, K., & Howatson, G. (2020). Cycling-specific isometric resistance training improves peak power output in elite sprint cyclists. Scandinavian Journal of Medicine & Science in Sports, 30(9), 1594–1604. https://doi.org/10.1111/sms.13742
- Korff, T., Hunter, E. L., & Martin, J. C. (2009). Muscular and non-muscular contributions to maximum power cycling in children and adults: Implications for developmental motor control. The Journal of Experimental Biology, 212(5), 599–603. https://doi.org/10.1242/jeb.020180
- Lafortune, M. A., & Cavanagh, P. R. (1983). Effectiveness and efficiency during bicycle riding. In H. Matsui & K. Kobayashi (Eds.), Biomechanics VIIB: International series on sports science 4B (pp. 928–936). Human Kinetics.
- Martin, J. C., & Brown, N. A. T. (2009). Joint-specific power production and fatigue during maximal cycling. Journal of Biomechanics, 42(4), 474–479. https://doi.org/10.1016/j.jbiomech.2008.11.015
- Moir, G., Sanders, R., Button, C., & Glaister, M. (2007). The effect of periodized resistance training on accelerative sprint performance. Sports Biomechanics, 6(3), 285–300. https://doi.org/10.1080/14763140701489793
- Newell, K. M. (1986). Constraints on the development of coordination. In M. Wade & H. Whitling (Eds.), Motor development in children: Aspects of coordination and control (pp. 341–360). Martinus Nijhoff.
- Parsons, B. (2010). Resistance training for elite-level track cyclists. Strength and Conditioning Journal, 32(5), 63–68. https://doi.org/10.1519/SSC.0b013e3181e97d97
- Pataky, T. C. (2010). Generalized n-dimensional biomechanical field analysis using statistical parametric mapping. Journal of Biomechanics, 43(10), 1976–1982. https://doi.org/10.1016/j.jbiomech.2010.03.008
- Raasch, C. C., Zajac, F. E., Ma, B., & Levine, W. S. (1997). Muscle coordination of maximum-speed pedaling. Journal of Biomechanics, 30(6), 595–602. https://doi.org/10.1016/S0021-9290(96)00188-1
- Slater, L. V., & Hart, J. M. (2017). Muscle activation patterns during different squat techniques. Journal of Strength and Conditioning Research, 31(3), 667–676. https://doi.org/10.1519/JSC.0000000000001323
- Stone, M. H., Sands, W. A., Carlock, J., Callan, S., Dickie, D., Daigle, K., Cotton, J., Smith, S. L., & Hartman, M. (2004). The importance of isometric maximum strength and peak rate-of-force development in sprint cycling. Journal of Strength and Conditioning Research, 18(4), 878–884. https://doi.org/10.1519/14874.1
- van Ingen Schenau, G. J., Boots, P. J. M., De Groot, G., Snackers, R. J., & van Woensel, W. W. L. M. (1992). The constrained control of force and position in multi-joint movements. Neuroscience, 46(1), 197–207. https://doi.org/10.1016/0306-4522(92)90019-X
- Williams, S. J., & Kendall, L. R. (2007). A profile of sports science research (1983–2003). Journal of Science and Medicine in Sport, 10(4), 193–200. https://doi.org/10.1016/j.jsams.2006.07.016
- Winter, D. A. (2009). Biomechanics and motor control of human movement (4th ed.). Wiley.
- Young, W. B. (2006). Transfer of strength and power training to sports performance. International Journal of Sports Physiology and Performance, 1(2), 74–83. https://doi.org/10.1123/ijspp.1.2.74