
ABSTRACT
A simple and accurate method of determining foot strike angle (FSA) during running can simplify data collections and validations of wearable sensors. The purpose of this study was to determine the validity of two simplified methods for estimating FSA and foot angle (throughout the ground contact) from three-dimensional kinematics. Markers were placed on the heel and head of the second metatarsal (HEEL-TOE) or on the lateral side of the head of the fifth metatarsal (HEEL-MET5). When compared to the reference foot segment, the HEEL-TOE method performed similarly with a minimal mean difference (0.28° [0.19°,0.36°], p < 0.001), a high Pearson’s r (r = 0.994; p < 0.001), and low bias (−0.20°±1.05°). Alternatively, the HEEL-MET5 method underestimated FSA: mean difference = 4.28° [4.07°,4.91°] (p < 0.001), Pearson’s r = 0.968 (p < 0.001), and bias = −4.58°±2.61°. Throughout the contact phase, significant SPM cluster regions were identified, indicating that the HEEL-MET5 method underestimated the angle of the foot for all foot strike patterns in the first 23–34% of the stance (p < 0.025). This study supports the idea that the HEEL-TOE method can be used as a simplified method for determining FSA from 3D kinematics. Researchers should proceed with caution when employing the HEEL-MET5 method, as it is likely underestimating FSA due to foot inversion in the early stance phase.
Introduction
The foot strike pattern (FSP) performed during running is a commonly examined variable for researchers investigating running injury, (Cheung & Davis, Citation2011; Daoud et al., Citation2012; Giandolini et al., Citation2013), mechanical efficiency and compliance, (Hamill et al., Citation2014; Holowka et al., Citation2021; Kelly et al., Citation2018; Lieberman et al., Citation2010), and performance, (Hasegawa et al., Citation2007; Kasmer et al., Citation2013; Larson et al., Citation2011). Unique kinetic and kinematic differences exist between strike types (Bruening et al., Citation2018; Lieberman et al., Citation2010; Perl et al., Citation2012). Therefore, foot strike is often discretely classified as rearfoot (RF; when the heel of the foot lands first), midfoot (MF; when the heel and anterior section of the foot strike simultaneously), or forefoot (FF; where the anterior portion of the foot lands first) (Lieberman et al., Citation2010). However, small changes in the foot strike angle (FSA) can occur on a continuous level (rather than discrete FSPs). For example, FSA can be affected by exertion (Futrell et al., Citation2021), running frequency (Holowka et al., Citation2021), or throughout the initial impact phase (Lieberman et al., Citation2010), without a categorical change of FSP.
A kinematic system, or validation against a gold-standard kinematic system (for examples see Esculier et al., Citation2018, Mann et al., Citation2014, and Moore, Kranzinger et al., Citation2020), is required for accurate FSA detection. In fact, often in both two-dimensional (2D) and three-dimensional (3D) kinematic analysis of FSP, FSA is first determined and then classified into patterns using the recommendations of Altman and Davis (Altman & Davis, Citation2012) or Lieberman and colleagues (Lieberman et al., Citation2010). Thus, there is high importance for an accurate yet simple measurement of FSA. Current kinematic methods for measuring FSA generally include 2D video-analysis or 3D optoelectronic motion capture.
The use of 2D video-analysis is prevalent due to its simplicity in measurement and cost. Many studies report FSA as either the 2D angle of the plantar surface of the foot (de Almeida et al., Citation2015; Daoud et al., Citation2012; Dingenen et al., Citation2020; Murray et al., Citation2019) or between markers/known points (Giandolini et al., Citation2014; Lieberman et al., Citation2015, Citation2010) in relation to the ground (see for examples of marker placements). Alternatively, 2D video has been prominently used for visual classification of FSP (Esculier et al., Citation2018; Hasegawa et al., Citation2007; Kasmer et al., Citation2013; Larson et al., Citation2011; Lieberman et al., Citation2010; Meyer et al., Citation2018). Due to the necessity to determine IC, both FSA and FSP estimates using 2D video require a manual frame-by-frame analysis, which can be a time-consuming post-processing with high subjectivity (de Almeida et al., Citation2015; Daoud et al., Citation2012; Esculier et al., Citation2018; Hasegawa et al., Citation2007; Kasmer et al., Citation2013; Larson et al., Citation2011; Murray et al., Citation2019).
Table 1. Current 2D and 3D two-marker methods for estimating foot strike angle are defined and cited below.
Due to the necessity to stay in a perpendicular relationship with the capture device, 2D FSA estimates can be distorted from the direction of running (i.e., slightly off perpendicular) or an out-of-plane foot placement. This can be attenuated by accounting for the 3D motion of a segment or markers. Typical FSA analyses have used 3D motion capture and anatomical marker sets that define the foot segment (Futrell et al., Citation2021; Hamill et al., Citation2014; Meyer et al., Citation2018; Moore, Fritz et al., Citation2020; Moore, Kranzinger et al., Citation2020). However, FSA has also been determined by creating a 3D vector between two known anatomical points (requiring as few as two markers; see for example marker placements). The use of fewer markers could be beneficial to simplify future wearable sensor validations and FSA/FSP analyses because it reduces the need for static-specific marker placements (i.e., medial markers to define joint centres), requires less manual processing, and can be implemented semi-automatically using coding software.
Although many methods have thus far been used to detect 3D FSA during running, little information is available about the comparative accuracy of such methods. The current study sought to determine the validity of two simple FSA methodologies (both employing only two markers): 1) the HEEL and MET5 and 2) the HEEL and TOE (see for definitions). Both two-marker methods were compared to a reference method (i.e., an anatomically defined foot-segment model). Thus, the first purpose of the current study was to compare the FSA measured by the reference method to both two-marker methodologies in a scalar, discrete manner at the event of initial contact. The second purpose was to compare the foot segment angle on a continuous level across the entire stance phase. Multiple FSPs were investigated to determine the influence of FSP on both purposes. The authors hypothesised there would be no difference in the interchangeability of the simple methods compared to the reference.
Materials and methods
Participants and experimental approach
Twelve recreational runners were recruited for one testing session (see for participant characteristics). Participants were asked to run five 400 m running trials that consisted of four 100 m laps at a self-regulated pace that they identified as an easy to moderate steady-state running effort. In each lap, a capture volume of 15 m (straight running) allowed the collection of up to 14 steps (seven each side). Multiple FSPs were investigated to account for a greater spectrum of biomechanical stimuli; these included RF, MF, and FF strike types. Due to the apparent difficulty for non-MF striking recreational runners to perform MF strike patterns (Cheung & Davis, Citation2011; Moore, Fritz et al., Citation2020; Moore, Kranzinger et al., Citation2020), two MF trials were performed to ensure approximately 20 steps could be analysed per strike type for each participant. Thus, participants first performed a natural running trial (NA), followed by randomised trials of RF, MF1, MF2, and FF. All participants provided written informed consent approved by the institutional review board before participation.
Table 2. Participant characteristics are presented as mean ± standard deviation.
Measurements
Accounting for data loss, a total of 1,187 foot strikes were measured with kinematics and pressure insoles (used for event detection) within the capture volume. 3D marker trajectories of the feet were collected at 200 Hz using a 10-camera Qualysis motion capture system (2020.2, Göteborg, Sweden). Six retroreflective markers were secured to each foot (over the shoe where necessary; ; Hamill et al., Citation2004). The markers were placed anatomically on the medial and lateral malleoli (ANKMED and ANKLAT, respectively), the head of the 2nd metatarsal (TOE), the heel (HEEL; placed at the same height as the 2nd metatarsal), the medial side of the head of 1st metatarsal (MET1), and the lateral side of the head of 5th metatarsal (MET5). Insole pressure was recorded using two-part LoadsolTM pressure insoles (separated into anterior and posterior sections) that were inserted into the participants’ personal shoes over the midsole (see for the average shoe drop) and recorded at their maximum sampling rate (100 Hz). Running velocity (m · s−1) was determined by two timing gates (Brower Timing Systems, Utah, USA) that were placed 10 m apart on the straight phase within the capture volume ().
Figure 1. The marker placements on the left foot can be seen from a lateral (a) and medial (b) views.
Data processing and synchronization
The 3D marker trajectories were filtered using a 15 Hz low-pass Butterworth filter (>99% signal power retention) in Visual 3D (v6.03.06; Germantown, MD, USA). The foot segment was then modelled using the segment origin (i.e., proximal joint centre) as the midpoint between the ANKLAT and ANKMED, and the distal joint centre as the midpoint between MET1 and MET5 (Hamill et al., Citation2004). A virtual foot segment was created according to Visual 3D Wiki Documentation, which negated the shoe-elicited angulation by projecting virtual landmarks from the foot relative to the floor-level of the “origin” landmarks and enabled the assessment of the foot angle against the ground (C-Motion, Inc, Citation2017). A typical Cardan angle rotation sequence was adopted (primary = sagittal, secondary = frontal, tertiary = transverse). The angle of the virtual foot model, and the 3D coordinates (X, Y, and Z) of the HEEL, TOE, and MET5 markers were exported to MATLAB (R2020a; The MathWorks, Inc., Natick, MA, USA) and further processed using a custom code.
To synchronise the kinematic and insole data, a stomp event was performed at the start and end of every running trial. Initial contact (IC) of a step was identified from pressure insoles as the first frame when the loading rate exceeded 1500 N ∙ s−1 (Seiberl et al., Citation2018), and toe off (TO) was similarly defined as the first frame in which the loading rate was greater than −1500 N ∙ s−1 (Seiberl et al., Citation2018). These IC and TO events were subsequently used to compare the angles calculated from three FSA methods on an event-wise basis (at IC) and continuously throughout the ground contact time (GCT; IC-TO). Importantly, all steps included in the analysis were pre-categorised into FSPs (regardless of the trial in which they were performed) using the pressure insoles and the FSP definitions of Lieberman and colleagues (Lieberman et al., Citation2010). As a result, a step was categorised as FF when the IC was detected from the anterior-aspect of the insole, MF when the IC was detected from both the anterior- and posterior-aspect of the insole, and RF when the IC was detected from the posterior-aspect of the insole.
FSA calculation methods
The segment angle of the virtual foot was considered the “reference” method for foot segment angle calculation (henceforth referred to as V3D-REF). Two additional methods to calculate the foot angle were computed using only two marker trajectories each: one computed the angle between the HEEL and TOE markers (HEEL-TOE) and the other the angle between the HEEL and MET5 markers (HEEL-MET5). The computation of these angles was accomplished using the 3D Pythagorean Theorem (). For all methods, a negative FSA occurred when the proximal marker/joint centre was superior to the distal marker/joint centre at IC (typical of a FF strike).
Figure 2. The calculation of the angle of the vector that spans from Marker 1 to Marker 2 is defined in geometric context. X, Y, Z = 3D spatial coordinates of Markers 1 & 2. Marker 1 = proximal marker (i.e., HEEL); Marker 2 = distal marker (i.e., TOE or MET5); θ = foot strike angle.
All methods (V3D-REF, HEEL-TOE, HEEL-MET5) were calculated for all steps captured. To negate any marker placement offset of the HEEL-TOE and HEEL-MET5, the two-marker vector angle was calculated from the static pose and subtracted from all subsequent segment angles. The virtual foot of the V3D-REF already accounted for the static pose (see above). The foot segment angles of each method were then extracted at the frame of IC, and the continuous segment angles were extracted between the IC and TO events. For subsequent statistical comparisons, the stance phase was normalised to 100% (average stance time FF = 0.25 ±0.03 s, MF = 0.24 ±0.03 s, RF = 0.27 ±0.04 s). Steps were only included if the marker visibility allowed simultaneous calculation of all three methods. All steps included were treated in a record-wise manner for subsequent statistics.
Statistical analysis – purpose I: Event-based
All variables met the assumptions of normality, which were evaluated using the z-score of the skewness and kurtosis statistics (Field, Citation2013). Therefore, to assess the agreement (mean difference, correlation, and proportional bias) between the two-marker methods (HEEL-TOE and HEEL-MET5) and the V3D-REF in measuring the FSA, three statistical approaches were employed.
To determine the mean differences between the three FSA calculated and the FSP, a two-way, related samples mixed measures ANOVA was performed (α = 0.05) using IBM SPSS Statistics software (SPSS Inc.; Version 26.0, Chicago, IL, USA). The related samples assessed were the three calculation methods for FSA, while between-sample measures were the three FSPs employed by participants (RF, MF, and FF). The authors thus expected a significant between-sample effect; however, the interaction between the methods and FSP was of particular interest to ascertain whether any differences between the angles measured at IC were influenced by FSP. Mauchly's assumption of sphericity was violated (p < 0.001), therefore a Greenhouse–Geisser correction factor was applied. The effect size (partial eta squared; ηp2) was calculated using SPSS and interpreted as small (0.01), medium (0.06), or large effects (0.14) (Cohen, Citation1988). Where significant effects were detected (p < 0.05), post-hoc pairwise-comparisons were used to determine where significant differences existed. The family-wise type 1 error rate was controlled using One-step Šidák P-corrections and verified using the Step-down Holm-Šidák procedure (thus including the interaction effect) (Ludbrook, Citation1998).
To assess the correlation of the calculated FSA between the reference method (V3D-REF) and the two-marker methods (HEEL-MET5 and HEEL-TOE), Pearson’s Product Moment correlations were performed (α = 0.05). Proportional bias was assessed using least-squares linear regression analysis (Hopkins, Citation2004). The analysis was carried out using Hopkins’ custom spreadsheet for the analysis of validity (Hopkins, Citation2015). The V3D-REF data were input as the criterion measure, while HEEL-MET5 and HEEL-TOE were used as the estimates. The regression intercept, slope, and overall bias (in degrees) were reported from Hopkins’ spreadsheet with 95% confidence intervals (CI). Furthermore, the minimal important difference at IC (at “small” effect size; Cohen’s d = 0.20; Cohen, Citation1988, Sedaghat, Citation2019) and typical error of the estimate (TEE) were reported in degrees.
Statistical analysis – purpose II: Continuous assessment
The assessment of the three methods on the continuous level was performed using the open-source One-Dimensional Statistical Parametric Mapping (SPM) in MATLAB (spm1d package; Pataky, Citation2019). Specifically, the SPM analyses were run using two-tailed paired samples t-tests comparing the V3D-REF method to both HEEL-MET5 and HEEL-TOE methods throughout GCT. Therefore, the t-statistic (SPM{t}) was calculated on a continuous level. To test the null hypothesis (no difference between the methods), a critical threshold (t*) was calculated for each comparison (Friston et al., Citation1994). Thus, for SPM{t} values where the upper or lower t* thresholds were exceeded, the null hypothesis was rejected. Because of the continuous nature of SPM analyses, clusters of consecutive points will often exceed the thresholds. Therefore, the SPM software calculates cluster-specific probability statistics (i.e., p-values) using Random Field Theory assumptions. For the current study, the critical alpha level was adjusted using the Šidák corrections to reflect the comparisons (V3D-REF vs. HEEL-MET5 and V3D-REF vs. HEEL-TOE) and retain the family-wise Type-1 error rate (therefore, α = 0.025). SPM analyses were made for each of the three pre-classified FSPs separately. The authors deemed FSP classifications as different “families” therefore no additional alpha corrections were made. Finally, the absolute value of the residuals was calculated for the regions with significant differences (i.e., each cluster) and reported as an average ± SD.
Results
Purpose I: Event-based
The mean FSA and standard deviation of each strike type (i.e., FF, MF, RF) are presented in for the three methods investigated. The minimum important difference of the FSA was 2.0°. The results of the two-way repeated samples ANOVA indicated that there was a significant main effect in the measurement method used (F(1.26,1492.65) = 2197.45; p < 0.001; ηp2 = 0.650). Post-hoc comparisons revealed that significant differences existed between all methods (p < 0.001; ). A significant between-samples effect (F(2,1184) = 709.53; p < 0.001; ηp2 = 0.545) and post-hoc comparisons confirmed that differences existed between the three foot strike styles (p < 0.001).
Table 3. The mean and standard deviation of the foot strike angle determined from three kinematic methods are presented below. V3D-REF = reference method using a visual 3D virtual foot; HEEL-MET5 = two markers (placed on the heel and laterally on the 5th metatarsal); HEEL-TOE = two markers (placed on the heel and superiorly on the 2nd metatarsal).
Table 4. The mean differences, correlation coefficients, and least squares regression statistics are presented comparing both two-marker methods (HEEL-MET5 and HEEL-TOE) for determining foot strike angle against a reference method (V3D-REF).
A significant interaction was found between method and FSP (F(2.52,1492.65) = 2197.45; p < 0.001; ηp2 = 0.044). Within-case contrasts revealed that the change in mean (between the three FSPs) was different between all three methods. Specifically, smaller changes in mean are seen in the HEEL-MET5 than HEEL-TOE or V3D-REF (between FF to MF and MF to RF means) and a larger difference in mean is seen with the HEEL-TOE from FF to MF than the V3D-REF (see, for means).
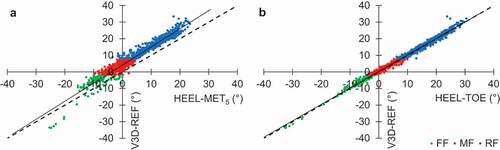
The least squares regression lines are presented in against the line of equivalence. The regression analyses resulted in a greater slope (i.e., constant) and intercept when the HEEL-MET5 method was compared versus the HEEL-TOE method (respectively, constant = 1.091 and 0.994, intercept = 4.146 and 0.276; ). Thus, the regression line showed greater divergence from the line of equivalence when the HEEL-MET5 method was used compared to the HEEL-TOE method ().
Figure 3. The regression line (solid) and line of equivalence (dashed) are presented above for both method comparisons: A = V3D-REF vs. HEEL-MET5, B = V3D-REF vs. HEEL-TOE. The foot strike pattern distribution is colour coded: FF = forefoot (green), MF = midfoot (red), RF = rearfoot (blue) .
Purpose II: Continuous
All SPM comparisons, critical thresholds, and cluster p-values can be seen in . The SPM comparison of the V3D-REF and HEEL-MET5 methods resulted in distinct clusters exceeding the critical threshold in the early stance phase for all FSPs (FF cluster = IC–23%, average residual = 1.9 ± 1.9°; MF cluster = IC–29%, average residual = 1.9 ±1.6°; RF cluster = IC–34%, average residual = 1.5 ±1.5°). In all three clusters, the angle measured with the HEEL-MET5 method was significantly lower than the V3D-REF angle. The FF comparison had an additional cluster region from 34% to 62% of GCT (average residual = 1.5 ±1.3°).
Figure 4. The mean ± SD of the measured foot angle are plotted against the ground contact phase (%) in the first and third rows of graphs (V3D-REF = grey scale; HEEL-MET5 and HEEL-TOE are presented in colour). Positive angles are indicative of dorsiflexion while negative angles of plantarflexion. Each colour corresponds to a foot strike pattern (FF = forefoot (green), MF = midfoot (red), and RF = rearfoot (blue)). Each foot angle graph has a corresponding Statistical Parametric Mapping (SPM) analysis located in the row below it. The critical thresholds (t*) of the SPM analyses are plotted in dashed lines and reported numerically. Shaded areas above the upper t* and below the lower t* are clusters where significant differences exist between the angles measured by the two methodologies (α = 0.025). SPM{t} = t-score continuum across stance phase.
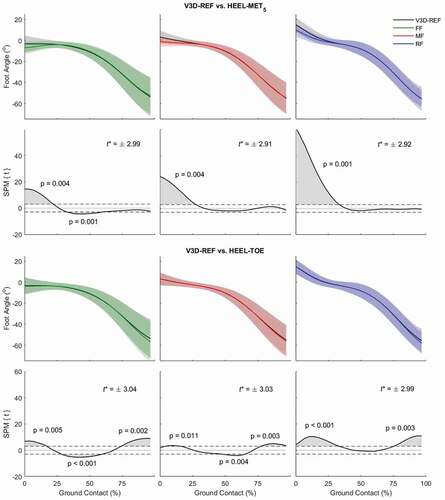
The V3D-REF and HEEL-TOE comparison of the FF strike pattern revealed three clusters (GCT range, average residual ± SD; IC–18%, 0.8 ±0.6°; 30–61%, 0.5 ±0.7°; 77%–TO, 1.7 ±1.6°). Similarly, three clusters were found for the same comparison in the MF (GCT range, average residual ± SD; 4–16%, 0.7 ±0.6°; 50–67%, 0.6 ±0.6°; 80%–TO, 2.0 ±2.2°). Finally, the RF comparisons resulted in two clusters at the beginning and end of the stance phase (GCT range, average residual ± SD; IC–35%, 0.6 ±0.7°; 78%–TO%, 1.4 ±2.8°).
Discussion
The current study sought to compare the validity of two simple two-marker methods for the determination of FSA and foot angle over the GCT. In general, the HEEL-TOE method performed more similarly to the V3D-REF than the HEEL-MET5 method on both a discrete (FSA) and continuous (foot angle throughout GCT) level. A significant main effect was found with a large effect size that revealed significant differences existed between both two-marker methods and the reference (V3D-REF). The V3D-REF and HEEL-MET5 had a significant mean difference of 4.3°, whereas the mean difference between the V3D-REF and HEEL-TOE was minimal (0.3°; ). Although the V3D-REF and HEEL-TOE FSA comparison was significant, the mean difference fell below the range of minimal detectable difference for FSA (2.0°) and therefore may not be an important difference. Furthermore, the slope, intercept, TEE, and bias of the least squares regression revealed a greater divergence from the equivalence between the V3D-REF and HEEL-MET5 than when the HEEL-TOE was compared (, ). Similarly, the V3D-REF vs. HEEL-TOE bias and TEE did not exceed the minimum detectable difference – therefore indicating very high agreement between the two methods. Finally, throughout the GCT for all FSPs, the V3D-REF and HEEL-MET5 comparisons resulted in significant differences from IC–34% of stance (). Significant clusters were also found for the V3D-REF and HEEL-TOE comparisons; however, the average residuals were minimal (<1.0°) for all except those at the end of the stance phase (i.e., approximately 78%–TO).
The authors hypothesise that a source of the different agreement of HEEL-MET5 and HEEL-TOE in the early contact phase is due to inversion of the foot at IC. Up to 8.5 ±4.1° inversion during a FF strike has been measured (Williams et al., Citation2000), while RF strike inversion at IC has been measured up to 6° (seen in a segment defined as forefoot; Peebles et al., Citation2021). Lieberman and colleagues (Citation2010) also noted that foot inversion occurred at impact and thus did additional manual evaluation of the FSP rather than rely solely on their 2D FSA analysis between HEEL and MET5 markers. In the current study, the HEEL-MET5 method underestimated the FSA compared to V3D-REF (), which conceptually aligns with the influence of foot inversion. Similar 2D underestimates in ankle dorsiflexion angles have been seen when only the sagittal plane motion was accounted for (Peebles et al., Citation2021). Alternatively, the results of the current study suggest that the HEEL-TOE method could be less prone to errors from inversion movements, likely because the TOE marker was placed closer to the subtalar joint axis (where inversion/eversion movements primarily occur; McClay & Manal, Citation1999). The movement in this secondary axis could be measured and offset for the HEEL-MET5 method; however, it would require a larger marker set (thus negating any advantage gained from not employing a full marker set), and more attention due to its higher level of variability (McClay & Manal, Citation1999). As a result, both 2D and 3D models that do not minimise the effect of the inversion/eversion motion occurring in the frontal plane may be inviting substantial and quantifiable error into their FSA estimates. Importantly, these would include those that quantify FSA using markers on the lateral foot () and even those that quantify FSA from the 2D angle between the foot sole and the ground as visual distortion due to the inversion/eversion can occur.
Ultimately, the application of a simple, yet accurate two-marker method for quantifying FSA can be beneficial for simplifying future research regarding FSA and FSP. Further, marker-based algorithms for IC and TO have been developed that require few markers (Fellin et al., Citation2010; Maiwald et al., Citation2009), which can be dually considered when selecting minimal marker-sets suitable for both segment angles and event detection. Ultimately, fewer markers require less tracking and processing work and allow for simple foot-segment angle calculation in coding software like MATLAB. This potential makes the validation of wearable sensors more feasible. However, when applied as a gold-standard reference, the current study suggests that the placement of markers is an important variable to control. Likely, similar placement considerations need to be addressed when applying wearable sensors such as inertial measurement units on a lateral part of the foot (e.g., Giandolini et al., Citation2014). Future validations of such sensors should account for the offset that may occur from lateral marker/sensor placements or else employ prediction algorithms that account for gyroscopic movement.
The current study supports the idea that simple trigonometry can be used between the HEEL and TOE markers to accurately estimate FSA. While the primary focus of the current paper was to validate a simplified method of FSA determination, it is important to note that there were increased residuals in the last 20% of stance phase (approximately) of the estimated foot segment angle (). The additional source of error during TO motions may occur due to the movement at the metatarsophalangeal joint; because the markers were placed on the shoe, there might be marginal shoe fabric bending that affects the measurement. Thus, if foot angle at TO is important for future researchers, using a more exhaustive marker set may contribute to accuracy. Minimal marker sets can thus be beneficial for simplicity and efficiency but limited by nature in the diversity of accurate outcomes obtainable. They are particularly limited when considering movement in additional planes and pathological movement patterns (Simon et al., Citation2006), in which methods discussed in this paper would likely not be appropriate. Furthermore, the minimal marker-sets discussed in the current study treat the foot segment as a single rigid segment, and do not encompass the diverse information that could be collected when considering a 2- or 3-segment foot model (e.g., Bruening et al., Citation2012, Citation2018; Kelly et al., Citation2018; Pohl et al., Citation2008). Future considerations could be made to develop a multi-segment definition of FSA; however, the information presented can improve the current practice for simple FSA measurement and FSP classifications when the HEEL-TOE method is employed.
Conclusions
This study demonstrates that marker methods employing the HEEL and TOE markers can accurately estimate FSA. Although significant differences exist between the HEEL-TOE and reference method, they are smaller than the minimum important difference. Therefore, this two-marker method can be used to simplify data collections and future validations of wearable sensors. Two-marker methods employing the HEEL-MET5 markers appear to significantly underestimate the foot angle at IC and in the early stance phase potentially due to inversion movements of the foot. Therefore, researchers should be aware that FSAs defined by lateral marker placements could need to account for inversion/rotational movement to be comparable to those marker sets and foot segments that are defined by the central axis of the foot.
Disclosure statement
No potential conflict of interest was reported by the author(s).
Additional information
Funding
References
- Altman, A. R., & Davis, I. S. (2012, February). A kinematic method for footstrike pattern detection in barefoot and shod runners. Gait & Posture, 35(2), 298–300. https://doi.org/10.1016/j.gaitpost.2011.09.104
- Bruening, D. A., Cooney, K. M., & Buczek, F. L. (2012, April). Analysis of a kinetic multi-segment foot model. Part I: Model repeatability and kinematic validity. Gait & Posture, 35(4), 529–534. https://doi.org/10.1016/j.gaitpost.2011.10.363
- Bruening, D. A., Pohl, M. B., Takahashi, K. Z., & Barrios, J. A. (2018, May 17). Midtarsal locking, the windlass mechanism, and running strike pattern: A kinematic and kinetic assessment. Journal of Biomechanics, 73, 185–191. https://doi.org/10.1016/j.jbiomech.2018.04.010
- Cheung, R. T. H., & Davis, I. S. (2011, December). Landing pattern modification to improve patellofemoral pain in runners: A case series. Journal of Orthopaedic & Sports Physical Therapy, 41(12), 914–919. https://doi.org/10.2519/jospt.2011.3771
- C-Motion, Inc. (2017). Visual3D Wiki documentation [Internet]. Retrieved January 24, 2020, from https://c-motion.com/v3dwiki/index.php?title=Main_Page
- Cohen, J. (1988). Statistical power analysis for the behavioral sciences (2nd ed.) Lawrence Erlbaum Associates. ISBN 0-8058-0283-5 .
- Daoud, A. I., Geissler, G. J., Wang, F., Saretsky, J., Daoud, Y. A., & Lieberman, D. E. (2012, July). Foot strike and injury rates in endurance runners: A retrospective study. Medicine & Science in Sports & Exercise, 44(7), 1325–1334. https://doi.org/10.1249/MSS.0b013e3182465115
- de Almeida, M., Saragiotto, B. T., Yamato, T. P., & Lopes, A. D. (2015, February). Is the rearfoot pattern the most frequently foot strike pattern among recreational shod distance runners? Physical Therapy in Sport, 16(1), 29–33. https://doi.org/10.1016/j.ptsp.2014.02.005
- Dingenen, B., Staes, F., Vanelderen, R., Ceyssens, L., Malliaras, P., Barton, C. J., Deschamps, K. (2020, July 1). Subclassification of recreational runners with a running-related injury based on running kinematics evaluated with marker-based two-dimensional video analysis. Physical Therapy in Sport. 44, 99–106. https://doi.org/10.1016/j.ptsp.2020.04.032
- Esculier, J.-F., Silvini, T., Bouyer, L. J., & Roy, J.-S. (2018, January 1). Video-based assessment of foot strike pattern and step rate is valid and reliable in runners with patellofemoral pain. Physical Therapy in Sport, 29, 108–112. https://doi.org/10.1016/j.ptsp.2016.11.003
- Fellin, R. E., Rose, W. C., Royer, T. D., & Davis, I. S. (2010, November). Comparison of methods for kinematic identification of footstrike and toe-off during overground and treadmill running. Journal of Science and Medicine in Sport, 13(6), 646–650. https://doi.org/10.1016/j.jsams.2010.03.006
- Field, A. (2013). Discovering statistics using IBM SPSS statistics (5th ed.). SAGE.
- Friston, K. J., Holmes, A. P., Worsley, K. J., Poline, J.-P., Frith, C. D., & Frackowiak, R. S. J. (1994). Statistical parametric maps in functional imaging: A general linear approach. Human Brain Mapping, 2(4), 189–210. https://doi.org/10.1002/hbm.460020402
- Futrell, E. E., Gross, K. D., Mullineaux, D. R., & Davis, I. S. (2021, June). Exerted running results in altered impact mechanics and footstrike patterns following gait retraining. Journal of Sports Sciences, 39(11), 1302–1311. https://doi.org/10.1080/02640414.2020.1868089
- Giandolini, M., Arnal, P. J., Millet, G. Y., Peyrot, N., Samozino, P., Dubois, B., & Morin, J.-B. (2013, March). Impact reduction during running: Efficiency of simple acute interventions in recreational runners. European Journal of Applied Physiology, 113(3), 599–609. https://doi.org/10.1007/s00421-012-2465-y
- Giandolini, M., Poupard, T., Gimenez, P., Horvais, N., Millet, G. Y., Morin, J.-B., & Samozino, P. (2014, May). A simple field method to identify foot strike pattern during running. Journal of Biomechanics, 47(7), 1588–1593. https://doi.org/10.1016/j.jbiomech.2014.03.002
- Hamill, J., Selbie, W. S., & Kepple, T. (2004). Chapter 2: Three dimensional kinematics. In G. Robertson, G. Caldwell, J. Hamill, & S. Whittlesey (Eds.), Research methods in biomechanics (2nd ed., pp. 35–59). Human Kinetics.
- Hamill, J., Gruber, A. H., & Derrick, T. R. (2014, February). Lower extremity joint stiffness characteristics during running with different footfall patterns. European Journal of Sport Science, 14(2), 130–136. https://doi.org/10.1080/17461391.2012.728249
- Hasegawa, H., Yamauchi, T., & Kraemer, W. J. (2007, August). Foot strike patterns of runners at the 15-km point during an elite-level half marathon. Journal of Strength and Conditioning Research, 21(3), 888–893. https://doi.org/10.1519/R-22096.1
- Holowka, N. B., Richards, A., Sibson, B. E., & Lieberman, D. E. (2021, January 6). The human foot functions like a spring of adjustable stiffness during running. Journal of Experimental Biology, 224 (1), 219667. https://doi.org/10.1242/jeb.219667
- Hopkins, W. G. (2004). Bias in Bland-Altman but not regression validity analyses. Sportscience, 8, 42–46. sportsci.org/jour/04/wghbias.htm
- Hopkins, W. G. (2015). Spreadsheets for analysis of validity and reliability. Sportscience, 19, 36–42. sportsci.org/2015/ValidRely.htm
- Kasmer, M. E., Liu, X., Roberts, K. G., & Valadao, J. M. (2013, May). Foot-strike pattern and performance in a marathon. International Journal of Sports Physiology and Performance, 8(3), 286–292. https://doi.org/10.1123/ijspp.8.3.286
- Kelly, L. A., Farris, D. J., Lichtwark, G. A., & Cresswell, A. G. (2018, January). The influence of foot-strike technique on the neuromechanical function of the foot. Medicine & Science in Sports & Exercise, 50(1), 98–108. https://doi.org/10.1249/MSS.0000000000001420
- Larson, P., Higgins, E., Kaminski, J., Decker, T., Preble, J., Lyons, D., McIntyre, K., & Normile, A. (2011, December). Foot strike patterns of recreational and sub-elite runners in a long-distance road race. Journal of Sports Sciences, 29(15), 1665–1673. https://doi.org/10.1080/02640414.2011.610347
- Lieberman, D. E., Venkadesan, M., Werbel, W. A., Daoud, A. I., D’Andrea, S., Davis, I. S., Mang’Eni, R. O., & Pitsiladis, Y. (2010, January). Foot strike patterns and collision forces in habitually barefoot versus shod runners. Nature, 463(7280), 531–535. https://doi.org/10.1038/nature08723
- Lieberman, D. E., Castillo, E. R., Otarola-Castillo, E., Sang, M. K., Sigei, T. K., Ojiambo, R., Okutoyi, P., & Pitsiladis, Y. (2015, July 8). Variation in foot strike patterns among habitually barefoot and shod runners in Kenya. PLOS ONE Internet]. Retrieved September 8, 2021, from 10 (7), e0131354. https://journals.plos.org/plosone/article?id=10.1371/journal.pone.0131354
- Ludbrook, J. (1998). Multiple comparison procedures updated. Clinical and Experimental Pharmacology and Physiology, 25(12), 1032–1037. https://doi.org/10.1111/j.1440-1681.1998.tb02179.x
- Maiwald, C., Sterzing, T., Mayer, T. A., & Milani, T. L. (2009, June). Detecting foot-to-ground contact from kinematic data in running. Footwear Science, 1(2), 111–118. https://doi.org/10.1080/19424280903133938
- Mann, R., Malisoux, L., Brunner, R., Gette, P., Urhausen, A., Statham, A., Meijer, K., & Theisen, D. (2014, January). Reliability and validity of pressure and temporal parameters recorded using a pressure-sensitive insole during running. Gait & Posture, 39(1), 455–459. https://doi.org/10.1016/j.gaitpost.2013.08.026
- McClay, I., & Manal, K. (1999, November). Three-dimensional kinetic analysis of running: Significance of secondary planes of motion. Medicine & Science in Sports & Exercise, 31(11), 1629. https://doi.org/10.1097/00005768-199911000-00021
- Meyer, F., Falbriard, M., Aminian, K., & Millet, G. P. (2018, February 1). How accurate is visual determination of foot strike pattern and pronation assessment. Gait & Posture, 60, 200–202. https://doi.org/10.1016/j.gaitpost.2017.12.012
- Moore, S. R., Fritz, J., Kröll, J., Stöggl, T., & Schwameder, H. (2020, July 18). Consistency and validity of acute foot-strike pattern alterations during laboratory-based running. ISBS Proceedings Archive, 38(1), 848. https://commons.nmu.edu/isbs/vol38/iss1/214
- Moore, S. R., Kranzinger, C., Fritz, J., Stöggl, T., Kröll, J., & Schwameder, H. (2020, November). Foot strike angle prediction and pattern classification using LoadsolTM wearable sensors: A comparison of machine learning techniques. Sensors, 20(23), 6737. https://doi.org/10.3390/s20236737
- Murray, L., Beaven, C. M., & Hébert-Losier, K. (2019, January). Reliability of overground running measures from 2D video analyses in a field environment. Sports, 7(1), 8. https://doi.org/10.3390/sports7010008
- Nunns, M., House, C., Fallowfield, J., Allsopp, A., & Dixon, S. (2013, October). Biomechanical characteristics of barefoot footstrike modalities. Journal of Biomechanics, 46(15), 2603–2610. https://doi.org/10.1016/j.jbiomech.2013.08.009
- Pataky, T. C. (2019). spm1d [Internet]. https://spm1d.org/index.html
- Peebles, A. T., Carroll, M. M., Socha, J. J., Schmitt, D., & Queen, R. M. (2021, January). Validity of using automated two-dimensional video analysis to measure continuous sagittal plane running kinematics. Annals of Biomedical Engineering, 49(1), 455–468. https://doi.org/10.1007/s10439-020-02569-y
- Perl, D. P., Daoud, A. I., & Lieberman, D. E. (2012, July). Effects of footwear and strike type on running economy. Medicine & Science in Sports & Exercise, 44(7), 1335–1343. https://doi.org/10.1249/MSS.0b013e318247989e
- Pohl, M. B., & Buckley, J. G. (2008, March). Changes in foot and shank coupling due to alterations in foot strike pattern during running. Clinical Biomechanics, 23(3), 334–341. https://doi.org/10.1016/j.clinbiomech.2007.09.016
- Sedaghat, A. R. (2019, October). Understanding the Minimal Clinically Important Difference (MCID) of patient-reported outcome measures. Archives of Otolaryngology--head and Neck Surgery, 161(4), 551–560. https://doi.org/10.1177/0194599819852604
- Seiberl, W., Jensen, E., Merker, J., Leitel, M., & Schwirtz, A. (2018, September). Accuracy and precision of loadsol® insole force-sensors for the quantification of ground reaction force-based biomechanical running parameters. European Journal of Sport Science, 18(8), 1100–1109. https://doi.org/10.1080/17461391.2018.1477993
- Simon, J., Doederlein, L., McIntosh, A. S., Metaxiotis, D., Bock, H. G., & Wolf, S. I. (2006, June). The Heidelberg foot measurement method: Development, description and assessment. Gait & Posture, 23(4), 411–424. https://doi.org/10.1016/j.gaitpost.2005.07.003
- Williams, I. I. I. D. S., McClay, I. S., & Manal, K. T. (2000, May). Lower extremity mechanics in runners with a converted forefoot strike pattern. Journal of Applied Biomechanics, 16(2), 210. https://doi.org/10.1123/jab.16.2.210