
 ?Mathematical formulae have been encoded as MathML and are displayed in this HTML version using MathJax in order to improve their display. Uncheck the box to turn MathJax off. This feature requires Javascript. Click on a formula to zoom.
ABSTRACT
Interaction between the shooting hand and ball at the moment a basketball is released generates a three-dimensional backspin of the ball. This study is the first to investigate how characteristics of the backspin alignment and variability contribute to lateral shooting accuracy. Spin axis (SA) direction and backspin magnitude were measured on 25 shot attempts for 26 collegiate basketball players (male: n = 16, female: n = 10). The mean SA alignment, as viewed from the shooting hand side, was found to be tipped down and towards the target (p < 0.001). Standard deviations (SD) in the SA alignment were strong predictors of lateral accuracy (vertical SD: r = 0.80, p < 0.001, forward-backward SD: r = 0.51, p = 0.01), with variation in the vertical alignment being the best predictor. No significant correlation between mean SA misalignment and lateral accuracy was observed. However, intra-individual relationships between SA misalignment and lateral error revealed that individuals tended to have 0.17 degrees more misalignment for each cm of lateral error (p < 0.001, 95% CI: 0.24–0.09). These indicate that while an individual’s mean alignment may not predict lateral accuracy, improving one’s SA alignment and reducing alignment variability may increase lateral accuracy.
Introduction
It has been observed that the most important factor in determining basketball shooting accuracy is the ability to regulate final release velocity, with directional error and release angle remaining important but secondary factors (Slegers et al., Citation2021; Tran & Silverberg, Citation2008). However, no clear understanding of the importance of applying ball rotation while shooting and its relationship to accuracy has emerged (Okazaki et al., Citation2015). While some encourage consistent movement patterns (Wissel, Citation2004) and postural control (Verhoeven & Newell, Citation2016) as a means to reduce release variability in basketball, it has long been recognized that there are endless combinations of contributions that result in successful shots (Hudson, Citation1985). As a result, there is little consensus on which kinematic variables, if any, are strongly connected to better shooting performance (Ammar et al., Citation2016; Coves et al., Citation2020; Okazaki & Rodacki, Citation2012).
Studies into movement variability have found that performance in shooting (Bartlett et al., Citation2007) and interception tasks (Bootsma et al., Citation1991) are driven less by repeating the desired motion or regulating specific joint angles and more by dynamically compensating for earlier motion to achieve a final desired goal. Increases in kinematic variability along the proximal-distal chain near the time of release have been found in better shooters as a means to reduce release variability and achieve better performance (Button et al., Citation2003; Mullineaux & Uhl, Citation2010; Robins et al., Citation2006). These variations near the time of release have significant impacts on the outcome; however, investigations into the final moments of a shot release when the wrist, hand and fingers impart ball backspin and its relationship to shooting performance and directional error have been absent.
Backspin of the ball generated during the final release is a natural result of the traditional overhand shooting technique which results in the fingers rolling off the ball during the hand’s follow-through. Similar to how regulation of final release velocity and angle is a strong predictor of shooting performance, the nature of ball backspin including the magnitude, spin axis (SA) direction and their variability may provide useful insights into shooting performance. The follow-through and its nuances are recognized by coaches as a useful tool for providing feedback regarding shooting kinematics (Hopla, Citation2012). Often, the emphasis is placed on the resulting finger and hand position after release and their relationship to an ideal backspin along an axis both horizontal and perpendicular to the target line, rather than the resulting backspin. The use of follow-through position as a substitute for ball backspin is likely due to hand and finger follow-through being easily observed by coaches and athletes while visual observers can only qualitatively assess backspin rates, with estimates of the three-dimensional SA direction being unreliable.
Earlier investigations into basketball backspin have been limited to how its magnitude contributes to ball–rim interaction and the identification of an optimal backspin speed to increase the chance an errant shot will still bounce through the goal (Okubo & Hubbard, Citation2006; Tran & Silverberg, Citation2008). One of the only sources of measured backspin rates comes from Mullineaux and Uhl (Citation2010) who report that backspin averaged 1.76 ± 0.38 Hz. While it has been suggested by Knudson (Citation1993) that lateral backspin may induce errors, there have been no attempts to measure the backspin direction or address how its variability relates to shooting accuracy.
This study aims to investigate how ball backspin induced by the hand and fingers while shooting a basketball influences lateral shooting error. First, the identification of the SA from a single camera is illustrated, and its geometrical interpretation is developed to quantify both backspin alignment and the rate of rotation. Next, variability of both the backspin rate and axis direction is investigated, and their influence on lateral shooting error is analysed. The study hypotheses are that (1) lateral error will increase as variability in the backspin direction increases; (2) lateral error will increase as an individual’s mean SA misalignment increases and (3) intra-individual lateral error increases for shot attempts with higher SA misalignment.
Materials and methods
A priori sample size analysis
A power analysis of a one-sided linear regression for slope size was performed using G*Power (Faul et al., Citation2009) to determine the required sample size to detect a correlation of 0.5 between lateral error and SA variation. The expected standard deviation (SD) in lateral error from a distance of 4.57 m was determined by using a typical shooting percentage of 70% (Silverberg et al., Citation2018) and approximating the lateral misses as 10% or half of those from velocity. Using a normal distribution for lateral error, an SD of 6.8 cm exceeded a 10.8 cm lateral margin of error required for a miss in 10% of attempts. Using α = 0.05, power (1-β) = 0.80 and lateral SD of 6.8 cm, the projected sample size was 21; therefore, a larger sample size of n = 26 was chosen.
Participants
Twenty-six collegiate basketball athletes (n = 26) were recruited for this study (males: n = 16, age = 21.3 ± 4.0 yrs, height = 189 ± 9 cm; females: n = 10, age = 20.6 ± 1.7 yrs, height = 174 ± 6 cm, left handed: n = 2). The participants were actively involved in institutionally sponsored competitive basketball teams (NCAA Division III: n = 10, Canadian U Sports Association: n = 16) with 2.5 ± 1.6 years of playing experience at the collegiate level. Each participant gave their voluntary consent for inclusion in the study, which was approved by the local ethics committee.
Design and methodology
Participants were asked to attempt 25 jump shots on a regulation height hoop (3.05 m) from a distance of 4.57 m (free throw line). To ensure a typical jump shot, each attempt began with the participant throwing the ball up, catching the ball off one bounce, then directly proceeding into a shooting motion. All attempts were centred and directly facing the backboard, without a defender and without any time restriction. After each attempt, the participants retrieved their shot and returned to the designated distance to begin their next attempt. Shots were attempted using a regulation basketball with 26 equally spaced 8 mm diameter white markers (three on each of the eight seams and two at the intersections of seams circumnavigating the ball).
Each shot was recorded using a tripod-mounted 1080p HD digital video camera with a shutter speed of 1/720 seconds. The camera was placed 1.5 m behind the shooter, centred to the basket within the sagittal plane and 2.5 m above the floor. Processing of the digital video for each attempt was done using Tracker 5.1.5 software (Open Source Physics Java framework). Lateral error, Δlat, is defined as the deviation of the ball centre from the sagittal plane when the ball intersects the horizontal plane at the height of the hoop.
Spin axis definition
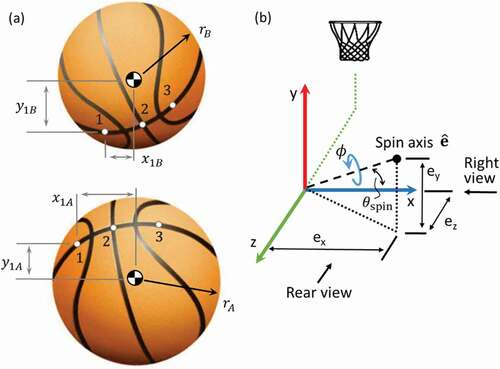
A basketball rotating from one orientation after release (bottom of )) to another orientation (top of )) exhibits three degrees of freedom. A natural way to formulate these degrees of freedom to facilitate identification of the SA is to utilize Euler’s theorem which states that the relative orientation of two frames can be represented with a single rotation by an angle ϕ about a particular axis , commonly called the Euler axis. For a basketball’s backspin, the Euler axis is equivalent to the SA while the angle ϕ represents the rotational displacement. The Euler axis is a unit vector in an inertial frame with the components (ex, ey, ez) as shown in ) representing the location of the vector tip from the origin. An ideal SA is (1, 0, 0) and directly aligned with the x-axis. As ey and ez increase in magnitude, the axis misalignment increases, with θspin being the total angle of the spin axis relative to the x-axis. Also in ), ϕ represents the backspin rotation, with backspin rate being its time derivative. Combined, ϕ, ey and ez define a ball’s three rotational degrees of freedom, with the fourth parameter ex determined by the constraint that
is a unit vector.
Figure 1. Spin axis estimation and geometric interpretation. (a) Ball and marker evolution after release, bottom: ball at release, top: ball after rotation, representing frames A and B, respectively. Note that only three of the 26 ball markers are shown to aid in the visualization of their movement. (b) Definition of the SA unit vector with coordinates (ex, ey, ez) defining the SA tip relative to any point in the sagittal plane. Shown as a “+” ey and “+” ez SA.
As a body exhibits general rotation, the Euler axis can change direction. However, by examining the Euler axis kinematics (Shuster, Citation1993) where ω is the angular velocity vector,
The right side is zero when the angular velocity is parallel to the Euler axis. Under such a condition, the Euler axis’s rate of change is zero and remains stationary. After the release of a basketball, when the fingers no longer contact the ball, ω is parallel to the Euler axis by definition. Since a basketball is a body of revolution and no external torques are applied perpendicular to ω until the ball contacts the rim or backboard, ω remains parallel to throughout the trajectory. Therefore, the Euler axis direction also remains constant.
The stationary property of a basketball’s Euler axis after its release simplifies the solution process since it means that the relative orientation of the ball at any two instants can be used to estimate the SA. This relative orientation can be expressed as a 3 × 3 orthonormal rotation matrix R so that direct estimation of the angle ϕ and are not required since they are recoverable from R using Euler’s formula (Shuster, Citation1993). The result is that identification of the backspin axis can be expressed as an attitude determination problem found in spacecraft literature (Shuster & Oh, Citation1981; Yang, Citation2012).
Spin axis estimation
Attitude determination uses multiple unit vectors known in both an inertial frame (B) and a rotating frame (A) to estimate the rotation matrix, R, relating unit vectors in both frames. The vectors used here are the unit vectors from the ball centre to the ith marker, mi. All marker unit vectors, mi, can be found from only one camera using the x-y location relative to the centre, the constraint that the marker is on the ball’s surface, and normalizing by the local radius to correct for the ball’s changing distance from the camera. ) illustrates the ball at release (bottom) and after rotation (top). The bottom image is considered (A) since, if a frame is fixed to the ball at A and rotates with it, miA will continue to appear the same from the ball’s perspective as it rotates. Similarly, after the ball rotates, the top image represents how the markers appear to a camera in the inertial frame and is designated as miB, the ith marker unit vector in the inertial frame (B). The n pairs of vector observation, with n being the total number of marker observations, can then be expressed as an attitude determination problem where a rotation matrix R is needed that best represents miA = R miB for i = 1 to n, for n ≥ 2.
The attitude determination problem, first proposed by Wahba (Citation1965), is defined as finding R that minimizes the weighted loss function
A convenient approach to minimize (2) is described in Yang (Citation2012) and Shuster and Oh (Citation1981) where the rotation matrix R is restated in terms of the four-parameter quaternion q = [q0 q]T = [q0q1q2q3]T. By using quaternions rather than R directly, the optimization problem is reduced to finding the eigenvalues and eigenvectors of K where,
and , S= B+ B T, σ = trace(B) and ZT = [B23-B32,B31-B13,B12-B21]. The eigenvector corresponding to the largest eigenvalue of K is the quaternion that minimizes (2) and represents the optimal rotation matrix R. Finally, after converting the estimated quaternion, q, to its equivalent rotation matrix R (Kuipers, Citation1999), the ball’s SA can be recovered (Shuster, Citation1993) using
For all analysis done in this study, the SA was estimated using three markers as they rotated from the moment of last contact until 16 ms before any one marker was obscured by the ball. Typically, this resulted in a quarter to a sixth of a ball rotation separating (A) and (B) in ).
Statistical analysis
Statistical analysis was performed in Matlab v9.2.0 R2017a (Mathworks Inc., Natick MA, USA). Descriptive statistics are presented as means ± SD for inter-individual data: ey and ez, rate of backspin; ωspin and θspin, SA misalignment; and for intra-individual data: ey SD, ez SD and ωspin SD, lateral error SD. Analysis between variables are presented as correlations using the Pearson product-moment coefficient, r, and interpreted as almost perfect (>0.9), very strong (>0.7), strong (>0.5), moderate (>0.3), weak (>0.1) or trivial (<0.1). In addition, simple linear regressions are also provided to illustrate the functional relationship between two variables, where the coefficient of determination R2 can be found from the reported correlation, r, since R2 = r2 for linear regressions with one independent variable. A one-sample t-test is used to determine if the intra-individual relationship between misalignment, θspin, and lateral error, Δlat, was significantly different than the null hypothesis. For each t-test, an Anderson-Darling test was used to verify that the data did not significantly vary from normality. In all cases, statistical significance was set at 0.05. A test–retest reliability analysis was performed of one participant for θspin and Δlat to assess the reliability of the digitization of the ball centre and marker location. The reliability coefficient and SD of test–retest differences were 0.994 and 0.7 degrees for θspin and 0.998 and 0.48 cm for Δlat.
Results
Descriptive statistics, presented as means ± SD and ranges, are provided in for parameters describing SA misalignment (ey, ez and θspin), SA variability (SD of ey, ez and θspin), spin rate (ωspin and SD of ωspin) and lateral error SD (Δlat SD). illustrates the tip of the SA (ey, ez) as viewed from the shooting hand side (right side for a right-handed participant as shown in and left side for a left-handed shooter). The measured global SA for left-handed shooters is reflected about the y-axis and z-axis in for a direct comparison with right-handed shooters. The cross covariance between ez and ey is 0.0054 and small compared to the SD of ey and ez, resulting in a correlation ryz = 0.14, indicating that ey and ez are nearly independent. One sample t-tests result in a mean ey of −0.221 (p < 0.001, 95% CI: −0.318 – −0.124) and a mean ez of −0.168 (p < 0.001, 95% CI: −0.234 – −0.102). Confidence intervals are shown in as a dashed oval.
Table 1. Descriptive inter-individual statistics of ball spin parameters and lateral error (n = 26)
Figure 2. Spin axis tip as viewed from the right side of the basket. O: right-handed shooters, X: left-handed shooters with SA reflected, *: mean SA tip, –: 95% confidence interval of the mean.
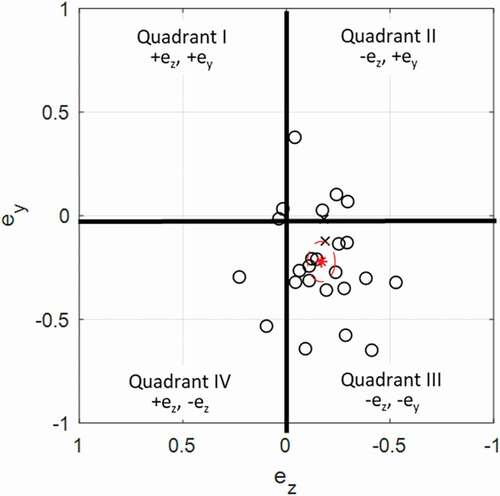
An axis that is horizontal and perpendicular to the sagittal plane (y-z) has zero ey, ez, resulting in θspin also being zero. As seen in , the mean SA falls within the (-ez, -ey) quadrant and has a misalignment of of 15.5 degrees, indicating that right-handed shooters typically tip their SA towards the target and down (left-handed shooters equivalently tipping their SA away from the target and up occurring in the (+ez, +ey) quadrant). Note that the mean of θspin in and
are different parameters. The former represents the mean misalignment of all participants, while the latter represents the misalignment of the mean SA.
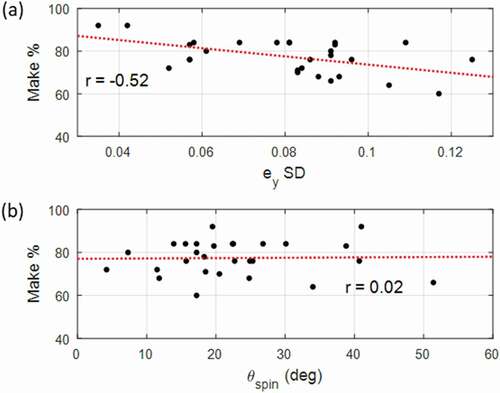
The relationships between SA tip SD and lateral error SD are illustrated in ) and reveal a very strong correlation between a shooter’s ey variability (r = 0.80, p < 0.001) and a strong correlation between a shooter’s ez variability (r = 0.51, p = 0.01). Only a moderate correlation ()) is found between backspin rate SD and lateral error (r = 0.44, p = 0.026), suggesting that while backspin rate is related to lateral error SD, SA variability is a better predictor of lateral shooting performance. ) illustrates that there is no significant correlation (r = −0.21, p = 0.34) between a shooter’s mean misalignment and their lateral error SD, with the two most accurate and two least accurate shooters all having alignment errors near the mean θspin of 22.7 degrees. Similarly, no correlation was observed between the backspin rate and lateral error SD (r = −0.04, p = 0.50). As an alternative to lateral error SD, compares the rate of successful shot attempts as a performance indicator to both ey variability and SA misalignment. A strong negative correlation exists between a shooter’s rate of successful attempts and ey variability (r = −0.52, p = 0.01). No significant correlation occurs between the rate of successful attempts and SA misalignment (r = 0.02, p = 0.50).
Figure 3. Relationship between backspin direction and magnitude variability with lateral error SD, where variability is measured as intra-individual SDs. (a) Vertical SD of SA tip. (b) Forward–backward SD of SA tip. (c) Backspin rate SD.
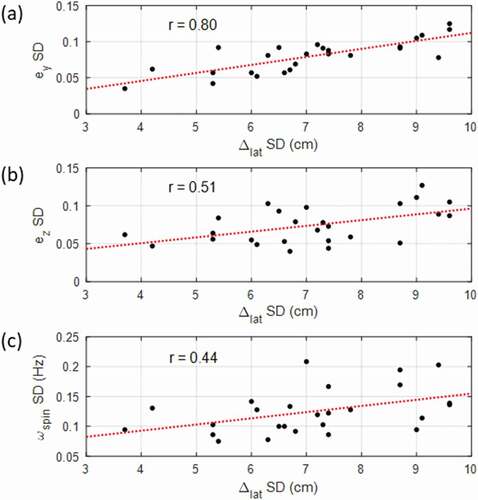
Figure 4. Relationship between mean SA misalignment and mean backspin with lateral error SD. (a) Mean angle between the SA and x-axis. (b) Mean backspin rate.
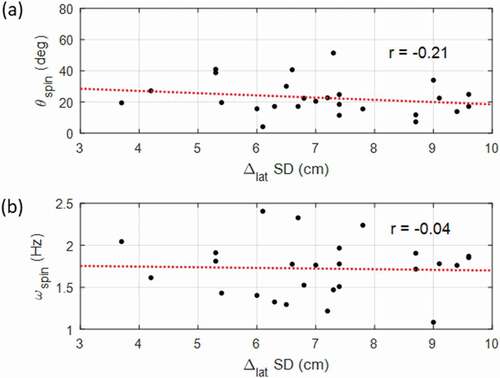
Figure 5. Rate of successful attempts compared with intra-individual ey variation and mean SA misalignment. (a) ey SD. (b) Mean angle between the SA and x-axis.
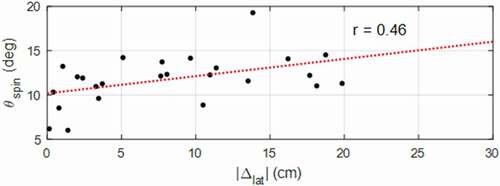
An intra-individual, shot-by-shot, analysis of SA misalignment and lateral deviation was done for each participant. shows the analysis for one representative shooter, with each marker indicating one of their 25 shot attempts. Linear regression between the SA misalignment and magnitude of lateral error for each attempt reveals a moderate intra-individual relationship (r = 0.46, p = 0.02) with a slope of 0.20 degrees/cm. Although the relationship is not strong enough to provide a predictive model, it suggests that for this shooter, their most accurate attempts averaged 4 degrees less misalignment than their most inaccurate (20 cm of lateral error) attempts. A similar analysis was done for all participants in the study, with a one-sample t-test revealing an average slope between SA misalignment and lateral error magnitude of 0.17 degrees/cm (p < 0.001, 95% CI: 0.24–0.09). These results are distinct from the inter-individual results of and suggest that while small spin misalignment is not required to be accurate () and ), intra-individual trends indicate each shooter may reduce lateral error by reducing their spin misalignment.
Figure 6. Intra-individual comparison of SA misalignment with lateral missed distance for each shot attempt from a representative participant (participant 22).
Discussion
Backspin and spin axis alignment
This study is the first to investigate the alignment of the SA; however, the backspin rate has previously been measured (Mullineaux & Uhl, Citation2010). The mean backspin rate in this study was found to be 1.72 ± 0.33 Hz with a range of 2.41–1.08 Hz and is comparable to other reported values of 1.76 ± 0.38 Hz with a range of 2.86–0.92 Hz (Mullineaux & Uhl, Citation2010).
A significant finding of this study is that the mean SA direction was observed to be significantly different (p < 0.001) than a SA aligned with the x-axis. For right-handed shooters, 17 of the 26 shooters had the tip of their SA in quadrant III (-ez, -ey), while only 2 were in quadrant IV and 5 in quadrant II. Two shooters had their SA aligned within 5 degrees of the x-axis, and although they marginally fell within quadrant I, they can be viewed as having the commonly assumed ideal backspin alignment. Therefore, a typical right-handed shooter exhibits an SA tipped down (-ey) and towards the target (-ez), appearing as quadrant III in . In some cases, right-handed shooters may exhibit either a + ey or +ez tendency and marginally fall within quadrant II or IV, but significant migration into quadrant I is rare. For a left-handed release, the release mechanics can be considered as mirroring that of a right-handed release about the sagittal plane, noting that the release hand is on the left side of the ball with respect to the origin. Therefore, as the left tip of SA moves down and towards the target, mirroring a right-handed release, the right tip moves up and back in the global coordinates defined in . This results in the SA of a left-handed release experience a reflexive symmetry with that of a right-handed release. , from a left-handed release perspective, would mean a typical left-handed shooter exhibits an SA tipped up (+ey) and away from the target (+ez), or quadrant I. Left-handed shooters would then occasionally fall within quadrant II or IV but rarely quadrant III. These results apply to experienced collegiate players as measured in this study. Players with less experience, such as in youth basketball, may exhibit broader variability in SA alignment, and the higher occurrence within quadrant III (I for left-handed players) may not extend to them. Further study is required to assess how SA alignment and variability may change with experience level.
The location of the average SA for right-handed shooters within quadrant III, and not aligned with the x-axis, may be related to the hand mechanics as the ball transitions from the catch to release. As the ball is caught before shooting, the right and left hands naturally fall on the right and left sides of the ball. As the shooting hand transitions from the side to behind the ball at release, a twisting of the ball about the negative y-axis is required ()) for a right-handed shooter (positive y-axis for a left-handed release). An implication is that the timing of this motion and its possible carry over to the release may contribute to the -ey tendency of right-handed shooters (+ey for left-handed). Similarly, if the hand transition from side to behind the ball is incomplete, with the release hand remaining on the right side for a right-handed release (left side for a left-handed release), an SA parallel to the palm points towards the target facilitating the – ez tendency of right-handed shooters (+ez for left-handed).
Relationship between the spin axis and lateral error
Variability of the SA was analysed by investigating the SD of ey and ez separately to determine if either one or both were correlated to lateral error. Variability in ey ()) was the best predictor of lateral error SD (r = 0.80, p < 0.001), with ez also having a strong correlation (r = 0.51, p = 0.01). Therefore, hypothesis 1, lateral error will increase as variability in the backspin direction increases, is accepted. The significance of the correlation between variability in ey and lateral error ()) being more significant than shooting percentage ()) is that shooting percentage is determined by both left-right error (lateral error) and distance error. Therefore, variability in SA alignment is primarily a source of lateral shooting error and may be less important for distance control.
Spin rate SD was only moderately correlated to Δlat SD () and by itself was not a good predictor of Δlat SD. It is speculated that spin rate SD may be associated with variability in the SA direction (ey and ez), and as the axis varies, the resulting spin rate also varies due to differences in hand position. In such a scenario, the relationship between spin rate SD and lateral error would be only secondary, with spin rate SD not directly increasing lateral error.
Spin axis misalignment in is related to Δlat SD in ). Results indicate that no significant correlation exists between an individual’s SA alignment and their lateral accuracy as measured by the SD of Δlat. Therefore, hypothesis 2, lateral error will increase as an individual’s mean SA misalignment increases, is rejected, and an individual’s proximity to ideal backspin is not predictive of their overall lateral accuracy. In contrast, when the intra-individual relationship between a participant’s SA alignment and lateral error for each attempt was analysed (as in ), it was found that individuals averaged a trend of 0.17 degrees more misalignment for each cm of lateral error (p < 0.001). This highlights that regardless of an individual’s mean SA alignment, they tended to have more lateral error for attempts with more SA misalignment. Therefore, hypothesis 3, intra-individual lateral error increases for shot attempts with higher SA misalignment, is accepted.
Reconciling inter-individual and intra-individual observations
The two conclusions that mean SA misalignment is unrelated to lateral error while individuals tend to see decreases in lateral error for attempts with more SA misalignment may appear to be in tension and thus require further discussion. The apparent tension originates from literature investigating learning in throwing tasks (Müller & Sternad, Citation2004; Zhang et al., Citation2018), which shows individuals explore the solution space and converge to release strategies that reduce error. Yet, for SA alignment, intra-individual reductions in lateral error as alignment improves do not appear to translate into better shooters also having better alignment.
One explanation may be the relative observability of the release angle and velocity in typical throwing studies compared to SA alignment in basketball. The release angle (high versus low) and velocity (short versus long) are readily observable by players and coaches and provide immediate feedback regarding an attempt. With practice, this feedback facilitates learning and results in improved performance. In contrast, SA alignment is substantially more challenging to visually observe. Consider the case where the seams of a ball are all horizontal and a release has an ideal x-axis spin. The ball will then spin so that all seams rotate directly about the x-axis and the SA is readily observable. However, if the seams begin a few degrees away from horizontal and the ball is still released with ideal x-axis spin, the seams then rotate chaotically with the SA visually undetectable. In general, if the ball is released with an arbitrary SA, the SA will only be visually observable if the seams of the ball were aligned with the axis at release. Such a condition may only occur occasionally while shooting, resulting in the SA being difficult to visually estimate for most attempts. The visually unobservable nature of SA alignment may restrict feedback during the learning process so that the moderate improvements in lateral error as alignment is improved (as in ) fail to lead to improved mean alignment over time.
An important distinction should be made that the lack of correlation between SA alignment and lateral error ()) along with the mean alignment occurring away from the x-axis () does not necessarily mean that spin aligned with the x-axis is not the best release strategy. Based on the intra-individual improvement of lateral error as alignment improved, a question that remains is whether improving SA alignment through coaching intervention and SA measurement feedback would also result in improved lateral accuracy for most individuals.
Conclusion
This study, which is the first to investigate the relationship between the ball spin axis and lateral error in basketball shooting, found that characteristics of ball backspin provide valuable insight into lateral accuracy. While an individual’s spin axis misalignment alone did not predict lateral accuracy, intra-individual trends suggested that an individual could improve accuracy by reducing overall misalignment error. A good predictor of lateral accuracy was an individual’s spin axis variability with both SD of ey (vertical tipping of the axis in the x-y plane) and ez (forward-backward tipping in the x-z plane), demonstrating significant positive relationships with lateral error SD. However, of the two, variability in ey was the best predictor of lateral accuracy. This finding is valuable to players and coaches because it suggests that initial assessment of spin axis alignment and variability could be simplified to the tipping of the axis in the x-y plane (ey), rather than the more complex full three-dimensional alignment (ey and ez).
Disclosure statement
No potential conflict of interest was reported by the author(s).
Additional information
Funding
References
- Ammar, A., Chtourou, H., Abdelkarim, O., Parish, A., & Hoekelmann, A. (2016). Free throw shot in basketball: Kinematic analysis of scored and missed shots during the learning process. Sport Sciences for Health, 12(1), 27–33. https://doi.org/10.1007/s11332-015-0250-0
- Bartlett, R., Wheat, J., & Robins, M. (2007). Is movement variability important for sports biomechanists? Sports Biomechanics, 6(2), 224–243. https://doi.org/10.1080/14763140701322994
- Bootsma, R. J., Houbiers, M. H. J., Whiting, H. T. A., & van Wieringen, P. C. W. (1991). Acquiring an attacking forehand drive: The effects of static and dynamic environmental conditions. Research Quarterly for Exercise and Sport, 62(3), 276–284. https://doi.org/10.1080/02701367.1991.10608724
- Button, C., MacLeod, M., Sanders, R., & Coleman, S. (2003). Examining movement variability in the basketball free-throw action at different skill levels. Research Quarterly for Exercise and Sport, 74(3), 257–269. https://doi.org/10.1080/02701367.2003.10609090
- Coves, A., Caballero, C., & Moreno, F. J. (2020). Relationship between kinematic variability and performance in basketball free-throw. International Journal of Performance Analysis in Sport, 20(6), 931–941. https://doi.org/10.1080/24748668.2020.1820172
- Faul, F., Erdfelder, E., Buchner, A., & Lang, A. G. (2009). Statistical power analyses using G*Power 3.1: Tests for correlation and regression analyses. Behavior Research Methods, 41(4), 1149–1160. https://doi.org/10.3758/BRM.41.4.1149
- Hopla, D. (2012). Basketball shooting. Human Kinetics.
- Hudson, J. L. (1985). Prediction of basketball skill using biomechanical variables. Research Quarterly for Exercise and Sport, 56(2), 115–121. https://doi.org/10.1080/02701367.1985.10608445
- Knudson, D. (1993). Biomechanics of the basketball jump shot – Six key teaching points. Journal of Physical Education, Recreation & Dance, 64(2), 67–73. https://doi.org/10.1080/07303084.1993.10606710
- Kuipers, J. B. (1999). Quaternions and rotation sequences: A primer with applications to orbits, aerospace and virtual reality. Princeton University Press.
- Müller, H., & Sternad, D. (2004). Decomposition of variability in the execution of goal-oriented tasks: Three components of skill improvement. Journal of Experimental Psychology: Human Perception and Performance, 30(1), 212–233. https://doi.org/10.1037/0096-1523.30.1.212
- Mullineaux, D. R., & Uhl, T. L. (2010). Coordination-variability and kinematics of misses versus swishes of basketball free throws. Journal of Sports Sciences, 28(9), 1017–1024. https://doi.org/10.1080/02640414.2010.487872
- Okazaki, V., & Rodacki, A. (2012). Increased distance of shooting on basketball jump shot. Journal of Sports Science and Medicine, 11(2), 231–237. https://www.jssm.org/volume11/iss2/cap/jssm-11-226.pdf
- Okazaki, V., Rodacki, A., & Satern, M. N. (2015). A review on the basketball jump shot. Sports Biomechanics, 14(2), 190–205. https://doi.org/10.1080/14763141.2015.1052541
- Okubo, H., & Hubbard, M. (2006). Dynamics of the basketball shot with application to the free throw. Journal of Sports Science, 24(12), 1303–1314. https://doi.org/10.1080/02640410500520401
- Robins, M., Wheat, J., Irwin, G., & Bartlett, R. (2006). The effect of shooting distance on movement variability in basketball. Journal of Human Movement Science, 50(4), 217–238.
- Shuster, M. D., & Oh, S. D. (1981). Three-axis attitude determination from vector observations. Journal of Guidance, Control,& Dynamics, 4(1), 70–77. https://doi.org/10.2514/3.19717
- Shuster, M. D. (1993). A survey of attitude representations. Journal of the Astronautical Sciences, 40(4), 439–517.
- Silverberg, L. M., Tran, C. M., & Laue, C. (2018). Gender comparison in consistency in the basketball free throw by an event-driven approach. Sports Engineering, 21(4), 333–334. https://doi.org/10.1007/s12283-018-0276-z
- Slegers, N., Lee, D., & Wong, G. (2021). The relationship of intra-individual release variability with distance and shooting performance in basketball. Journal of Sports Science and Medicine, 20(3), 508–515. https://doi.org/10.52082/jssm.2021.508
- Tran, C. M., & Silverberg, L. M. (2008). Optimal release conditions for the free throw in men’s basketball. Journal of Sports Science, 26(11), 1147–1155. https://doi.org/10.1080/02640410802004948
- Verhoeven, F. M., & Newell, K. M. (2016). Coordination and control of posture and ball release in basketball free-throw shooting. Human Movement Science, 49, 216–224. https://doi.org/10.1016/j.humov.2016.07.007
- Wahba, G. (1965, July). Problem 65–1: A Least Squares Estimate of Spacecraft Attitude. SIAM Review, 7(3), 409.
- Wissel, H. (2004). Basketball-steps to success. Human Kinetics.
- Yang, Y. (2012). Spacecraft attitude determination and control: Quaternion based method. Annual Reviews in Control, 36(2), 198–219. https://doi.org/10.1016/j.arcontrol.2012.09.003
- Zhang, Z., Guo, D., Huber, M., Park, S., & Sternad, D. (2018). Exploiting the geometry of the solution space to reduce sensitivity to neuromotor noise. PLoS Computational Biology, 14(2), e1006013. https://doi.org/10.1371/journal.pcbi.1006013