
 ?Mathematical formulae have been encoded as MathML and are displayed in this HTML version using MathJax in order to improve their display. Uncheck the box to turn MathJax off. This feature requires Javascript. Click on a formula to zoom.
ABSTRACT
The magnitude of change following strength and conditioning (S&C) training can be evaluated comparing effect sizes to thresholds. This study conducted a series of meta-analyses and compiled results to identify thresholds specific to S&C, and create prior distributions for Bayesian updating. Pre- and post-training data from S&C interventions were translated into standardised mean difference (SMDpre) and percentage improvement (%Improve) effect sizes. Bayesian hierarchical meta-analysis models were conducted to compare effect sizes, develop prior distributions, and estimate 0.25-, 0.5-, and 0.75-quantiles to determine small, medium, and large thresholds, respectively. Data from 643 studies comprising 6574 effect sizes were included in the analyses. Large differences in distributions for both SMDpre and %Improve were identified across outcome domains (strength, power, jump and sprint performance), with analyses of the tails of the distributions indicating potential large overestimations of SMDpre values. Future evaluations of S&C training will be improved using Bayesian approaches featuring the information and priors developed in this study. To facilitate an uptake of Bayesian methods within S&C, an easily accessible tool employing intuitive Bayesian updating was created. It is recommended that the tool and specific thresholds be used instead of isolated effect size calculations and Cohen’s generic values when evaluating S&C training.
KEYWORDS:
Introduction
Strength and conditioning (S&C) which involves the application of a range of training modalities to enhance athletic performance has become a well-established discipline within sport and exercise science (Weldon et al., Citation2021, Citation2020). Much of the popularity of S&C originates from the perspective that muscular strength is of primary importance in athletic and sports performance (Suchomel et al., Citation2016; Swinton et al., Citation2014); however, it has been argued that evidence is lacking to demonstrate causal effects (Steele et al., Citation2020). Additionally, muscular strength can be developed extensively with relatively limited time and cost. Research investigating training methods such as resistance, sprint and plyometrics has experienced rapid growth since the late 1990s (Kraemer et al., Citation2017; Ramirez-Campillo et al., Citation2018), with large numbers of training studies focusing on identifying the best regimes to improve different aspects of fitness. A challenge in integrating the findings of longitudinal research within a general framework includes the potential for idiosyncratic findings based on experimental choices of individual studies. Findings may be influenced by a range of moderating factors including the study population, the length of training, the outcomes assessed, and the training regimes adopted. Given the range of factors that could influence results, evidence synthesis approaches including meta-analyses may provide the most effective means of summarising results and identifying general patterns that can inform researchers and practitioners.
Evidence synthesis and the use of meta-analyses to objectively quantify various phenomena across training studies has become common in S&C (Peterson et al., Citation2005, Citation2004; Rhea, Citation2004; Rhea & Alderman, Citation2004; Rhea et al., Citation2002, Citation2003). The most frequently reported effect size statistic is the pre-standardised mean difference (SMDpre), where the mean change is divided by the pre-training standard deviation. This statistic comprises several conceptual advantages (Caldwell & Vigotsky, Citation2020) including the fact that it is dimensionless and enables the synthesis of outcomes reported across different units and scales (e.g., vertical jump power in thousands of Watts, and vertical jump height in tens of centimetres). With this process there is also an implicit assumption of underlying latent constructs (i.e., strength, power, jump and sprint performance) with appropriate construct validity represented through measurement from different tests (e.g., operationalisations). One of the primary reasons for the widespread use of the SMDpre includes the existence of commonly used threshold values to apply qualitative labels describing the magnitude of change following training as “small”, “medium”, or “large”. However, threshold values have generally used Cohen’s initial suggestions (Cohen, Citation1988) which were determined arbitrarily with the behavioural and social sciences in mind. To obtain suitable estimates of the population effect size, the sample standard deviation must reflect the spread of values in the population. However, if random sampling is not conducted and restricted homogenous samples are obtained, the sample standard deviation is likely to underestimate the population standard deviation and thereby overestimate SMDpre (Baguley, Citation2009). An alternative effect size statistic focused on sample means that can provide simple and intuitive interpretations of the magnitude of change following training is the relative ratio (RR), calculated by taking the ratio of two means (Hedges et al., Citation1999). Like the SMDpre, the RR (post-training mean divided by pre-training mean) is dimensionless enabling synthesis of outcomes across different units and scales. It has been argued that the RR, which can also be interpreted in terms of percentage improvement (e.g., 1.50 is equivalent to a 50% increase from baseline, and 0.8 is equivalent to a 20% decrease) is easier to interpret than the SMDpre making it a more applicable summary statistic (Friedrich et al., Citation2011). It is important to note that the RR can be calculated from means pre- and post-training, or from the means of two different groups. The RR has received limited use in previous meta-analyses conducted in sport science (Deb et al., Citation2018) which may be partly due to standard thresholds not being available.
Almost all statistical analyses conducted in S&C research employ a frequentist frameworks where effect sizes are calculated anew without including prior information of likely values based on previous research. In the minority of cases where uncertainty in effect sizes is quantified, frequentist frameworks apply confidence intervals that can be challenging to interpret (Hespanhol et al., Citation2019). Additionally, due to the small sample-sizes frequently used in S&C training studies (Rhea et al., Citation2003), uncertainty in effect sizes calculated under frequentist frameworks is likely to lack precision. In contrast, Bayesian frameworks enable individuals to include prior information and express uncertainty in effect sizes estimates in a probabilistic manner (e.g., using a posterior distribution), borrowing strength from previous research to increase precision. Common critiques of Bayesian approaches include the complexity that may exist with the analysis process and challenges in creating suitable informative priors (Goodman, Citation1999). However, meta-analysis models estimate a set of training effects rather than a single estimate and can thus be used to develop priors that combine with new data using simple calculations to obtain normally distributed posteriors quantifying the most likely population effect sizes (Jones et al., Citation2018). Given the large amount of training studies that have been conducted in S&C and limitations in current frameworks to interpret the magnitude of change following training, the purpose of this study was to conduct a series of large-scale meta-analyses to generate context-specific thresholds for multiple effect sizes and develop Bayesian priors. Meta-analysis models were conducted and compared across multiple outcome domains with results incorporated into an accessible tool to better interpret future S&C training.
2. Methods
2.1. Search strategy
A search was performed for published and unpublished studies in the English language that included S&C training conducted prior to January 2018. The search was performed using Embase, Medline, Web of Science, Sport Discus and Google Scholar. Hand searching of relevant journals including Medicine and Science in Sports and Exercise, the Journal of Strength and Conditioning Research, and Research Quarterly was also conducted. Database search terms were included to identify various training modes and a range of outcome measures. The following keywords and phrases were combined with Boolean operators; “strength” OR “resistance” OR “sprint” OR “plyometric” OR “exercise” AND “intervention” OR “training” OR “program” OR “programme” AND “1RM” OR “repetition maximum” OR “speed” OR “velocity” OR “power” OR “jump” OR “change of direction” OR “agility” OR “acceleration” OR “rate of force development”. No restriction was placed on the date of the study.
2.2. Inclusion criteria
Inclusion and exclusion criteria for the current meta-analysis were set to include as many relevant S&C training modes and dependent variables as possible. Inclusion criteria comprised: 1) any training-based study ≥4 weeks; 2) healthy trained or untrained participants with a mean age between 14 and 60; 3) training group with a minimum of 4 participants; 4) pre- and post-training means and standard deviations; and 5) sufficient information provided to appropriately describe the training method. Studies comprising training that were predominantly aerobic-based or rehabilitation focused were excluded.
2.3. Study selection and data extraction
Following deduplication, a three-level selection process comprising title, then abstract then full-text screening was completed. Studies were screened and selected for inclusion independently by AM with discussions with PS and KB where required. A standardised extraction codebook was developed using Microsoft Excel, with data extracted and coded independently by four researchers (AM, JP, AH, LG) in duplicate with AM completing extraction for all studies to provide consistency. The following data were extracted: 1) study details (authors, year, total number of groups); 2) participant characteristics (final study n, gender, training status, and age); 3) outcome domain (maximum strength, power, jump performance, and sprinting performance); and 4) pre- and post-training means and standard deviations.
The following definitions were used to categorise outcome domains: 1) maximum strength: a measure of maximum force production where time was not limited (e.g., 1–6 repetition maximum, isometric mid-thigh pull, peak torque); 2) power: a direct measurement of power output measured in Watts (absolute and normalised relative to body mass); 3) jump performance: a measure of jump height or distance; and 4) sprint performance: a measurement of the time to complete a specified linear distance or the velocity achieved. Where pre- and post-training data were not presented in text but in figures, data were extracted using PlotDigitizer 2.6.8 Windows. Study authors were not contacted for data where this could not be retrieved in text or through digitization on a pragmatic decision based on resource availability.
2.4. Statistical analysis
A Bayesian framework was chosen over frequentist to provide a more flexible modelling approach and enable results to be interpreted intuitively through the reporting of the probability of parameter values, given the observed data (Kruschke & Liddell, Citation2018). Effect sizes and their sampling variance were calculated using group mean and standard deviation values calculated pre-training and at any subsequent time-point. The SMDpre and RR effect sizes and their sampling variances were calculated using the following formulae (Lajeunesse, Citation2011, Citation2015; Morris & DeShon, Citation2002):
where is the number of participants in the training and the first term comprises a small-study bias term
, where
where is the correlation between repeated measures.
Percentage improvement (e.g., positive value represents improvement and negative value represents a decline in performance) was then calculated using the following formulae depending on whether an increase (+) or decrease (-) in the outcome represented an improvement in performance.
Prior to conducting full meta-analysis models, the tails of the empirical distributions were investigated by focusing on the most extreme 1%, 2% and 5% of values for both the SMDpre and %Improve effect sizes. All meta-analyses were conducted using a nested four-level Bayesian mixed effects meta-analytic model (Jones et al., Citation2018). The series of nestings included the individual study (level 4), the outcome (level 3), the measurement occasion (level 2) and the sampling variance (level 1). Where studies included multiple time points following baseline (e.g., level 2) effect sizes were calculated for each time point relative to baseline and included in the model. To account for uncertainty in due to non-reporting of
, the values were allowed to vary and were estimated by including an informative Gaussian prior approximating correlation values centred on 0.7 and ranging from 0.5 to 0.9. Variance partition coefficients (VPCs) were used to quantify the relative variance explained across the different levels of the hierarchy, with addition of VPCs used to estimate the expected (population) correlation between two randomly chosen elements within the same nesting structure (Hox et al., Citation2018). The parameters obtained from the meta-analysis models were then used to calculate small, medium and large threshold values for each of the outcome domains. This was achieved by generating posterior predictions from each meta-analysis model and calculating the 0.25-, 0.5-, and 0.75-quantiles. Posterior predictions used the posterior sample for the model parameters to simulate new data. Weakly informative Student-t prior and half Student-t priors with 3 degrees of freedom were used for intercept and variance parameters (Gelman, Citation2006). Outlier values were identified by adjusting the empirical distribution by a Tukey
-and-
distribution and obtaining the 0.0035- and 0.9965-quantiles, with values beyond these points removed prior to further analysis (Verardi & Vermandele, Citation2018). Meta-analyses were performed using the R wrapper package brms interfaced with Stan to perform sampling (Bürkner, Citation2017). Convergence of parameter estimates was obtained for all models with Gelman-Rubin R-hat values below 1.1 (Gelman et al., Citation2014).
To build prior distributions for each outcome domain, the posterior mean and standard deviation (calculated as the square root of the sum of variance components across levels 2 to 4) obtained from the meta-analysis models along with their credible intervals (mean: 0.025 to 0.975-quantile; standard deviation: 0.125 to 0.875-quantile) were collected. An expanded grid optimisation search was used to select a mean and standard deviation value to represent the normally distributed prior across the credible intervals identified. For each point on the grid, the mean and standard deviation value was used to calculate the quantile value of the small, medium and large thresholds previously identified. A least squares approach was then used with the cost function equal to the squared sum of the differences between the quantile values collected and the corresponding 0.25, 0.5 and 0.75 reference values. Finally, a supplementary file was created so that the prior distributions calculated could be combined with data from future S&C training to produce posterior distributions (Jones et al., Citation2018) and probabilistic information on whether the training exceeds the context-specific small, medium and large thresholds. With new data, the Bayesian updating is achieved by calculating the effect size
and standard error. The standard error is then transformed into a standard deviation of the participant-level outcome
using
where is the number of participants in the training of interest. The prior variance
is then re-expressed so that the amount of information contained in the prior distribution is equivalent to training with
participants where
The Bayesian updating for the posterior distribution of the effect size is then achieved by using the following formula (Jones et al., Citation2018)
3. Results
The search strategy returned 110,662 records which reduced to 2108 studies following deduplication and title screening. Following abstract screening this reduced to 973, and 706 following full-text screening. A total of 643 studies featured the required data to be included in the meta-analyses, generating a total of 6574 effect sizes. A list of the 643 studies is included in the supplementary file. Most studies comprised untrained participants (59.6%), followed by recreationally trained (33.6%) then highly trained (6.8%). The most popular training modes were standard resistance training (33.8%), followed by combined (e.g., resistance and power, 28.5%) and plyometric (12.4%). Most training comprised three sessions per week (42.2%), followed by two sessions (37.8%) then four sessions (10.5%). The majority of training included up to six exercises per session (73.5%), for three (36.6%) or four sets (25.2%). Comparison of gender identified that most studies were comprised solely of males (66.8%), followed by a similar number of studies comprising both males and females (17.1%), and then females only (16.1%). Information describing the distribution of study characteristics are presented in . Most training lasted between 6 and 12 weeks, with 25 studies (3.9%) including training longer than 25 weeks, and 14 studies including training longer than 52 weeks (2.2%). The median number of outcomes extracted from studies was 4 with interquartile range (IQR): 2–7. The median number of groups included in studies was 2 with IQR: 2–3. The most common outcome domain was maximum strength (2588 effect sizes from 419 studies), and the least common was power (1183 effect sizes from 203 studies).
Table 1. Distribution (percentiles) of study characteristics and overview of outcome domains.
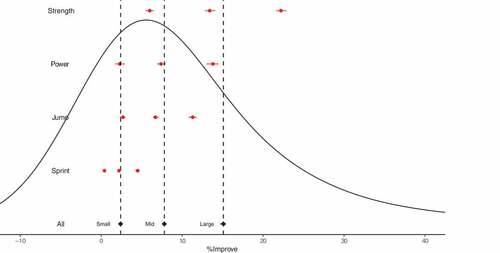
Prior to applying the meta-analytic model, the tails of the empirical values were investigated, with each demonstrating long right tails (). Pooled across all outcome domains, the 0.975-, 0.9875- and 0.995-quantiles for SMDpre were equal to 3.2, 4.8 and 8.6, respectively; and for %Improve were equal to 45.9%, 59.6% and 88.2%, respectively. Similar long right tails representing implausible values were identified across all outcome domains for SMDpre but were restricted primarily to maximum strength for %improve (). Data were then prepared for meta-analysis and a total of 123 outliers were removed with lower bound SMDpre and %improve thresholds of −0.91 and −13.4%, and upper bound SMDpre and %improve thresholds of 6.7 and 87.6%. Effect size estimates including small, medium and large thresholds are presented in . Numerical values and summaries of variance parameters are presented in the supplementary table. Pooled across all outcome domains the threshold value estimates for SMDpre equalled small: 0.16 [95%CrI: 0.15 to 0.18], medium: 0.46 [95%CrI: 0.45 to 0.48], and large: 0.81 [95%CrI: 0.79 to 0.83]; and for %Improve equalled small: 2.4 [95%CrI: 2.1 to 2.6%], medium: 7.8 [95%CrI: 7.5 to 8.0%], and large: 15.1 [95%CrI: 14.7 to 15.4%]. Comparisons across outcome domains identified large differences in threshold values for both effect size statistics with the greatest values obtained for maximum strength, followed by similar values for power and jump performance, and finally, substantively smaller values for sprint performance ().
Table 2. Direct calculation of largest and smallest 1%, 2% and 5% of effect sizes across outcome types.
Figure 1. Empirical distribution and modelled outcome-specific standardised mean difference effect size thresholds.
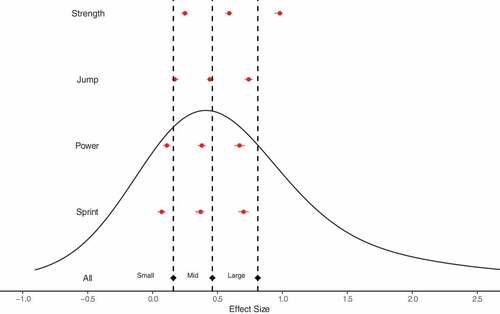
Figure 2. Empirical distribution and modelled outcome-specific percentage improvement effect size thresholds.
Mean and standard deviation values for future normal distribution SMDpre and %improve priors are presented in . The large difference in means across outcome domains reflected the same ordering observed across small, medium and large thresholds. However, consistently the standard deviation was similar in size to the mean, demonstrating the large variability in results that should be expected based on the training and potentially population characteristics.
Table 3. Mean and standard deviations of prior distributions for standardised mean difference (SMDpre) and log transformed relative ratio (RR) effect sizes statistics across outcome domains.
4. Discussion
The present study comprises one of the largest meta-analyses in sport and exercise science and the largest synthesis of contemporary S&C training to date. In general, the analyses showed similar findings for SMDpre and %Improve, with the greatest effect sizes obtained for maximum strength outcomes, and substantively smaller values for sprint performance. For both effect sizes, the positive tails of the empirical distribution had the potential to exhibit extremely large values. These large values were generally restricted to maximum strength outcomes for %Improve (e.g., ~60 to 110% improvement) but were consistently large and physiologically implausible for SMDpre across all outcome domains (~4 to 11). Development of Bayesian prior distributions resulted in relatively large spreads with standard deviation values close to the mean, and for sprint performance standard deviations were greater in value, which was consistent with the finding that a substantive proportion of the distribution included effect sizes close to zero.
Cohen’s (Cohen, Citation1988) generic threshold values (small: 0.20, medium: 0.50, and large: 0.80) were broadly in line with SMDpre values obtained from the current meta-analysis when data were pooled across all outcome domains (e.g., small ~ 0.15, medium ~ 0.45, large ~ 0.80). In contrast, the small, medium and large thresholds for %Improve pooled across all outcome domains were approximately 2.5%, 8.0% and 15.0%. However, the present study identified large differences in effect size distributions for both statistics when outcome domains were analysed separately, indicating that context relevant threshold values are important to appropriately interpret the magnitude of change following S&C training. The greatest values were obtained for maximum strength outcomes, followed by similar values for power and jump performance, and finally, substantively smaller values for sprint performance. For maximum strength, the SMDpre small, medium and large thresholds were equal to 0.25 [95%CrI: 0.22 to 0.27], 0.59 [95%CrI: 0.56 to 0.61] and 0.98 [95%CrI: 0.94 to 1.0], respectively. In contrast, expressed as a percentage improvement the thresholds were equal to 6.0% [95%CrI: 5.5 to 6.5], 13.4% [95%CrI: 12.8 to 14.1] and 22.2% [21.6 to 22.9] which are arguably easier to interpret. However, the greatest conceptual difference between the two effect sizes was evident when comparing thresholds between maximum strength and sprint performance. For sprint performance the small, medium and large SMDpre thresholds decreased to 0.07 [95%CrI: 0.04 to 0.10], 0.37 [0.33 to 0.40] and 0.70 [0.66 to 0.74]. These results show that a substantive proportion (~15 to 20%) of the effect size distribution are close to or below zero, whereas the large sprint performance threshold is between the medium and large maximum strength thresholds. In contrast, the percentage improvement thresholds for sprint performance were equal to 0.4% [95%CrI: 0.2 to 0.6], 2.2% [95%CrI: 2.1 to 2.4] and 4.5% [4.2 to 4.8], such that all thresholds were below even the small maximum strength threshold. These observations reflect differences in relationships between means and standard deviations for outcome domains and demonstrate the conceptual difference between effect sizes describing expectations of how participants will change their relative position within a population compared to the magnitude of change relative to starting values.
The potential for restricted sampling of a population to bias standardised effect sizes such as the SMDpre has previously been highlighted (Baguley, Citation2009). If the sample is a truncated sample (missing one or both tails), then the standard deviation is likely to be underestimated such that the SMDpre will be positively biased. This scenario is likely to occur in S&C research where random sampling is uncommon and often convenience samples are used, including recruitment from a single team where participants may be relatively homogenous given similar training experiences. In contrast, sampling only from the tails is likely to overestimate the standard deviation (Baguley, Citation2009) and thereby negatively bias the SMDpre. In S&C, this situation may occur in studies recruiting both males and females where the outcome variable has a large sex stratification. Analysis of the tails of the empirical distribution in the current study highlight the likely role that restricted recruitment practices have played in overestimation of some SMDpre values generating physiologically implausible results (~4 to 11) across all outcome domains. The effect sizes we calculated were from a single training group and were not compared to a non-exercise control, it is therefore possible that the values overestimate the magnitude of change following training due to issues such as placebo and learning effects. Additionally, there are important limitations of pre-post designs compared to those that include a concurrent control (e.g., a standard training regime), and the subsequent comparative effect sizes they generate enabling inference regarding the causal effect of training regimes of interest.
The approach we used enabled more precise estimates of effect sizes and is more robust to overestimation due to sampling practices. One of the primary challenges and biggest criticisms of Bayesian methods has been the selection of appropriate priors (Goodman, Citation1999; Mengersen et al., Citation2016). Where substantive and relevant external information is present, attempts should be made to incorporate this within an informative prior (Mengersen et al., Citation2016). One of the most effective sources of information to build priors to better assess the magnitude of change following future training includes meta-analyses such as that presented here (Jones et al., Citation2018). An additional challenge in the effective use and uptake of Bayesian methods is a lack of formal training and familiarity with approaches (Bernards et al., Citation2017). We have made attempts to address both challenges by firstly, creating priors that are based on a large volume of research focusing on the outcome domains frequently used in S&C research; and secondly, employing a relatively simple Bayesian updating method that can be understood intuitively and facilitated in software that is familiar with both researchers and practitioners. The method adopted expresses both the prior and posterior distribution of the effect size as normal distributions that are familiar and simple to assess suitability by examining stated probabilities. For example, based on the meta-analysis results obtained here, an SMDpre prior with mean 0.62 and standard deviation of 0.53 was developed for maximum strength outcomes. This asserts that the prior probability of obtaining an SMDpre value greater than 0 is = 0.879 (e.g., 1
(
0.62/0.53)), the probability of obtaining an SMDpre value between 0 and 0.5 is
= 0.289 (
((0.5
0.62)/0.53)
(
0.62/0.53))), and the probability of obtaining an SMDpre value greater than 1 is = 0.237 (1
((1
0.62)/0.53)). A researcher and practitioner can decide to alter the mean and standard deviation if they believe the probabilities returned do not match their prior beliefs, which may be the case when considering elite athletes where positive changes are less certain. The values presented here, however, provide useful anchors as they were designed to fit an extensive amount of data collected from S&C training. Similarly, the updating process used to combine prior information with data collected and generate posterior distributions is also easily interpreted. First, the method (Jones et al., Citation2018) updates the posterior mean as a weighted combination of the prior mean and the effect size calculated directly from the training. The weights are determined by the uncertainty in the estimate from the data, and where for example, a small number of participants are investigated, the standard error will be large and therefore greater weight placed on the prior mean. The exact weights used are determined by matching the uncertainty in the new data and the prior, and translating the information contained in the prior to a single trial that can then be updated with the new data (Jones et al., Citation2018).
To demonstrate how potential issues with regard to poor estimates of the standard deviation can be addressed, the example outlined above is continued. If we assume a correlation between the pre- and post-training scores of 0.7 (a requirement to calculate uncertainty in the estimate), then combining the extremely large SMDpre value of 4.2 with the small sample size of n = 8 generates a standard error of 1.41. Based on a frequentist approach, a 95% confidence interval for the effect size would equal 4.2 ± 1.96 1.41 giving a range of 1.4 to 7.0. However, given the small sample size and the large standard error, when updated in a Bayesian framework using the methods presented here and the equations in the statistical analysis section, the posterior mean and standard deviation are shrunk to 1.1 and 0.50, respectively. The effect size is still considered large but is now more plausible and can be interpreted probabilistically given the normal distribution and posterior parameters estimated (e.g., probability of at least a small change:
= 0.955; probability of at least a medium change:
= 0.846; and probability of at least a large change:
= 0.595). Note, if the sample size was much larger, say
= 100, then the directly calculated effect size increases to 4.7 (due to a reduction in the bias offset) with 95% confidence interval giving a range of 4.0 to 5.4, and the posterior mean is only shrunk to 3.5, as there is less uncertainty in the original estimate.
5. Conclusion
To assist practitioners in selecting and developing training using evidence-based practices, it is important that processes and tools are available to compare and appropriately interpret results disseminated in research. Currently, the use of effect size statistics provides the most practical method of ranking and determining which training regimes are most likely to provide a basis for the greatest improvements within a given population. There are multiple effect size statistics that can be used, each with their own strengths and weaknesses. However, regardless of the effect size statistic used, clear patterns emerge when evaluating previous research in S&C including substantive differences in distributions across outcome domains, particularly between maximum strength and sprint performance. Whilst it should be acknowledged that there are limitations in categorising continuous variables, including the generation of different qualitative interpretations of very similar values at the boundaries, the approach is widely used and can provide important insights. Knowledge that different outcome domains can generate large differences in effect size distributions has several important consequences. Firstly, interpretations on the magnitude of change following training can be greatly influenced. For example, using previous non-S&C specific thresholds, researchers and practitioners may interpret training regimes focused on developing sprint performance as being unsuitable when a more complete understanding highlights that these improvements may be comparable with magnitudes of change commonly observed, and therefore the training appropriate to use with a given population. Second, knowledge of effect size distributions has important implications for setting sample size requirements for future research studies. Effect size thresholds are commonly used for power calculations using frequentist methods and suggest that smaller sample sizes may be required for training aimed at developing maximum strength compared with training aimed at developing sprint performance. For example, using the medium effect sizes presented here and a simple one sample t-test with set at 0.05, approximate sample sizes of 21 or 49 would be required for training aimed at developing maximum strength or sprint performance, respectively (Faul et al., Citation2009). It is important to note, effect sizes for comparative studies investigating potential differences between training regimes are likely to be considerably smaller than those presented here and therefore require greater sample sizes. In contrast, sample size approaches using Bayesian methods can be conducted using the prior distributions presented here (Jones et al., Citation2018).
Given the large volume of S&C research and the pace at which it is accelerating, there are potential advantages to incorporating this information within future research to make better estimates, particularly where small sample sizes are common and effect sizes may be low (Mengersen et al., Citation2016). Bayesian methods are well suited to this process, and it is likely that as more disciplines and research in general take advantage of the potential benefits associated with Bayesian frameworks and criticisms of null hypothesis significance testing continues to grow (Wasserstein et al., Citation2019), increased uptake will occur. Valid criticisms of Bayesian frameworks remain and the use of relatively strong priors for contexts where they are not suited are likely to lead to poor inferences and the description of certain training as more effective than they are. To facilitate an increased use of Bayesian methods processes are required to address two of the main challenges which include development of appropriate priors and accessible tools and procedures that are intuitive and can be carried out ideally without need of complex software. The present study has attempted to address these challenges.
Author contributions
PAS and AM designed the research. AM conducted the searches and screening. AM, LG, JP and AH extracted the data. PAS performed all statistical analyses and developed the supplementary file. PAS and AM interpreted the data analysis. PAS and AM wrote the manuscript with critical input from KB, LG, JP, AH, PM and RA. All authors read and approved the final manuscript.
Supplemental Material
Download MS Word (82.5 KB)Disclosure statement
No potential conflict of interest was reported by the authors.
Supplementary material
Supplemental data for this article can be accessed online https://doi.org/10.1080/02640414.2022.2128548.
Additional information
Funding
References
- Baguley, T. (2009). Standardized or simple effect size: What should be reported. British Journal of Psychology, 100(3), 603–617. https://doi.org/10.1348/000712608X377117.
- Bernards, J. R., Sato, K., GGBa, H., & Zyler, C. D. (2017). Current research and statistical practices in sport science and a need for a change. Sports, 5(4), 4. https://doi.org/10.3390/sports5040087
- Bürkner, P. C. (2017). Brms: An R package for Bayesian multilevel models using Stan. Journal of Statistical Software, 80(1), 1–28. https://doi.org/10.18637/jss.v080.i01
- Caldwell, A., & Vigotsky, A. D. (2020). A case against default effect sizes in sport and exercise science. PeerJ, 8, e10314. https://doi.org/10.7717/peerj.10314
- Cohen, J. (1988). Statistical power analysis for the behavioral sciences (2 ed.). Erlbaum.
- Deb, S. K., Brown, D. R., Gough, L. A., Mclellan, C. P., Swinton, P. A., Sparks, A. S., & Mcnaughton, L. R. (2018). Qing the effects of acute hypoxic exposure on exercise performance and capacity: A systematic review and meta-regression. European Journal of Sport Science, 18(2), 243–254. https://doi.org/10.1080/17461391.2017.1410233
- Faul, F., Erdfelder, E., Buchner, A., & Lang, A. G. (2009). Statistical power analyses using G*Power 3.1: Tests for correlation and regression analyses. Behavior Research Methods, 41(4), 1149–1160.https://doi.org/10.3758/BRM.41.4.1149
- Friedrich, J. O., Adhikari, N. K. J., & Beyene, J. (2011). Ratio of means for analyzing continuous outcomes in meta-analysis performed as well as mean difference methods. Journal of Clinical Epidemiology, 64(5), 556–564. https://doi.org/10.1016/j.jclinepi.2010.09.016
- Gelman, A. (2006). Prior distributions for variance parameters in hierarchical models. Bayesian Analysis, 1(3), 515–534. https://doi.org/10.1214/06-BA117A
- Gelman, A., Carlin, J. B., Stern, H. S., & Rubin, D. B. (2014). Bayesian data analysis. Taylor & Francis.
- Goodman, S. N. (1999). Toward evidence-based medical statistics. 2: The Bayes factor. Annals of internal medicine. Annals of Internal Medicine, 130(12), 1005–1013. https://doi.org/10.7326/0003-4819-130-12-199906150-00019
- Hedges, L. V., Gurevitch, J., & Curtis, P. S. (1999). The meta-analysis of response ratios in experimental ecology. Ecology, 80(4), 1150–1156. https://doi.org/10.2307/177062
- Hespanhol, L., Vallio, C. S., Costa, L. M., & Saragiotto, B. T. (2019). Understanding and interpreting confidence and credible intervals around effect estimates. Brazilian Journal of Physical Therapy, 23(4), 290–301. https://doi.org/10.1016/j.bjpt.2018.12.006
- Hox, J. J., Moerbeek, M., Van de Schoot, R., & Analysis, M. (2018). Techniques and applications (3rd ed.). Routledge.
- Jones, H. E., Ades, A. E., Sutton, A. J., & Welton, N. J. (2018). Use of a random effects meta-analysis in the design and analysis of a new clinical trial. Statistics in Medicine, 37(30), 4665–4679. https://doi.org/10.1002/sim.7948
- Kraemer, W. J., Ratamess, N. A., Flanagan, S. D., Shurley, J. P., Todd, J. S., & Todd, T. C. (2017). Understanding the science of resistance training: An evolutionary perspective. Sports Medicine, 47(12), 2415–2435. https://doi.org/10.1007/s40279-017-0779-y
- Kruschke, J. K., & Liddell, T. M. (2018). The Bayesian new statistics: Hypothesis testing, estimation, meta-analysis, and power analysis from a Bayesian perspective. Psychonomic Bulletin and Review, 25(1), 178–206. https://doi.org/10.3758/s13423-016-1221-4
- Lajeunesse, M. J. (2011). On the meta-analysis of response ratios for studies with correlated and multi-group designs. Ecology, 92(11), 2049–2055. https://doi.org/10.2307/23034937
- Lajeunesse, M. J. (2015). Bias and correction for the log response ratio in ecological meta-analysis. Ecology, 96(8), 2056–2063. https://doi.org/10.1890/14-2402.1
- Mengersen, K. L., Drovandi, C. C., Robert, C. P., Pyne, D. B., & Gore, C. J. (2016). Bayesian estimation of small effects in exercise and sports science. Plos One, 11(4), e0147311. https://doi.org/10.1371/journal.pone.0147311
- Morris, S. B., & DeShon, R. P. (2002). Combining effect size estimates in meta-analysis with repeated measures and independent-groups designs. Psychological Methods, 7(1), 105–125. https://doi.org/10.1037/1082-989x.7.1.105
- Peterson, M. D., Rhea, M. R., & Alvar, B. A. (2004). Maximizing strength development in athletes: A meta-analysis to determine the dose-response relationship. The Journal of Strength & Conditioning Research, 18(2), 377–382. https://doi.org/10.1519/R-12842.1
- Peterson, M. D., Rhea, M. R., & Alvar, B. A. (2005). Applications of the dose-response for muscular strength development: Are view of meta-analytic efficacy and reliability for designing training prescription. Journal of Strength & Conditioning Research, 19(4), 950–958. https://doi.org/10.1519/R-16874.1
- Ramirez-Campillo, R., Álvarez, C., García-Hermoso, A., Ramírez-Vélez, R., Gentil, P., Asadi, A., Chaabene, H., Moran, J., Meylan, C., García-de-Alcaraz, A., Sanchez-Sanchez, J., Nakamura, F. Y., Granacher, U., Kraemer, W., & Izquierdo, M. (2018). Methodological characteristics and future directions for plyometric jump training research: A scoping review. Sports Medicine, 48(5), 1059–1081. https://doi.org/10.1007/s40279-018-0870-z
- Rhea, M. R. (2004). Determining the magnitude of treatment effects in strength training research through the use of the effect size. Journal of Strength & Conditioning Research, 18(4), 918–920. https://doi.org/10.1519/14403.1
- Rhea, M. R., & Alderman, B. L. (2004). A meta-analysis of periodized versus nonperiodized strength and power training programs. Research Quarterly for Exercise and Sport, 75(4), 413–422. https://doi.org/10.1080/02701367.2004.10609174
- Rhea, M. R., Alvar, B. A., & Burkett, L. N. (2002). Single versus multiple sets for strength: A meta-analysis to address the controversy. Research Quarterly for Exercise and Sport, 73(4), 485–488. https://doi.org/10.1519/R-12842.1
- Rhea, M. R., Alvar, B. A., Burkett, L. N., & Ball, S. D. (2003). A meta-analysis to determine the dose response for strength development. Medicine & Science in Sports and Exercise, 35(3), 456–464. https://doi.org/10.1249/01.MSS.0000053727.63505.D4
- Steele, J., Fisher, J., & Crawford, D. (2020). Does increasing an athletes’ strength improve sports performance? A critical review with suggestions to help answer this, and other, causal questions in sport science. Journal of Trainology, 9(1), 20–32. https://doi.org/10.17338/trainology.9.1_20
- Suchomel, T. J., Nimphius, S., & Stone, M. H. (2016). The importance of muscular strength in athletic performance. Sports Medicine, 46(10), 1419–1449. https://doi.org/10.1007/s40279-016-0486-0
- Swinton, P. A., Lloyd, R., Keogh, J. W., Agouris, I., & Stewart, A. D. (2014). Regression models of sprint, vertical jump, and change of direction performance. Journal of Strength & Conditioning Research, 28(7), 1839–1848. https://doi.org/10.1007/s40279-016-0486-0
- Verardi, V., & Vermandele, C. (2018). Univariate and multivariate outlier identification for skewed or heavy-tailed distributions. The Stata Journal, 18(3), 517–532. https://doi.org/10.1177/1536867X1801800303
- Wasserstein, R. L., Schirm, A. L., & Lazar, N. A. (2019). Moving to a world beyond “p<0.05”. The American Statistician, 73(S1), 1–19. https://doi.org/10.1080/00031305.2019.1583913
- Weldon, A., Duncan, M. J., Turner, A., Christie, C. J., & Pang, C. M. (2021). Contemporary practices of strength and conditioning coaches in professional cricket. International Journal of Sports Science & Coaching, 16(3), 585–600. https://doi.org/10.1177/1747954120977472
- Weldon, A., Duncan, M. J., Turner, A., Sampaio, J., Noon, M., Wong, D., & Lai, V. W. (2020). Contemporary practices of strength and conditioning coaches in professional soccer. Biology of Sport, 38(3), 377–390. https://doi.org/10.5114/biolsport.2021.99328