
ABSTRACT
The present study examined the agreement and equivalence between two physical activity processing methods. Data were obtained from 161 Hong-Kong adolescents (74 girls, age: 12.6 ± 1.7y). Participants wore an Actigraph GT3XBT on their non-dominant wrist for 7d. Time spent sedentary, and in light-(LPA), moderate-(MPA), vigorous-(VPA), and moderate-to-vigorous physical activity (MVPA) were calculated using different processing methods (proprietary counts and Euclidean Norm Minus One (ENMO)). Intraclass correlation coefficients (ICC) were used to examine absolute agreement (ICC2) and consistency (ICC3), and equivalence was assessed using pairwise equivalence tests. Using ENMO, sedentary time and VPA were higher, whereas all other behaviours were lower (compared to counts processing). Agreement ranged from poor (ICC2:0.42(Sedentary)) to moderate (ICC2:0.86(LPA)) and consistency ranged from moderate (ICC3:0.71(sedentary)) to good (ICC3:0.91(LPA)). Methods were not considered equivalent (all p > 0.05). Due to differences in the wear-time validation of processing methods, a sensitivity analyses (sub-sample with the same valid wear time for both methods (n = 56)), resulted in minimal change. Lack of agreement and equivalence between ENMO and counts processing methods suggests that the processing method significantly affects youth physical activity estimates.
1. Introduction
The assessment of free-living physical activity is an increasingly important pursuit for the area of public health, given that the promotion of physical activity is a primary preventative measure for health-related diseases (Bull et al., Citation2020) and mental health conditions (Biddle & Asare, Citation2011). Advances in technology and the emergence of accelerometers has enabled the objective, and more accurate, classification of physical activity (Cain et al., Citation2013). Indeed, there have been stark increases in the number of published studies measuring physical activity using accelerometers in the last ~15 years (Troiano et al., Citation2015), as well as accelerometer-derived physical activity measurement being at the forefront of large cohort studies (e.g., Katzmarzyk et al., Citation2015).
There are numerous research-grade accelerometers in use (such as Actigraph, GENEActiv and Axivity) to collect information about habitual physical activity patterns. Actigraph devices are typically the most common, recording triaxial acceleration data and using proprietary algorithms to process the accelerations into the typical activity measurement unit of “counts”. The combination of proprietary algorithms, the wide range of activity thresholds available and the variation in post-processing decisions makes it difficult to compare fairly across different protocols and research studies (Cain et al., Citation2013; Migueles et al., Citation2017; Rowlands et al., Citation2019). Furthermore, the classification of a sample meeting the recommended daily physical activity guidelines was shown to range from 8% to 96%, depending on the cut-points used (Migueleset al., Citation2019). This is an alarming finding with severe consequences for the classification of cohorts meeting physical activity guidelines – which is usually the primary focus of such studies. There have been recent calls for the adoption of standardised processes within the area of device-measured physical activity measurement (Cain et al., Citation2013; Migueles et al., Citation2017). One attempt towards achieving this has been the development of open-source software (GGIR) that generates physical activity outcomes from the raw acceleration data corrected for gravity – termed the Euclidean Norm Minus One (ENMO; Citation2019). As well as providing a standardised platform to process raw accelerometery data, GGIR offers a transparent approach using the freely available software R and has shown very good agreement for activity behaviour estimates between accelerometer brands when using ENMO processing (Rowlands et al., Citation2017, Citation2016).
In recent years, researchers have sought to generate activity thresholds for ENMO data, to help categorise the signal into understandable behaviours of time use (e.g., sedentary time, light, moderate, vigorous and moderate-to-vigorous physical activity). Predominantly, it is the lab-based thresholds developed by Hildebrand et al. (Citation2014), (Citation2017) that are often used, as well as the recently developed thresholds for estimating sedentary behaviour and light physical activity (Hurter et al., Citation2018). Although it is argued that categorisation of activity behaviour through activity cut-points is part of the problem (Rowlands et al., Citation2019), it stands to reason that those developed using ENMO may be more appropriate, given the fewer degrees of freedom encountered compared to the counts-based methods (Migueles, Cadenas et al., Citation2019)). However, given these newer developments it is crucial to ascertain the level of agreement and equivalence of estimated time spent in behavioural classifications utilising the different processing methods.
Many studies have compared the differences in estimates of physical activity behaviours between ENMO and counts-based processing methods, demonstrating considerable differences (Fairclough et al., Citation2016; Kim et al., Citation2017; Leppänen et al., Citation2022, Citation2020). Fairclough et al. (Citation2016) showed that for hip-worn accelerometer data in children (aged 9–10 y), estimates of moderate-to-vigorous physical activity were higher from counts processing (72 min) compared to ENMO processing (50 min). Additionally, Kim et al. (Citation2017), using wrist-worn accelerometer data in a broad sample of adolescents (12–17 y), also showed that estimates of moderate-to-vigorous physical activity were lower from ENMO processing (11 min) when compared to counts processing using Chandler et al. (Citation2016) cut-points (67 min) and Crouter et al. (Citation2013) cut-points (126 min).
The differences between processing methods for estimates of physical behaviours was also shown to result in different associations with body mass index (Leppänen et al., Citation2020 &, Citation2022), waist circumference (Leppänen et al., Citation2022) and cardiorespiratory fitness (Leppänen et al., Citation2020). Whilst these studies demonstrate that differences in estimates of activity classification between processing methods – both for hip- and wrist-worn accelerometers in children and adolescents – this does not provide any indication or quantify the extent of agreement or equivalence between the methods. Indeed, appropriate summaries of these data, rather than mean differences, are preferred to facilitate appropriate conclusions about the comparability of measurement methods (Dixon et al., Citation2018; Looney, Citation2018).
Advancing on these limitations, Boddy et al. (Citation2018) compared the estimates of sedentary time between ENMO and counts processing methods, in a sample of children (aged 10–11 y), from hip- and wrist-worn accelerometers. Although estimates between processing methods displayed fair-to-moderate agreement, the sedentary time using ENMO processing thresholds from Hildebrand et al. (Citation2017) was not considered statistically equivalent (within an equivalence region of ± 10%) – with respect to the estimated sedentary time from counts processing (using thresholds from Trost et al. (Citation2011)). Buchan and McLellan (Citation2019) compared moderate-to-vigorous intensity physical activity (in children aged 9–10 y) measured by hip-worn accelerometers between ENMO (using Hildebrand et al. (Citation2014)) and counts (using Romanzini et al. (Citation2014) & Hänggi et al., Citation2013)) processing methods, revealing that ENMO and counts estimates could not be considered statistically equivalent within a ± 10% equivalence region (Buchan & McLellan, Citation2019). Moreover, there was a large mean bias and wide limits of agreement (LoA) (bias: −57 min, LoA: −101 to – 13 min) for estimated moderate-to-vigorous physical activity from ENMO processing when compared to counts processing (Buchan & McLellan, Citation2019). Despite the inclusion of appropriate analyses to address these issues, these previous studies have only focused on particular activity behaviours, rather than the whole spectrum, in younger children (9–11 y; Boddy et al., Citation2018; Buchan & McLellan, Citation2019).
Although recent work has utilised appropriate analyses to quantify the degree of equivalence and agreement between methods (Boddy et al., Citation2018; Buchan & McLellan, Citation2019), only certain aspects of physical activity behaviour were examined (e.g., only sedentary behaviour), rather than examining the whole spectrum of typical behaviour categories which is usually of interest to the physical activity researcher. Moreover, these studies used an arbitrary zone of equivalence (±10%), which may not be appropriate for all of the activity behaviours and does not provide information on the minimum required zone of equivalence (O’Brien, Citation2021). Furthermore, the focus in these studies has been in young children (aged 9–10 y), with only Kim et al. (Citation2017) utilising a sample of adolescents aged 12–17 y; although the extent of agreement and equivalence between estimates was not examined, and only between-methods differences were considered. Therefore, the purpose of this study is to evaluate the agreement, equivalence and consistency of free-living physical activity (sedentary time; light, moderate and vigorous physical activity) estimates derived from ENMO- and counts-based processing methods wrist-worn accelerometery, in older (14–15 y) adolescents.
2. Materials and methods
2.1 Participants
Initially, 211 adolescents volunteered to take part in Hong Kong. Parental consent and participant assent were obtained before enrolment into the study. A health screen was completed by each participant’s parent/guardian and was checked by a lead investigator to ensure there were no medical conditions that would affect participation in the study. Stature was measured to the nearest 0.1 cm using with a Leicester Height Measure (Seca, Hamburg, Germany) and body mass was measured to the nearest 0.1 kg with a Seca 770 digital scale (Seca, Hamburg, Germany). The study conformed to the Declaration of Helsinki guidelines and was approved by the respective Institutional Human Ethics Committee’s.
2.2 Assessment of physical activity
Participants wore a wrist-mounted accelerometer (Actigraph GT3XBT, Actigraph, Pensacola, FL, USA), which was set to capture data at 30 Hz. The accelerometer was worn on the non-dominant wrist. Participants were fitted with the accelerometer to ensure it was appropriately fitted. Participants were handed a diagram upon leaving, depicting how the accelerometer should be worn to ensure further compliance. Participants were instructed to wear the accelerometer at all times (i.e. 24 hours a day) over the following 7 d period, except for any water-based activities, such as bathing, swimming, based on previous recommendations (Migueles et al., Citation2017; Tudor-Locke et al., Citation2015).
2.3 Data processing
After the devices were returned, the data were downloaded using Actilife v6.13.4 (Actigraph, Pensacola, FL, USA) and saved in raw format as GT3X+ filetypes. The raw files were converted to .csv files for ENMO data processing and to AGD format for the counts processing (5 s epochs). This epoch was selected to satisfy analysis requirements for the associated cut-points, which were derived from these specific epochs (Migueles et al., Citation2017). To enable comparisons between ENMO and counts methods, sleep periods were removed during the data processing steps (11:00 pm to 06:00 am). Finally, only those participants meeting the wear time criteria for both methods (specified below) were maintained for subsequent analysis.
2.3.1 ENMO Processing
The raw (.csv) files were processed in RStudio v 1.2.1335 (Rstudio Team., Citation2020), using the open-source GGIR package v2.0–0. This package has been developed to allow the processing and analysis of raw acceleration files (Migueles, Cadenas et al., Citation2019; Van Hees et al., Citation2014). Initially, GGIR auto calibrates the raw triaxial signals into a single, omnidirectional measure of acceleration (Euclidean norm minus one (ENMO)); which accounts for the effect of gravity (subtracts 1 g) and rounds negative values to zero (Van Hees et al., Citation2014). The ENMO was calculated over 5 s epochs and expressed in mg. Following this, valid wear times were estimated using the built-in wear time validation protocol, calculated over 60 min windows with 15 min moving increments (Van Hees et al., Citation2013). Data were considered valid if there was at least 4 days (1 weekend day) with at least 10 hours of wear time per day. Data were removed prior to analysis if the post calibration error was greater than 0.01 g (Migueles, Cadenas et al., Citation2019).
2.3.2 Counts processing
The counts files (GT3X+) were processed in Actilife (v6.13.4), with non-wear time identified using the algorithm of Choi et al. (Citation2012) and then removed from the files prior to analyses (Buchan & McLellan, Citation2019; Migueles et al., Citation2017). Data were considered valid if there was at least 4 days (1 weekend day) with at least 10 hours wear time per day.
2.3.3 Activity classification
Device, population and location specific thresholds for ENMO were used to determine the estimated time spent in different activity behaviours. A summary of these thresholds can be found in .
Table 1. The site-specific thresholds used to determine activity classification for ENMO- and counts-based processing methods. These are the recommended thresholds to be used in adolescents (Migueles et al., Citation2017) .
There are many sets of thresholds to choose from when processing the counts data, but for the purposes of comparison the most popular and recommended adolescent-specific thresholds are used (Migueles et al., Citation2017). The wrist-based thresholds for counts data are those proposed by Chandler et al., Citation2016) using the vector magnitude of 5 s epoch data ().
2.4 Statistical analysis
Equivalence tests were conducted in Minitab v19. As the absence of a statistically significant difference between methods does not necessarily mean that they can be deemed equivalent, nor agree (Dixon et al., Citation2018; Lakens, Citation2017; Looney, Citation2018), a paired equivalence testing approach was used (Dixon et al., Citation2018). This method tests the hypothesis that the differences between two methods and the associated 90% CI are within a zone of equivalence, and thus considered similar to a difference of zero. Pairwise equivalence tests were used in the present study, using the two one-sided tests (TOST) method, to examine if the ratio of log transformed means between methods and their associated 90% CI, for estimated time in each activity, was within the specified equivalence region (Dixon et al., Citation2018; Lakens, Citation2017). Based on previous work in the field, the equivalence region was set as ± 10% (Boddy et al., Citation2018; Buchan & McLellan, Citation2019). In addition to the use of this arbitrary value, further equivalence analyses were conducted to identify the minimum required equivalence zone when comparing ENMO to counts processing, which was also expressed as a proportion of the standard deviation for counts processing (O’Brien, Citation2021).
An intraclass correlation coefficient (two-way mixed, absolute agreement, single measures; ICC2) was used to determine the absolute agreement between the two methods (Liljequist et al., Citation2019). For clarity, absolute agreement concerns the absolute scores assigned to participants by different methods, and whether they could be used interchangeably.
A second iteration of the intraclass correlation coefficient (two-way mixed, consistency, single measures; ICC3) was used to determine the consistency between the two methods (Liljequist et al., Citation2019); consistency ignores differences between means and represents how well the ranks of scores match between methods. The following criteria were used to qualitatively assess the ICC’s; < 0.5 (poor), 0.5–0.75 (moderate), 0.75–0.9 (good), > 0.9 (excellent; Koo & Li, Citation2016). Furthermore, the presence of a greater ICC3 relative to ICC2 provides evidence of a systematic bias. The ICC’s were calculated using RStudio.
The mean bias and limits of agreement, along with Bland-Altman plots, were calculated to assess agreement at the individual level between processing methods for the estimation of time in each activity (Altman & Bland, Citation1983; Bland & Altman, Citation1999), using the “blandr” (v 0.5.1) package in R (Datta, Citation2017). If the Bland-Altman plots displayed evidence of proportional bias, data were log transformed for the calculation of bias and limits of agreement. The antilog of these values was then reported as percentages (Bland & Altman, Citation1999). The use of these measures satisfies the recommended criteria for presenting a scaled, unscaled, and visual representation of agreement for method comparisons (Looney, Citation2018). All descriptive data are presented as mean ± SD, unless otherwise stated.
Due to the differences in wear-time validation between processing methods, there was a substantial difference in the available valid wear time. This may contribute to the discrepancies in activity classification seen between the two methods. Therefore, sensitivity analyses were performed using data available from those participants with the maximum amount of valid wear time between 6 am and 11 pm (1020 min [17 h]), resulting in a sample of 56 participants.
3. Results
After data processing a total of 50 participants were removed (43 due to insufficient wear time, 7 due to calibration errors higher than accepted during GGIR processing) which resulted in a total sample of 161 adolescents. The sample consisted of 74 girls and 84 boys; age: 12.6 ± 1.7 y, height: 1.55 ± 0.11 m, body mass: 46.8 ± 13.0 kg, waist circumference: 67.7 ± 9.7 cm.
The average percentage of wear time, per the data collection protocol, was 90.4 ± 13.6% and 94.0 ± 10.0% for counts and ENMO processing, respectively. The average amount of valid wear time, per 24 h recording period, was 16.2 ± 1.1 h and 16.5 ± 0.8 h for counts and ENMO processing, respectively. The average number of valid days, across the wear period, was 5.8 ± 0.5 days and 5.6 ± 0.6 days for counts and ENMO processing, respectively.
3.1 Analysis of the full sample
Absolute agreement between methods was poor-to-moderate for sedentary time and moderate physical activity, poor-to-good for moderate-to-vigorous physical activity, moderate-to-excellent for light physical activity and excellent for vigorous physical activity (). Consistency between methods was moderate-to-good for sedentary time, moderate physical activity, and moderate-to-vigorous physical activity, good-to-excellent for light physical activity and excellent for vigorous physical activity (). Bland-Altman plots visualising the mean bias and limits of agreement between methods, for each behavioural activity, can be seen in . The point estimates for mean bias, as well as the upper and lower limits of agreement, along with their 95% CI can be found in . There was a greater estimation of sedentary time and vigorous physical activity, and a lower estimation of light, moderate and moderate-to-vigorous physical activity, from ENMO processing compared to counts.
Figure 1. Bland-Altman plots to represent agreement between the two methods, with counts processing as the reference, for sedentary time (A), light (B), moderate (C) and vigorous (D) physical activity during wrist-worn accelerometery in the full sample (n = 161). Solid lines represent the mean bias and dashed lines represent the 95% limits of agreement. The numerical values for the bias and limits of agreement are also presented. In panels C & D, the log transformed values are presented with the antilog percentages presented in parentheses.
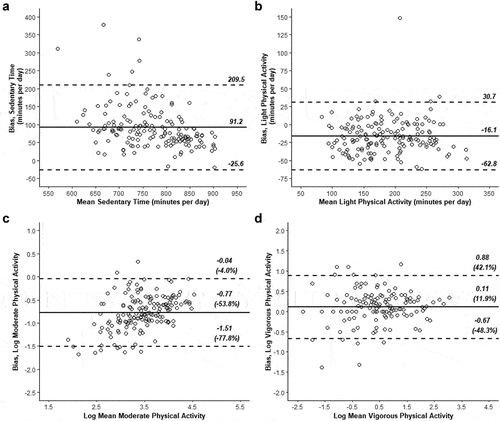
Table 2. Summary of absolute agreement, consistency and equivalence between estimated time spent in each behavioural activity using the different processing methods for wrist-worn accelerometery (n = 161) .
Results from the paired equivalence tests between the ENMO and counts processing methods for estimated sedentary time (ENMO/Counts; p = 1.000. Counts/ENMO; p = 0.996), light (ENMO/Counts; p = 0.223. Counts/ENMO; p = 0.550), moderate (ENMO/Counts; p = 1.000. Counts/ENMO; p = 1.000), vigorous (ENMO/Counts; p = 0.880. Counts/ENMO; p = 0.811) and moderate-to-vigorous physical activity (ENMO/Counts; p = 1.000. Counts/ENMO; p = 1.000) suggest that equivalence between methods cannot be claimed. A graphical representation can be seen in , whereby the ratio of means and their respective 90% confidence intervals do not fully sit within the equivalence region (± 10%). These results were identical with both methods respectively used as the reference. Further equivalence analyses found that ENMO was considered equivalent to counts processing for the following equivalence zones; sedentary time (14.5%; 1.18 SD), light- (13%; 0.46 SD), moderate- (65%; 1.25 SD), vigorous- (43%; 0.31 SD) and moderate-to-vigorous physical activity (53%; 1.15 SD; ).
Figure 2. A visual display of the paired equivalence testing for wrist-worn accelerometery (n = 161). Each row shows the ratio of the log transformed means for estimated time in each activity classification produced by the different processing methods. (A) Ratios when counts processing is used as the “reference”. (B) Ratios when ENMO processing is used as the “reference”. The ratios are presented with ± 90% CI’s. The shaded area represents the ± 10% zone of equivalence. In order to be equivalent, the ratio and CI’s should sit within the equivalence region.
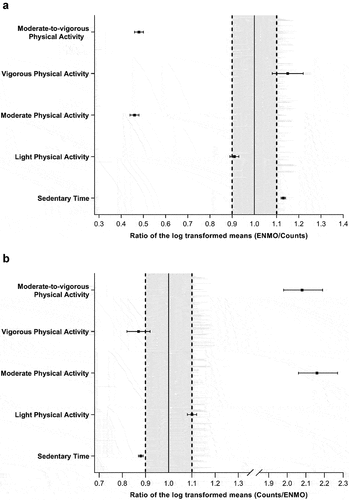
Table 3. The 90% confidence interval (ENMO processing) and the minimum required zone of equivalence (counts processing) required to conclude equivalence for each activity behaviour, when considering counts processing as the reference. The equivalence zone is also expressed as proportion of the standard deviation for each activity estimate from counts processing. Data are for the full sample (n = 161) .
The rank order of estimated daily moderate-to-vigorous physical activity was strongly correlated between methods (r = 0.811, p < 0.001). However, the proportion of adolescents meeting the 60 min·day−1 of moderate-to-vigorous physical activity guidelines was 34.2% of the sample (55/161) for counts processing and 6.2% (10/161) for ENMO processing.
3.2 Sensitivity analyses; reduced sample with equal wear time
Absolute agreement between methods was poor-to-good for sedentary time, moderate and moderate-to-vigorous physical activity, poor-to-excellent for light physical activity and excellent for vigorous physical activity (Supplementary Table; S1). Consistency between methods was moderate-to-good for moderate and moderate-to-vigorous physical activity, and excellent for sedentary time, light, and vigorous physical activity (Supplementary Figure; S2). Bland-Altman plots visualising the mean bias and limits of agreement between methods, for each behavioural activity, can be seen in Supplementary Figure; S3. The point estimates for mean bias, as well as the upper and lower limits of agreement, along with their 95% CI can be found in Supplementary Table; S1. There was a greater estimation of sedentary time and vigorous physical activity, and a lower estimation of light, moderate and moderate-to-vigorous physical activity, from ENMO processing compared to counts.
Results from the paired equivalence tests between the ENMO and counts processing methods for estimated light (ENMO/Counts; p = 0.977. Counts/ENMO; p = 0.994), moderate (ENMO/Counts; p = 1.000. Counts/ENMO; p = 1.000), vigorous (ENMO/Counts; p = 0.598. Counts/ENMO; p = 0.537) and moderate-to-vigorous physical activity (ENMO/Counts; p = 1.000. Counts/ENMO; p = 1.000) suggest that equivalence between methods cannot be claimed. However, the paired equivalence tests for estimated sedentary time provided evidence to claim equivalence, within a ± 10% region, between the two methods (ENMO/Counts; p < 0.001. Counts/ENMO; p < 0.001). A graphical representation can be seen in Supplementary Figure; S4. Further equivalence analyses found that ENMO was considered equivalent to counts processing for the following equivalence zones; sedentary time (8.8%; 0.78 SD), light- (16.5%; 0.60 SD), moderate- (56%; 1.15 SD), vigorous- (40%; 0.30 SD) and moderate-to-vigorous physical activity (54%; 1.07 SD) (Supplementary table – S2).
The proportion of adolescents meeting the 60 min·day−1 of moderate-to-vigorous physical activity guidelines was 42.9% of the sample (24/56) for counts processing and 12.5% (7/56) for ENMO processing. Despite this discrepancy, the rank order of estimated daily moderate-to-vigorous physical activity was strongly correlated between methods (r = 0.874, p < 0.001).
4. Discussion
The present study presents a novel and collective investigation on the agreement, consistency and equivalence between ENMO and counts processing methods of wrist-worn accelerometery data in an adolescent population. The main findings show that large systematic bias and wide limits of agreement exist for estimates of all physical activity behaviours. Additionally, the processing methods displayed poor-to-moderate agreement (sedentary time, MPA and MVPA), moderate-to-excellent agreement (LPA) and excellent agreement (VPA). Furthermore, the estimates between processing methods could not be considered equivalent with one another when using the arbitrary equivalence zone of ±10%. The present study also provides estimates of the minimum required zone of equivalence for each activity behaviour. Sensitivity analyses (performed on data with an equal amount of valid wear time within both methods; n = 56) did not really change the outcomes, though methods were deemed equivalent for the estimation of sedentary time. These data suggest that large disparities in physical activity estimation exist between processing methods, which makes comparisons of youth physical activity utilising these different methods extremely difficult and data should be interpreted with this in mind.
The present study is the first to examine the comparability of processing methods across the typical range of physical activity behaviours in the same sample, with previous studies only focusing on sedentary time and light physical activity (Boddy et al., Citation2018) or moderate-to-vigorous physical activity (Buchan & McLellan, Citation2019). The present study examined estimates from wrist-worn accelerometers, comparing the ENMO processing thresholds of Hildebrand et al. (Citation2017) to counts thresholds of Chandler et al., Citation2016). These data show much more estimated sedentary time (bias; 91.2 min, limits of agreement; −25.6 min to 209.5 min) utilising the ENMO processing approach. These large discrepancies were accompanied by poor-to-moderate agreement (ICC2; 0.42), moderate-to-good consistency (ICC3; 0.71) and a lack of equivalence at the ± 10% level (actual equivalence zone required: 14.5%). These findings are consonant with those of Boddy et al. (Citation2018), who also compared wrist-worn estimates of sedentary time and light physical activity, although these were measured in UK children (aged 10–11 y). However, it should be noted that whilst the counts processing method was used as the “reference” in calculating bias it is not a criterion-standard method. Whether ENMO processing overestimates, or is closer to the truth, is unknown. The present study does however highlight large variations between the ENMO and counts processing approaches wrist-worn accelerometers when estimating sedentary time.
In the present study, estimates of moderate and vigorous physical activity were consistently lower using ENMO processing compared to counts processing and were not considered equivalent of one another at the ±10% level (actual equivalence zone required: MPA = 65%, VPA = 43%, MVPA = 53%). The present study is the first to report this for wrist worn accelerometers in older adolescents, with findings consistent to previous hip-worn data of Buchan and McLellan (Citation2019). The magnitude of bias for moderate physical activity in the present study (−25 min) was lower than data in older children (9–11 y; −59 min; Buchan & McLellan, Citation2019) and higher than young children (4–6 y; −18 min; Leppänen et al., Citation2022). There are numerous reasons for the between study differences, such as; natural sampling variability, selection of cut-points, participant demographics. Another important between-study characteristic that could explain these differences is the accelerometer wear location. Nonetheless, collectively these data show that estimates of moderate and vigorous physical activity are not comparable between ENMO and counts processing methods, with generally lower estimates from ENMO compared to counts.
The present study also examined the proportion of the sample meeting the recommended daily moderate-to-vigorous physical activity guidelines of 60 min·day−1 and found that ENMO processing results in the lowest estimates of those meeting the guidelines; supporting previous observations (Buchan & McLellan, Citation2019; Kim et al., Citation2017; Migueles, Cadenas et al., Citation2019). This is of importance, given that moderate-to-vigorous physical activity is of particular focus in physical activity surveillance and promotion (Bull et al., Citation2020). However, the lower estimates from the ENMO metric do not necessarily mean it is an underestimation of moderate-to-vigorous physical activity. To the authors knowledge no study to date has examined the amount of estimated moderate-to-vigorous physical activity, from ENMO and other counts processing thresholds, in concordance with a reference criterion (i.e. measured energy expenditure); which would provide further insight into the issue. Additionally, although there is strong evidence to support the focus on moderate-to-vigorous physical activity (Bull et al., Citation2020), some data suggest that light physical activity is also beneficial for cardiometabolic health (Barker et al., Citation2018; Carson et al., Citation2013) and therefore the whole spectrum of physical activity intensities should be considered.
The present study is the first to examine the agreement and equivalence between light physical activity estimates derived from ENMO and counts processing methods. ENMO processing resulted in a negative bias (−16.1 min) with limits of agreement ranging from −62.8 min to 30.7 min, good absolute agreement (ICC2; 0.86 [0.66–0.93]) and good-to-excellent consistency (ICC; 0.91 [0.87–0.93]) between methods. Although the methods were not statistically equivalent (at the ±10% level), the ratio of the log-transformed means for light physical activity was nearly within the equivalence region. Further analyses revealed that the minimum required zone of equivalence was 13%. These data are much different to those of Leppänen et al. (Citation2022) who found a mean difference of −186 min and wide limits of agreement, though these data were collected in young children (4–6 y) using hip-worn accelerometers. Nonetheless, given the wide limits of agreement and lack of equivalence, it appears that estimates of light physical activity from ENMO and counts processing are not comparable for wrist-worn accelerometery.
Due to the divergent wear-time validation algorithms between processing methods, there were differences in the available amount of valid time for scoring. This may potentially be a cause of the disparities in estimated physical behaviours between methods. In light of this, sensitivity analyses were performed in the present study by selecting a sub-sample of participants that had the maximum amount of available wear time between pre-specified times (6 am – 11 pm), resulting in 56 participants. For estimates of light and moderate-to-vigorous physical activity, the sensitivity analyses led to similar conclusions as the full sample, despite removing the impact of differing wear times. Interestingly, the sensitivity analyses demonstrated a reduced bias (full sample: 91.2 min, sub-sample: 53.7 min) for estimated sedentary time between ENMO and counts processing methods, improved the measures of agreement and consistency (upplementary Table; S1) and was considered statistically equivalent, with an equivalence region set at ±10% of the alternate method (Supplementay Figure; S4). Of course, given the large portion of time that is usually spent sedentary, 10% will provide a sizeable window of equivalence. The present study found that in the sensitivity analyses, the minimum required zone of equivalence was 8.8%, which may highlight the need to consider more stringent equivalence regions for estimates with larger magnitudes (O’Brien, Citation2021). Overall, the present data demonstrate that estimates of physical activity behaviour between processing methods are not comparable nor equivalent, and generally lack agreement, even when the impact of different wear times is removed.
Although commonplace in physical activity research, it is argued that categorising accelerations (i.e. “light activity”) may be part of the problem when assessing device-measured physical activity behaviour (Rowlands et al., Citation2019). Indeed, the cut-points used to classify activity behaviours are sample and protocol specific, thereby reducing ability to appropriately characterise free-living physical activity across a range of activities (Trost, Citation2020). The findings of the present study, and previous work (Boddy et al., Citation2018; Buchan & McLellan, Citation2019; Leppänen et al., Citation2022), highlight the difficulties in comparing physical activity behaviours when different processing methods have been used. Recent suggestions advocate that the whole physical activity spectra should be considered in analyses (Aadland et al., Citation2018, Citation2021; Rowlands, Citation2018; Rowlands et al., Citation2018), or analytical procedures that can handle the co-dependence of physical activity behaviours should be used (Aadland et al., Citation2021; Migueles et al., Citation2021). One suggestion is to use simple, continuous metrics that encapsulate physical activity volume (average acceleration) and the intensity distribution of the physical activity profile (intensity gradient) over a 24 h period (Rowlands et al., Citation2018). Such metrics can be freely and transparently derived with raw processing, via GGIR (Migueles, Cadenas et al., Citation2019; Rowlands et al., Citation2018) and avoids the reliance on cut-points (Trost, Citation2020). Furthermore, these outcomes are derived from raw accelerations, and do not depend on proprietary algorithms, therefore removing the barrier of different device use (Rowlands et al., Citation2017, Citation2016).
Some strengths of the present study to be considered are the choice of activity thresholds and the processing steps followed, which were done so based on the recommendations provided (Migueles et al., Citation2017), to replicate the most common approach in physical activity research. Moreover, the present study used a range of appropriate measures to assess the agreement and equivalence between the processing method, rather than just testing for statistical differences via null-hypothesis significance testing (Dixon et al., Citation2018; Looney, Citation2018). The present study also identified the minimum required zone of equivalence for each activity behaviour, which was also expressed as a proportion of the SD for the measure, to provide further insight and aid further comparisons and synthesis of study findings (O’Brien, Citation2021). Finally, the present study used a broad sample of older adolescents (12–15 y), building upon the previous work that has considered younger children (Boddy et al., Citation2018; Buchan & McLellan, Citation2019).
The present study is not without limitations. Although the counts processing method is seen as the traditional method, it cannot be considered the gold standard and no criterion measure was used in the present study to aid valid comparisons. Furthermore, the present study only considered one set of activity thresholds for counts processing, when there are many available (Migueles et al., Citation2017). However, as previously mentioned, this set of cut-points were used as they are the placement and population specific ones recommended for physical activity research (Migueles et al., Citation2017). Finally, the sampling frequency used (30 Hz) is lower than optimal, but it is still suggested as a reasonable sampling frequency (Migueles et al., Citation2017) with some evidence suggesting good agreement between different sampling frequencies – especially at the wrist (Clevenger et al., Citation2020). Nonetheless, the sampling frequency used in the present study should be considered when comparisons are made with other studies.
Overall, the present study demonstrates that there is poor agreement and lack of equivalence (at the commonly used ±10% level) between estimates of physical activity behaviour when using ENMO and counts processing methods wrist-worn accelerometers in adolescents from Hong Kong. The minimum required zone of equivalence ranged from 13 to 65% across the activity behaviours, demonstrating the incompatibility of processing methods and the need to consider individual equivalence zones for each behaviour. Although processing using the ENMO method (via GGIR) removes barriers related to accelerometer brands, the focus on activity behaviours may not be suitable. To improve data harmonisation, comparability across studies and transparency in physical activity research, other metrics that capture the whole activity profile may provide a solution.
Data availability
Data are available from the corresponding author upon request.
Supplemental Material
Download MS Word (2.4 MB)Acknowledgments
The authors would like to express thanks to the participants that took part in the study, as well as the teachers at the liaising schools that helped with recruitment.
Supplementary material
Supplemental data for this article can be accessed online https://doi.org/10.1080/02640414.2023.2167254
Disclosure statement
The authors report there are no competing interests to declare.
Correction Statement
This article has been republished with minor changes. These changes do not impact the academic content of the article.
Additional information
Funding
References
- Aadland, E., Kvalheim, O. M., Anderssen, S. A., Resaland, G., & Andersen, L. B. (2018). The multivariate physical activity signature associated with metabolic health in children. International Journal of Behavioral Nutrition and Physical Activity, 15(1), 77. https://doi.org/10.1186/s12966-018-0707-z
- Aadland, E., Nilsen, A. K., Andersen, L. B., Rowlands, A. V., & Kvalheim, O. M. (2021). A comparison of analytical approaches to investigate associations for accelerometry-derived physical. Journal of Sports Sciences, 39(4), 10. https://doi.org/10.1080/02640414.2020.1824341
- Altman, D. G., & Bland, J. M. (1983). Measurement in medicine: The analysis of method comparison studies. Journal of the Royal Statistical Society, 32(3), 11. https://doi.org/10.2307/2987937
- Barker, A. R., Gracia-Marco, L., Ruiz, J. R., Castillo, M. J., Aparicio-Ugarriza, R., González-Gross, M., Kafatos, A., Androutsos, O., Polito, A., Molnar, D., Widhalm, K., & Moreno, L. A. (2018). Physical activity, sedentary time, TV viewing, physical fitness and cardiovascular disease risk in adolescents: The HELENA study. International Journal of Cardiology, 254, 7. https://doi.org/10.1016/j.ijcard.2017.11.080
- Biddle, S., & Asare, M. (2011). Physical activity and mental health in children and adolescents: A review of reviews. British Journal of Sports Medicine, 45(11), 886–895. https://doi.org/10.1136/bjsports-2011-090185
- Bland, J. M., & Altman, D. G. (1999). Measuring agreement in method comparison studies. Statistical Methods in Medical Research, 8(2), 27. https://doi.org/10.1177/096228029900800204
- Boddy, L. M., Noonan, R., Kim, Y., Rowlands, A. V., Welk, G. J., Knowles, Z. R., & Fairclough, S. J. (2018). Comparability of children’s sedentary time estimates derived from wrist worn GENEActiv and Hip worn ActiGraph accelerometer thresholds. Journal of Science and Medicine in Sport, 21(10), 16. https://doi.org/10.1016/j.jsams.2018.03.015
- Buchan, D. S., & McLellan, G. (2019). Comparing physical activity estimates in children from hip-worn actigraph GT3X+ accelerometers using raw and counts based processing methods. Journal of Sports Sciences, 37(7), 10. https://doi.org/10.1080/02640414.2018.1527198
- Bull, F. C., Al-Ansari, S. S., Biddle, S., Borodulin, K., Buman, M. P., Cardon, G., Carty, C., Chaput, J.-P., Chastin, S., Chou, R., Dempsey, P. C., DiPietro, L., Ekelund, U., Firth, J., Friedenreich, C. M., Garcia, L., Gichu, M., Jago, R., Katzmarzyk, P. T., … Willumsen, J. F. (2020). World health organization 2020 guidelines on physical activity and sedentary behaviour. British Journal of Sports Medicine, 54(24), 1451. https://doi.org/10.1136/bjsports-2020-102955
- Cain, K. L., Sallis, J. F., Conway, T. L., Dyck, D. V., & Calhoon, L. (2013). Using accelerometers in youth physical activity studies: A review of methods. Journal of Physical Activity & Health, 10(3), 14. https://doi.org/10.1123/jpah.10.3.437
- Carson, V., Ridgers, N. D., Howard, B. J., Winkler, E. A. H., Healy, G. N., Owen, N., Dunstan, D. W., Salmon, J., & Kiechl, S. (2013). Light-intensity physical activity and cardiometabolic biomarkers in US adolescents. PloS One, 8(8), 7. https://doi.org/10.1371/journal.pone.0071417
- Chandler, J. L., Brazendale, K., Beets, M. W., & Mealing, B. A. (2016). Classification of physical activity intensities using a wristworn accelerometer in 8-12 year old children. Pediatric Obesity, 11(2), 8. https://doi.org/10.1111/ijpo.12033
- Choi, L., Ward, S. C., Schnelle, J. F., & Buchowski, M. S. (2012). Assessment of wear/nonwear time classification algorithms for triaxial accelerometer. Medicine and Science in Sports and Exercise, 44(10), 17. https://doi.org/10.1249/MSS.0b013e318258cb36
- Clevenger, K. A., Pfeiffer, K. A., & Montoye, A. H. (2020). Cross-generational comparability of raw and count-based metrics from ActiGraph GT9X and wGT3X-BT accelerometers during free-living in youth. Measurement in Physical Education and Exercise Science, 24(3), 194–204. https://doi.org/10.1080/1091367X.2020.1773827
- Crouter, S., Horton, M., & Bassett, D. (2013). Validity of actigraph child-specific equations during various physical activities. Medicine and Science in Sports and Exercise, 45(7), 7. https://doi.org/10.1249/MSS.0b013e318285f03b
- Datta, D. (2017). blandr: A bland-altman method comparison package for R. [RStudio]. https://doi.org/10.5281/zenodo.824514
- Dixon, P. M., Saint-Maurice, P. F., Kim, Y., Hibbing, P., Bai, Y., & Welk, G. J. (2018). A primer on the use of equivalence testing for evaluating measurement agreement. Medicine and Science in Sports and Exercise, 50(4), 18. https://doi.org/10.1249/MSS.0000000000001481
- Fairclough, S. J., Noonan, R., Rowlands, A. V., Hees, V. V., Knowles, Z., & Boddy, L. M. (2016). Wear compliance and activity in children wearing wrist- and hip-mounted accelerometers. Medicine and Science in Sports and Exercise, 48(2), 9. https://doi.org/10.1249/MSS.0000000000000771
- Hänggi, J. M., Phillips, L. R. S., & Rowlands, A. V. (2013). Validation of the GT3X actigraph in children and comparison with the GT1M actigraph. Journal of Science and Medicine in Sport, 16(1), 6. https://doi.org/10.1016/j.jsams.2012.05.012
- Hildebrand, M., Hansen, B. H., van Hees, V. T., & Ekelund, U. (2017). Evaluation of raw acceleration sedentary thresholds in children and adults. Scandinavian Journal of Medicine & Science in Sports, 28(12), 10. https://doi.org/10.1111/sms.12795
- Hildebrand, M., Hees, V. T. V., Hansen, B. H., & Ekelund, U. (2014). Age group comparability of raw accelerometer output from wrist- and hip-worn monitors. Medicine and Science in Sports and Exercise, 46(9), 9. https://doi.org/10.1249/MSS.0000000000000289
- Hurter, L., Fairclough, S. J., Knowles, Z. R., Porcellato, L. A., Cooper-Ryan, A. M., & Boddy, L. M. (2018). Establishing raw acceleration thresholds to classify sedentary and stationary behaviour in children. Children, 5(12), 18. https://doi.org/10.3390/children5120172
- Katzmarzyk, P. T., Barreira, T. V., Broyles, S. T., Champagne, C. M., Chaput, J.-P., Fogelholm, M., Hu, G., Johnson, W. D., Kuriyan, R., Kurpad, A., Lambert, E. V., Maher, C., Maia, J., Matsudo, V., Olds, T., Onywera, V., Sarmiento, O. L., Standage, M., Tremblay, M. S., … Church, T. S. (2015). Physical activity, sedentary time, and obesity in an international sample of children. Medicine and Science in Sports and Exercise, 47(10), 8. https://doi.org/10.1249/MSS.0000000000000649
- Kim, Y., Hibbing, P., Saint-Maurice, P. F., Ellingson, L., Hennessy, E., Wolff-Hughes, D., Perna, F., & Welk, G. J. (2017). Surveillance of youth physical activity and sedentary behavior with wrist accelerometry. American Journal of Preventive Medicine, 52(6), 8. https://doi.org/10.1016/j.amepre.2017.01.012
- Koo, T. K., & Li, M. (2016). A guideline of selecting and reporting intraclass correlation coefficients for reliability research. Journal of Chiropractic Medicine, 15(2), 9. https://doi.org/10.1016/j.jcm.2016.02.012
- Lakens, D. (2017). Equivalence tests: A practical primer for t tests, correlations, and meta-analyses. Social Psychological and Personality Science, 8(4), 355–362. https://doi.org/10.1177/1948550617697177
- Leppänen, M. H., Migueles, J. H., Abdollahi, A. M., Engberg, E., Ortega, F. B., & Roos, E. (2022). Comparing estimates of physical activity in children across different cut‐points and the associations with weight status. Scandinavian Journal of Medicine & Science in Sports, 32(6), 971–983. https://doi.org/10.1111/sms.14147
- Leppänen, M. H., Migueles, J. H., Cadenas, C., Henriksson, P., Mora, J., Henriksson, H., Labayen, I., Löf, M., Esteban, I., & Ortega, F. B. (2020). Hip and wrist accelerometers showed consistent associations with fitness and fatness in children aged 8‐12 years. Acta Paediatrica, 109(5), 9. https://doi.org/10.1111/apa.15043
- Liljequist, D., Elfving, B., Roaldsen, K. S., & Chiacchio, F. (2019). Intraclass correlation—A discussion and demonstration of basic features. PloS One, 14(7), 7. https://doi.org/10.1371/journal.pone.0219854
- Looney, M. A. (2018). Assessment of interrater and intermethod agreement in the kinesiology literature. Measurement in Physical Education and Exercise Science, 22(2), 14. https://doi.org/10.1080/1091367X.2017.1395742
- Migueles, J. H., Aadland, E., Andersen, L. B., Brønd, J. C., Chastin, S. F., Hansen, B. H., Konstabel, K., Kvalheim, O. M., McGregor, D. E., Rowlands, A. V., Sabia, S., van Hees, V. T., Walmsley, R., Ortega, F. B., Wolstenholme, S., & Pluim, B. M. (2021). GRANADA consensus on analytical approaches to assess associations with accelerometer-determined physical behaviours (physical activity, sedentary behaviour and sleep) in epidemiological studies. British Journal of Sports Medicine, 55(1), 9. https://doi.org/10.1136/bjsports-2020-102360
- Migueles, J. H., Cadenas-Sanchez, C., Ekelund, U., Delisle Nyström, C., Mora-Gonzalez, J., Löf, M., Labayen, I., Ruiz, J. R., & Ortega, F. B. (2017). Accelerometer data collection and processing criteria to assess physical activity and other outcomes: A systematic review and practical considerations. Sports Medicine, 47(9), 1821–1845. https://doi.org/10.1007/s40279-017-0716-0
- Migueles, J. H., Cadenas, C., Tudor, C., Löf, M., Esteban, I., Molina, P., Mora, J., Rodriguez, M., Garcia, E., Ekelund, U., & Ortega, F. B. (2019). Comparability of published cut‐points for the assessment of physical activity: Implications for data harmonization. Scandinavian Journal of Medicine & Science in Sports, 29(4), 9. https://doi.org/10.1123/jmpb.2018-0063
- Migueles, J. H., Rowlands, A. V., Huber, F., Sabia, S., & van Hees, V. T. (2019). GGIR: A research community–driven open source R package for generating physical activity and sleep outcomes from multi-day raw accelerometer data. Journal for the Measurement of Physical Behaviour, 2(3), 10. https://doi.org/10.1123/jmpb.2018-0063
- O’Brien, M. W. (2021). Implications and recommendations for equivalence testing in measures of movement behaviors: A scoping review. Journal for the Measurement of Physical Behaviour, 4(4), 353–362. https://doi.org/10.1123/jmpb.2021-0021
- Romanzini, M., Petroski, E., Ohara, D., Dourado, A., & Reichert, F. (2014). Calibration of actigraph GT3X, actical and RT3 accelerometers in adolescents. European Journal of Sports Science, 14(1), 10. https://doi.org/10.1080/17461391.2012.732614
- Rowlands, A. V. (2018). Moving forward with accelerometer-assessed physical activity: Two strategies to ensure meaningful, interpretable, and comparable measures. Pediatric Exercise Science, 30(4), 7. https://doi.org/10.1123/pes.2018-0201
- Rowlands, A. V., Dawkins, N., Maylor, B., Edwardson, C. L., Fairclough, S. J., Davies, M. J., Harrington, D. M., Khunti, K., & Yates, T. (2019). Enhancing the value of accelerometer-assessed physical activity: Meaningful visual comparisons of data-driven translational accelerometer metrics. Sports Medicine-Open, 5(1), 11. https://doi.org/10.1186/s40798-019-0225-9
- Rowlands, A. V., Edwardson, C. L., Davies, M. J., Khunti, K., Harrington, D. M., & Yates, T. (2018). Beyond cut points: Accelerometer metrics that capture the physical activity profile. Medicine and Science in Sports and Exercise, 50(6), 10. https://doi.org/10.1249/MSS.0000000000001561
- Rowlands, A. V., Mirkes, E., Yates, T., Clemes, S., Davies, M., Khunti, K., & Edwardson, C. L. (2017). Accelerometer-assessed physical activity in epidemiology: Are monitors equivalent? Medicine and Science in Sports and Exercise, 50(2), 257–265. https://doi.org/10.1249/MSS.0000000000001435
- Rowlands, A. V., Yates, T., Davies, M., Khunti, K., & Edwardson, C. L. (2016). Raw accelerometer data analysis with GGIR R-package: Does accelerometer brand matter? Medicine and Science in Sports and Exercise, 48(10), 7. https://doi.org/10.1249/MSS.0000000000000978
- RStudio Team (2020). RStudio: Integrated Development for R. RStudio, PBC, Boston, MA. http://www.rstudio.com/
- Troiano, R. P., McClain, J. J., Brychta, R. J., & Chen, K. Y. (2015). Evolution of accelerometer methods for physical activity research. British Journal of Sports Medicine, 48(13), 1019–1023. https://doi.org/10.1136/bjsports-2014-093546
- Trost, S. G. (2020). Population-level physical activity surveillance in young people: Are accelerometer-based measures ready for prime time? International Journal of Behavioral Nutrition and Physical Activity, 17(1), 28. https://doi.org/10.1186/s12966-020-00929-4
- Trost, S., Loprinzi, P., Moore, R., & Pfeiffer, K. (2011). Comparison of accelerometer cut points for predicting activity intensity in youth. Medicine and Science in Sports and Exercise, 43(7), 7. https://doi.org/10.1249/MSS.0b013e318206476e
- Tudor-Locke, C., Barreira, T. V., Jr, J. M. S., Mire, E. F., Chaput, J.-P., Fogelholm, M., Hu, G., Kuriyan, R., Kurpad, A., Lambert, E. V., Maher, C., Maia, J., Matsudo, V., Olds, T., Onywera, V., Sarmiento, O. L., Standage, M., Tremblay, M. S., Zhao, P., & Katzmarzyk, P. T. (2015). Improving wear time compliance with a 24-hour waist-worn accelerometer protocol in the International Study of Childhood Obesity, Lifestyle and the Environment (ISCOLE). International Journal of Behavioral Nutrition and Physical Activity, 12(11), 9. https://doi.org/10.1186/s12966-015-0172-x
- van Hees, V. T., Fang, Z., Langford, J., Assah, F., Mohammad, A., da Silva, I., Trenell, M., White, T., Wareham, N., & Brage, S. (2014). Autocalibration of accelerometer data for free-living physical activity assessment using local gravity and temperature: An evaluation on four continents. Journal of Applied Physiology, 117(7), 7. https://doi.org/10.1152/japplphysiol.00421.2014
- van Hees, V. T., Gorzelniak, L., Dean Leon, E., Eder, M., Pias, M., Taherian, S., Ekelund, U., Renström, F., Franks, P., Horsch, A., Brage, S., & Müller, M. (2013). Separating movement and gravity components in an acceleration signal and implications for the assessment of human daily physical activity. PloS One, 8(4), 4. https://doi.org/10.1371/journal.pone.0061691