
ABSTRACT
To determine whether the association between self-reported walking pace and all-cause mortality (ACM) persists across categories of accelerometer-assessed physical activity status. Data from 93,709 UK Biobank participants were included. Physical activity was assessed using wrist-worn accelerometers for 7-days. Participants accumulating <150 min/week moderate-to-vigorous- activity were classed as “inactive”, ≥150 min/week moderate (≥3 METs) activity as “somewhat active” excluding those with ≥150 min/week upper-moderate-to-vigorous activity (≥4.3 METs), who were classed as “high-active”. Over a 6.3 y (median) follow-up, 2,173 deaths occurred. More than half of slow walkers were “inactive”, but only 26% of steady and 12% of brisk walkers. Associations between walking pace and ACM were consistent with those for activity. “High active” brisk walkers had the lowest risk of ACM (Hazard Ratio (HR) 0.22; 95% CI: 0.17,0.28), relative to “inactive” slow walkers. Within those classed as “inactive”, steady (HR 0.54; 0.46,0.64) and brisk walkers (HR 0.42; 0.34,0.52) had lower risk than slow walkers. In conclusion, self-reported walking pace was associated with accelerometer-assessed physical activity with both exposures having similar associations with ACM. “inactive”, steady, and brisk walkers had lower ACM risk than slow walkers. The pattern was similar for “High active” participants. Overall, “High active” brisk walkers had lowest risk.
Introduction
Self-reported walking pace is a pragmatic, easy to collect, measure of functional status that is strongly associated with cardiorespiratory fitness, all-cause mortality (ACM) (Celis-Morales et al., Citation2019; Stamatakis et al., Citation2018; Yates et al., Citation2017) cardiovascular disease mortality (Celis-Morales et al., Citation2019; Stamatakis et al., Citation2018) respiratory disease (Celis-Morales et al., Citation2019) and chronic obstructive pulmonary disease (Celis-Morales et al., Citation2019). People who self-report being slow walkers have a lower life expectancy regardless of weight status (Zaccardi et al., Citation2019). Indeed, self-reported walking pace has been identified as a global measure of physical health status with a stronger potential for risk stratification than other lifestyle factors (Argyridou et al., Citation2020; Zaccardi et al., Citation2021) and a genetic basis that overlaps many other traits of cardiometabolic disease (Timmins et al., Citation2020). While differences in self-reported physical activity are associated with differences in self-reported walking pace (Celis-Morales et al., Citation2019; Zaccardi et al., Citation2019) the extent to which it is associated with differences in accelerometer-assessed physical activity is not known. This is important as self-report is conceptually different from accelerometer-based measures; self-report reflects perceived pace/activity and incorporates psychosocial aspects. In contrast, accelerometer-based measures provide a precise measure of acceleration due to bodily movement at a high time resolution (up to 100 times per second) (Troiano et al., Citation2014).
A brisk walking pace exemplifies moderate-to-vigorous intensity physical activity (MVPA), a key focus of current physical activity guidelines (Bull et al., Citation2020). Therefore, as well as physical health, self-reported walking pace may be associated with the total amount (volume) and intensity of physical activity an individual undertakes, and thus whether they achieve the recommended 150 min of MVPA per week (Bull et al., Citation2020). If so, this would further strengthen the value of self-reported walking pace as a simple, but effective, measure of health status and tool for risk stratification.
The volume and intensity of physical activity is generally lower in women (Troiano et al., Citation2008) and in older (particularly over 65-years) (Dawkins et al., Citation2022; Doherty et al., Citation2017), obese (Cooper et al., Citation2000), South Asian (Dawkins et al., Citation2022; Williams et al., Citation2011; Yates et al., Citation2010) or more deprived (Farrell et al., Citation2014) people. Device-assessed physical activity can provide a direct measure of volume and intensity of movement that is comparable across groups (Rowlands et al., Citation2019). However, self-reported walking pace may be gauged relative to others who an individual perceives as “like them”, e.g., the same sex or age-group. In turn, it is possible that the physical activity level may vary between self-reported slow, steady, and brisk walkers relative to “similar” people. For example, while a self-reported brisk walker aged 70-years might have lower physical activity than a self-reported brisk walker aged 30-years, their physical activity would likely still be higher than 70-year-olds who self-report being slow and steady walkers. Given the above, self-reported walking pace will likely reflect the relative intensity of a person’s physical activity, and thus their cardiorespiratory fitness. If this is the case, the value of walking pace as an indicator of physical activity may vary across groups with differing levels of physical activity and/or physical fitness. Accordingly, self-reported walking pace and accelerometer-assessed physical activity may provide complementary information on health status and future risk.
In this context, we aimed to investigate whether: 1) self-reported walking pace is associated with device-based measures of physical activity volume and intensity, and if these associations vary by socio-demographic factors; 2) associations between self-reported walking pace and all-cause mortality are consistent with those observed for accelerometer-assessed categories of physical activity (physical activity status); and 3) associations between walking pace and all-cause mortality persist across different physical activity categories.
Methods
Setting and cohort
This study used data from UK Biobank (application 36,371), a prospective cohort study of >500,000 participants aged 40–69-years with baseline assessments conducted between March 2006 and July 2010 (Sudlow et al., Citation2015). Methods were carried out in accordance with relevant guidelines and regulations and all participants gave written informed consent. UK Biobank has full ethical approval from the NHS National Research Ethics Service (16/NW/0274). Details of recruitment and measurements are available at https://www.ukbiobank.ac.uk.
Walking pace
Self-reported walking pace was assessed with a touchscreen question at baseline. Participants were asked “How would you describe your usual walking pace?”, options were “slow”, “steady/average” or “brisk” (UK Biobank Data-Field 924).
Physical activity
A sub-sample of ~100,000 adults were asked to wear the Activity A × 3 wrist-worn accelerometer (Axivity, Newcastle, UK) 24-h a day for 7-days between June 2013 and December 2015 (Doherty et al., Citation2017), a median of 5.7 years after baseline. For each participant, we extracted the 5-s epoch time-series data (Doherty et al., Citation2017) and converted it to R-format for processing with GGIR (version 2.3-0, http://cran.r-project.org) (Migueles et al., Citation2019). Participants were excluded if their accelerometer data failed calibration (or if their accelerometer data were not calibrated on their own data), had fewer than 3-days of valid wear (defined as >16 h/day), or wear data were not present for each 15-min period of the 24 h cycle (Rowlands et al., Citation2018, Citation2019). Doherty et al. showed that 3 days of wear were needed to be within 10% of the seven-day measure of physical activity volume in the UK Biobank accelerometer cohort (Doherty et al., Citation2017). Accelerometer outcomes, selected to describe the volume and intensity of physical activity over the 24 h day (i.e., including sleep and wake), were:
average acceleration (proxy for activity volume, mg)
intensity gradient (intensity distribution of activity; higher values indicate a greater proportion of activity is spent at high intensity; Rowlands et al., Citation2018). In brief, the time accumulated in incremental intensity bins is regressed on intensity and both variables log-transformed to linearise the curvilinear relationship. The resulting slope is always negative, with a more negative coefficient reflecting less time in higher intensities, and a less negative coefficient reflecting proportionately more time in higher intensities (Rowlands et al., Citation2018).
Physical activity status was classified based on accumulation of 150 min activity per week (21.4 min per day) defined as:
time accumulated above the MVPA 100 mg acceleration cut-point (Hildebrand et al., Citation2014). To remove extraneous signals related to random wrist movement, only activities lasting ≥1 min (where 80% of the activity was ≥100 mg threshold criteria) were included, in line with previous research using wrist-worn accelerometers (Cassidy et al., Citation2018; Menai et al., Citation2017; Mielke et al., Citation2021). This is recommended (Cassidy et al., Citation2018; Menai et al., Citation2017) within this intensity category as random non-purposeful movements often exceed the relatively low 100 mg threshold.
total time accumulated above a more stringent MVPA acceleration cut-point that approximates the acceleration magnitude during brisk walking (~4.3 METs, 250 mg (Chudasama et al., Citation2019; Dawkins et al., Citation2021). This more stringent definition approximates the mid-point between moderate (3 METs) and vigorous (6 METs) intensity.
Three mutually exclusive categories were created, enabling capture of a dose–response association with all-cause mortality (ACM):
Inactive: <150 min MVPA per week
Somewhat active: ≥150-min activity per week above 100 mg (3 METs), but not ≥150 min above 250 mg (4.3 METs)
High active: ≥150-min activity per week above the more stringent threshold 250 mg (4.3 METs), mid-way between moderate and vigorous intensity
All-cause mortality (ACM)
Mortality records from NHS Digital (England and Wales) and from the Information and Statistics Division (Scotland) were linked to UK Biobank. Linkage captured all deaths occurring until a censoring date (28 February 2021). The accelerometer time-point was used as the analytical baseline for these analyses.
Co-variates
Demographic characteristics measured at baseline and utilised in the main analyses in this study included sex, ethnicity (White, South Asian, Black African or Caribbean), and deprivation (Townsend Index). Age and season of accelerometer wear measured at accelerometer baseline were also included.
Additional social and health-related variables utilised in further adjusted analyses were in line with previous similar research (Zaccardi et al., Citation2021) and included: body mass index (BMI), cardiovascular disease or cancer diagnosis prior to accelerometer baseline (self-reported history of heart attack, angina, stroke or cancer, OR hospital episode with ICD-10 code I20–25, I60–69 or C00–99), blood pressure and/or lipid lowering medication, smoking status (never, previous, current) and mobility limitations. These were taken from the measurement point closest to accelerometer baseline as described previously (Strain et al., Citation2020).
Statistical analysis
All participants with accelerometer data were eligible for inclusion. Participants were excluded if accelerometer data were not valid, or walking pace or co-variate data (sex, ethnicity, age, deprivation) were missing, leaving a sample size of 93,709. Of these, 86.5% wore the accelerometer for 6 valid days, 7.9% for 5 valid days, 3.6% for 4 valid days and 1.9% for 3 valid days. Over three-quarters (77.7%) of participants had 2 valid weekend days, 18.4% 1 valid weekend day and 3.9% no valid weekend days. The reliability coefficient (intra-class coefficient) for a single day of measurement for the MVPA outcomes was 0.51. Applying the Spearman-Brown prophecy formula (Eisinga et al., Citation2013) showed that reliability for three measurement days was 0.76, and for 4–6 days measurement days, >0.80. To reduce the risk of reverse causality bias, participants were excluded from the ACM analyses if they had fewer than 2 years follow-up data from the accelerometer baseline, leaving 93,174 participants (Model 1). A further 621 participants were excluded from Model 2 as they were missing the additional social and health-related co-variate data (Model 2). A flow chart detailing participant exclusions is provided in Supplementary Figure S1.
Physical activity by walking pace
Linear regression analyses were used to compare hour-by-hour physical activity, activity volume and activity intensity by walking pace. Models were adjusted for sex, ethnicity, age, deprivation, and season of accelerometer wear. Effect modifications for volume and intensity by sex, ethnicity, age-group, weight status and deprivation were tested using interaction terms (e.g., sex*physical activity volume).
Association with all-cause mortality
Cox-proportional hazards models were used to investigate the association of self-reported walking pace and of physical activity status with ACM using age as underlying time-scale. As there was an interaction between walking pace and activity status (p = 0.04), mutually exclusive categories of walking pace and physical activity status (described earlier) were used to model the association with ACM across all possible combinations of walking pace and physical activity status.
To maximise relevance for simple risk stratification, where only basic demographic information may be available, Model 1 was only adjusted for sex, ethnicity, deprivation, and season of accelerometer wear (accelerometer analyses only). Model 2 was further adjusted for the additional social and health-related variables.
We performed a sensitivity analysis to investigate reverse causality bias with chronic disease, excluding those with prevalent cardiovascular disease or cancer at baseline. In addition, as walking pace was measured several years prior to the accelerometer measures, the “at-risk” period of mortality started prior to the accelerometer baseline. This may have introduced survival bias as participants who died prior to the accelerometer measure would be excluded from our analysis. To address this, we re-ran the walking pace analyses using the walking pace timepoint as the analytical baseline in the UK Biobank cohort (N ~ 480,000 depending on model).
Statistical significance was set at p < 0.05; results are reported with a 95% confidence interval (CI). All analyses were performed in Stata version 17.0.
Results
Of the 93,709 participants included (56% female, 98% white, BMI = 26.7 kg·m−2), 5% self-reported being slow walkers, 48% being steady walkers and 47% being brisk walkers. There were 2,173 (2.3%) deaths recorded during the median 6.3 (range 2–7.6) years of follow-up from accelerometer baseline. Descriptive characteristics by walking pace are shown in . Twenty-one per cent of the sample were classed as “inactive”, 60% as “somewhat active”, and 19% as “high active”.
Table 1. Descriptive characteristics by walking pace.
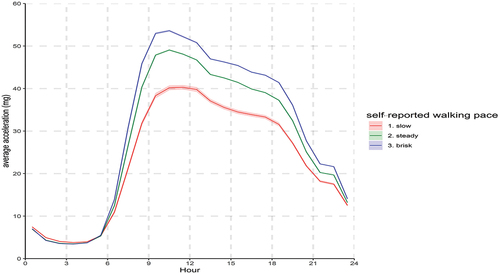
The volume and intensity of physical activity was lowest in slow walkers and highest in brisk walkers (, p < 0.001) with the difference evident throughout the waking day (). However, only just over half (56%) of slow walkers were classed as “inactive”, while the majority of steady (60%) and brisk (62%) walkers were classed as “somewhat active”, with approximately a quarter of brisk walkers classed as “high active” (Supplementary Figure S2).
Figure 1. Physical activity across the 24 h day in self-reported slow, steady and brisk walkers. Adjusted for sex, age, deprivation, ethnicity and season of accelerometer wear. Values are hourly average marginal means (95% confidence interval).
Walking pace and physical activity by sex, ethnicity, age, weight status, and deprivation
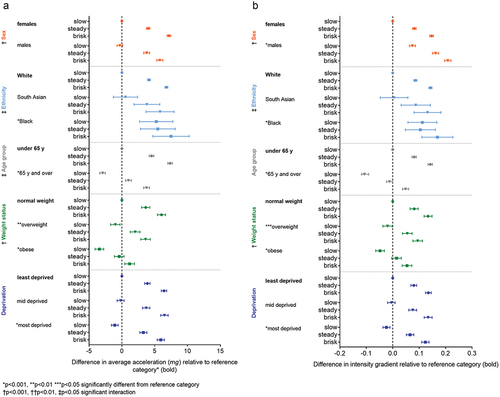
Despite group differences in physical activity, the relative differences by walking pace within groups were evident for activity volume () and intensity () regardless of sex, age-group, weight status and deprivation. However, the physical activity level of Black people was similar irrespective of their self-reported walking pace. Interactions for sex (p < 0.001), ethnicity (p < 0.05), age-group (p < 0.05 volume, p = 0.056 intensity) and weight status (p < 0.001) for volume and intensity of physical activity reflected relatively smaller differences between brisk and steady walkers in males, non-white ethnicities, older people, overweight and obese people.
Figure 2. Difference in physical activity volume (a) and intensity (b) of slow, steady and brisk walkers by sex, ethnicity, age, weight status, and deprivation. Adjusted for sex, ethnicity, age, deprivation, and season of accelerometer wear (accelerometer analyses only). Values are differences between marginal mean (±95% confidence interval). Interactions for sex, age-group, weight status for volume and intensity reflect relatively smaller differences between brisk and steady than in reference group. Average acceleration (mg) from wrist-worn accelerometry was used a proxy measure of daily volume (a) and the intensity gradient as a measure of the intensity distribution of physical activity across the day (b).
Consequently, while the proportion of slow, steady and brisk walkers classed as “somewhat active” or “high active” was similar across sex and deprivation, proportions varied for people of Black ethnicity and those with relatively low physical activity levels (e.g., people who were older or obese) (Supplementary Figure S3). Notably, 58% of self-reported slow walkers of Black ethnicity were “somewhat active” and 17% were “high active”, compared with 38% and 5% of White slow walkers, respectively. Conversely, over one-quarter of older or obese people self-reporting being a steady walker or brisk walker were classed as “inactive”, compared with only 13% of normal weight and younger people.
Association with ACM
Compared with slow walkers, the hazard ratio (HR) for ACM during follow-up was 0.50 (95% confidence interval (CI): 0.44,0.58) in steady and 0.42 (0.36,0.48) in brisk walkers ( (black)). The main differences were evident between slow and steady walkers, with diminishing returns for brisk walkers relative to steady walkers.
Figure 3. Association of self-reported walking pace, physical activity status, and combined physical activity status/walking pace with ACM. a) Model 1: adjusted for sex, deprivation, ethnicity and season of accelerometer wear (accelerometer analyses only). b) Model 2: further adjusted for body mass index, prevalent cardiovascular disease or cancer at baseline, blood pressure or cholesterol medication, smoking status, mobility limitations. HR = Hazard ratio. 95% CI = 95% confidence interval.
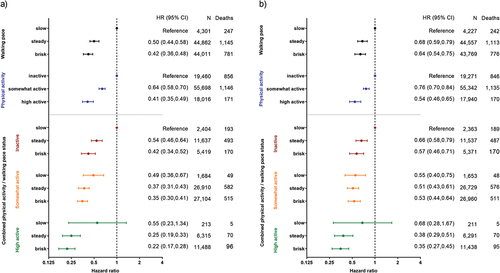
In relation to physical activity status, the hazard ratio (HR) for ACM during follow-up was 0.64 (0.58,0.70) in those classed as “somewhat active” and 0.41 (0.35,0.49) in those classed as “high active”, relative to those classed as “inactive” ( (blue)). The pattern was consistent with walking pace, except the difference between HRs for ACM was more evenly spread across the three physical activity status categories.
Combined analyses: Walking pace/physical activity status and ACM
Associations between walking pace and ACM were strongest in those classed as “inactive”, where the HR was 0.54 (0.46,0.64) in “inactive” steady walkers and 0.42 (0.34,0.52) in “inactive” brisk walkers relative to “inactive” slow walkers (). Nevertheless, “active” brisk walkers had the lowest overall risk of ACM (HR: 0.22; 95% CI: 0.17,0.28), relative to “inactive” slow walkers ().
Sensitivity analyses
Associations in models with further adjustment for sociodemographic and health-related variables () and when excluding participants prevalent cardiovascular disease or cancer at baseline (Supplementary Figures S4 a-b) were slightly attenuated, but consistent with the main analyses. Associations between walking pace and ACM in models run with the full walking pace sample and the walking pace baseline were slightly stronger, but similar, to the models run with the accelerometer sub-sample (Supplementary Figure S5).
Discussion
Main findings
In this large population-based cohort of middle-aged adults, the volume and intensity of accelerometer-assessed physical activity differed by self-reported walking pace. Nevertheless, while nearly three-quarters of steady walkers and 88% of brisk walkers classed as “somewhat active” or “high active”, only just over half (56%) of slow walkers were classed as “inactive”. This demonstrates that self-reported walking pace and accelerometer-assessed physical activity are measuring distinct constructs, with the combination of the two providing more information than either measure alone. Despite this, the lower risk of ACM during follow-up for steady or brisk walkers was consistent with the lower risk for being classed as “somewhat active” or “high active” based on accelerometer-measured physical activity. Importantly, these associations were maintained when accounting for additional health-related variables and mobility limitations. Overall, “high active” self-reported brisk walkers had the lowest risk of ACM. Notably, self-reported walking pace may add value to physical activity status, particularly for risk stratification in those classed as “inactive”, with the risk of all-cause mortality 46% lower in “inactive” steady walkers, and 58% lower in “inactive” brisk walkers, relative to “inactive” slow walkers.
Physical activity by walking pace
Despite group-level differences in physical activity, relative differences between self-reported slow, steady, and brisk walkers were broadly consistent within sex, age, weight status, and level of deprivation. However, this was not the case in slow walkers of Black ethnicity who had relatively high physical activity that did not differ from steady walkers. Indeed 75% of Black slow walkers were classed as “somewhat active” or “high active”, while this was only the case for 43% of White slow walkers. This is consistent with higher overall physical activity in people of Black ethnicity (Dawkins et al., Citation2022); however, numbers are low and may not be representative, thus further work is required to explore this. In contrast, the volume and intensity of physical activity in self-reported brisk walkers who are obese was low, comparable with the physical activity of non-obese slow walkers.
Thus, difference in activity levels by walking pace may be blunted in people of Black ethnicity and groups with low (e.g., obese) levels of physical activity, which may impact on the utility of self-reported walking pace for risk stratification in these groups. This is consistent with previous reports of attenuation of the lower odds of ACM in brisk walkers relative to steady walkers in people with high BMI (Yates et al., Citation2017).
Discrepancies between categories of walking pace and physical activity reflect the distinct constructs being assessed and conceptual differences between self-report and device-based assessment (Troiano et al., Citation2014). For example, the walking pace question asks about “usual” walking pace (Stamatakis et al., Citation2018), not quantity of walking. In contrast, the accelerometer assessed movement over a 7-day period, typically accepted as representative of habitual physical activity (Matthews et al., Citation2012).
In addition to physical activity, self-reported walking pace will likely reflect physical fitness, whereby a lower absolute intensity, e.g., a “slow” or “steady” pace, is experienced at a higher relative intensity, e.g., as “brisk”. Further, it may also reflect variables such as physical self-perception, physical health, cultural norms, and social desirability (Verhoog & Saner, Citation2021).
Walking pace as a tool for risk stratification
Only 5% of people reported themselves to be slow walkers, while 20% were classed as “inactive”. While the proportion of self-reported slow walkers in the whole UK Biobank cohort is higher at ~10% (Yates et al., Citation2017), this has implications for identification of “at risk” people. For example, it would not be sufficient to simply target slow walkers; instead, recommendations that are tailored to improve physical activity according to self-reported walking pace could be used. While most steady walkers and brisk walkers were “somewhat active”, the majority (86% and 74%, respectively) were not classed as “high active”, i.e., they did not achieve ≥150 min per week at an intensity typically elicited when walking briskly. This is important as within “somewhat active” or “high active” physical activity status, self-reported steady and brisk walkers had a similar risk of ACM, suggesting the lower overall risk in brisk walkers does reflect their higher level of physical activity. However, for those classed as “inactive”, there did appear to be a dose–response association between walking pace and ACM.
Recommendations
Our results further support use of self-reported walking pace as a fast and pragmatic screening tool for risk stratification at a population level (Argyridou et al., Citation2020), although caution is recommended when interpreting self-reported walking pace from Black ethnic groups and low-active groups or low-fit groups.
Based on differences evident in the physical activity profiles by walking pace, the following recommendations are geared towards improving the physical activity profile in self-reported slow, steady, and brisk walkers:
slow walkers: over half were not accumulating 150 min per week at an intensity indicative of steady walking; the target should be increasing the time spent walking, irrespective of pace/intensity
steady walkers: approximately 60% were accumulating 150 min per week at an intensity indicative of steady walking, but only ~15% 150 min per week at an intensity indicative of brisk walking; the target should be increasing the intensity of walking to a brisk pace
brisk walkers: approximately 60% were accumulating 150 min per week at an intensity indicative of steady walking but, only one-quarter were accumulating 150 min per week at an intensity indicative of brisk walking; this group would gain further benefit from increasing the time spent walking briskly.
Limitations
While this study benefitted from a large sample size with accelerometer-assessed physical activity, there are some limitations. Walking pace and some co-variates were assessed at baseline, while the accelerometer measures were taken ~6 years later. Change in the co-variates over this time has been shown to be minimal in UK Biobank (Strain et al., Citation2020). Similarly, physical activity in mid-life is relatively stable over time (Matthews et al., Citation2012) but does decline in later life (Dawkins et al., Citation2022; Doherty et al., Citation2017). We acknowledge the difference in timing of the accelerometer and walking pace measures may have impacted on our findings. However, the pattern of the association between walking pace and all-cause mortality was similar when running the walking pace analyses on the full UK Biobank cohort with a median follow-up of 11.8 years and to results previously reported for the full UK Biobank sample with a median follow-up of 7.0 years (Zaccardi et al., Citation2019). Further, while accelerometer-assessed activity is a direct measure of movement, comparable across groups, self-reported walking pace is subjective and may be perceived differently between groups and reflect cultural norms (Verhoog & Saner, Citation2021), e.g., our results suggest it differs by ethnicity and weight status. Given this, it would have been valuable to have investigated whether the associations of self-reported walking pace and physical activity status with ACM differed by sociodemographic factors. We chose not to do this in the current study due to the low number of events in the sub-categories, but this should be considered in future research.
To maximise applicability of our data for risk stratification, where only basic demographic information may be available, we limited co-variates to age, sex, ethnicity, and area-level deprivation. However, the pattern of results was similar when adjusting for additional sociodemographic and health-related variables. Finally, UK Biobank participants are not representative of the wider population, being less deprived and healthier, with a lower prevalence of ethnic minorities (Fry et al., Citation2017). However, available evidence suggests risk factor associations in UK Biobank appear to be generaliable (Batty et al., Citation2020).
Conclusions
The volume and intensity of accelerometer-assessed physical activity was lowest in people who reported being slow walkers and highest in brisk walkers. However, self-reported walking pace reflects comparisons relative to perceived “similar people” and thus the relative or perceived intensity of physical activity rather than absolute intensity of physical activity. Consequently, the combination of self-reported walking pace and physical activity status provides more information than either measure alone. Thus, as well as being a simple to measure prognostic indicator of risk of all-cause mortality, self-reported walking pace facilitates risk stratification for targeted interventions based on physical activity status. In those classed as “inactive”, the risk of ACM during follow-up was halved in steady walkers and 58% lower in brisk walkers, relative to slow walkers. The lowest risk of ACM during follow-up was for the 26% of self-reported brisk walkers who “walked the talk”, i.e., were classed as “high active”.
Code availability
Accelerometer data were processed using the open-source R-package GGIR (version 2.3–0, http://cran.r-project.org)
Ethics approval
This is a secondary data analysis. All participants gave written informed consent prior to data collection. UK Biobank has full ethical approval from the NHS National Research Ethics Service (16/NW/0274).
Patient and public involvement
It was not appropriate or possible to involve patients or the public in the design, or conduct, or reporting, or dissemination plans of our research.
Author contribution
Conception/design: AR, TY, PD. Data analysis/acquisition/interpretation: All authors. Drafting of the manuscript: AR. Critical revision of the manuscript for important content: All authors. Final approval: All authors.
Supplemental Material
Download TIFF Image (751.4 KB)Supplemental Material
Download TIFF Image (930 KB)Supplemental Material
Download TIFF Image (11.8 MB)Supplemental Material
Download TIFF Image (5.4 MB)Supplemental Material
Download PDF (84.3 KB)Acknowledgments
Data were analysed using UK Biobank application number 36371.
Disclosure statement
No potential conflict of interest was reported by the authors.
Data availability statement
This research has been conducted using the UK Biobank Resource under Application 36,371. The database supporting the conclusions of this article is available from UK Biobank project site, subject to registration and application process. Further details can be found at https://www.ukbiobank.ac.uk.
Supplementary Material
Supplemental data for this article can be accessed online https://doi.org/10.1080/02640414.2023.2209762
Additional information
Funding
References
- Argyridou, S., Zaccardi, F., Davies, M. J., Khunti, K., & Yates, T. (2020). Walking pace improves all-cause and cardiovascular mortality risk prediction: A UK Biobank prognostic study. European Journal of Preventive Cardiology, 27(10), 1036–1044. https://doi.org/10.1177/2047487319887281
- Batty, G. D., Gale, C. R., Kivimäki, M., Deary, I. J., & Bell, S. (2020). Comparison of risk factor associations in UK Biobank against representative, general population-based studies with conventional response rates: Prospective cohort study and individual participant meta-analysis. British Medical Journal, 368, m131. https://doi.org/10.1136/bmj.m131
- Bull, F. C., Al-Ansari, S. S., Biddle, S., Borodulin, K., Buman, M. P., Cardon, G., Carty, C., Chaput, J. -P., Chastin, S., Chou, R., Dempsey, P. C., DiPietro, L., Ekelund, U., Firth, J., Friedenreich, C. M., Garcia, L., Gichu, M., Jago, R., Katzmarzyk, P. T., Willumsen, J. F. … Willumsen, J. F. (2020). World Health Organization 2020 guidelines on physical activity and sedentary behaviour. British Journal of Sports Medicine, 54(24), 1451–1462. https://doi.org/10.1136/bjsports-2020-102955
- Cassidy, S., Fuller, H., Chau, J., Catt, M., Bauman, A., & Trenell, M. I. (2018). Accelerometer-derived physical activity in those with cardio-metabolic disease compared to healthy adults: A UK Biobank study of 52,556 participants. Acta Diabetologica, 55(9), 975–979. https://doi.org/10.1007/s00592-018-1161-8
- Celis-Morales, C. A., Gray, S., Petermann, F., ILIODROMITI, S., WELSH, P., LYALL, D. M., ANDERSON, J., PELLICORI, P., MACKAY, D. F., PELL, J. P., SATTAR, N., & GILL, J. M. R. (2019). Walking pace is associated with lower risk of all-cause and cause-specific mortality. Medicine & Science in Sports & Exercise, 51(3), 472–480. https://doi.org/10.1249/MSS.0000000000001795
- Chudasama, Y. V., Khunti, K. K., Zaccardi, F., Rowlands, A. V., Yates, T., Gillies, C. L., Davies, M. J., & Dhalwani, N. N. (2019). Physical activity, multimorbidity, and life expectancy: A UK Biobank longitudinal study. BMC Medicine, 17(1). https://doi.org/10.1186/s12916-019-1339-0
- Cooper, A., Page, A., Fox, K. R., & Misson, J. (2000). Physical activity patterns in normal, overweight and obese individuals using minute-by-minute accelerometry. Preventive Medicine, 54(12), 887–894. https://doi.org/10.1038/sj.ejcn.1601116
- Dawkins, N. P., Yates, T., Razieh, C., Edwardson, C. L., Maylor, B., Zaccardi, F., Khunti, K., & Rowlands, A. V. (2022). Differences in accelerometer measured patterns of physical activity and sleep/rest between ethnic groups and age: An analysis of UK Biobank. Journal of Physical Activity & Health, 19(1), 37-16. https://doi.org/10.1123/jpah.2021-0334
- Dawkins, N. P., Yates, T., Soczawa-Stronczyk, A. A., Bocian, M., Edwardson, C. L., Maylor, B., Davies, M. J., Khunti, K., & Rowlands, A. V. (2021). Wrist-worn acceleration values during self-paced walking and running: A walk in the park. Journal of Sports Sciences, 40(1), 81–88. https://doi.org/10.1080/02640414.2021.1976491
- Doherty, A., Jackson, D., Hammerla, N., Plötz, T., Olivier, P., Granat, M. H., White, T., van Hees, V. T., Trenell, M. I., Owen, C. G., Preece, S. J., Gillions, R., Sheard, S., Peakman, T., Brage, S., & Wareham, N. J. (2017). Large scale population assessment of physical activity using wrist worn accelerometers: The UK Biobank study. PloS One, 12(2), e0169649. https://doi.org/10.1371/journal.pone.0169649
- Eisinga, R., Grotenhuis, M. T., & Pelzer, B. (2013). The reliability of a two-item scale: Pearson, cronbach, or spearman-brown? International Journal of Public Health, 58(4), 637–642. https://doi.org/10.1007/s00038-012-0416-3
- Farrell, L., Hollingsworth, B., Propper, C., & Shields, M. A. (2014). The socioeconomic gradient in physical inactivity: Evidence from one million adults in England. Social Science & Medicine, 123, 55–63. https://doi.org/10.1016/j.socscimed.2014.10.039
- Fry, A., Littlejohns, T. J., Sudlow, C., Doherty, N., Adamska, L., Sprosen, T., Collins, R., & Allen, N. E. (2017). Comparison of sociodemographic and health-related characteristics of UK Biobank participants with those of the general population. American Journal of Epidemiology, 186(9), 1026–1034. https://doi.org/10.1093/aje/kwx246
- Hildebrand, M., van Hees, V. T., Hansen, B. H., & EKELUND, U. (2014). Age group comparability of raw accelerometer output from wrist- and hip-worn monitors. Medicine & Science in Sports & Exercise, 46(9), 1816–1824. https://doi.org/10.1249/MSS.0000000000000289
- Matthews, C. E., Hagströmer, M., Pober, D. M., & BOWLES, H. R. (2012). Best practises for using physical activity monitors in population-based research. Medicine & Science in Sports & Exercise, 4(1S), S68–76. https://doi.org/10.1249/MSS.0b013e3182399e5b
- Menai, M., van Hees, V., Elbaz, A., Kivimaki, M., Singh-Manoux, A., & Sabia, S. (2017). Accelerometer assessed moderate-to-vigorous physical activity and successful ageing: Results from the Whitehall II study. Scientific Reports, 7(1), 45772. https://doi.org/10.1038/srep45772
- Mielke, G. I., Menezes, A. M. B., Da Silva, B. G. C., Ekelund, U., Crochemore-Silva, I., Wehrmeister, F. C., Gonçalves, H., & Brown, W. J. (2021). Associations between device-measured physical activity and cardiometabolic health in the transition to early adulthood. Medicine & Science in Sports & Exercise, 53(10), 2076–2085. https://doi.org/10.1249/MSS.0000000000002696
- Migueles, J. H., Rowlands, A. V., Huber, F., Sabia, S., & van Hees, V. T. (2019). GGIR: A research community–driven open source R package for generating physical activity and sleep outcomes from multi-day raw accelerometer data. Journal for the Measurement of Physical Behaviour, 2(3), 188–196. https://doi.org/10.1123/jmpb.2018-0063
- Rowlands, A. V., Edwardson, C. L., Davies, M. J., KHUNTI, K., HARRINGTON, D. M., & YATES, T. (2018). Beyond cut-points: Accelerometer metrics that capture the physical activity profile. Medicine & Science in Sports & Exercise, 50(6), 1323–1332. https://doi.org/10.1249/MSS.0000000000001561
- Rowlands, A. V., Yates, T., Edwardson, C. L., EDWARDSON, C. L., DAVIES, M., MUNIR, F., KHUNTI, K., & STILES, V. H. (2019). Activity intensity, volume & norms: Utility and interpretation of accelerometer metrics. Medicine & Science in Sports & Exercise, 51(11), 2410–2422. https://doi.org/10.1249/MSS.0000000000002047
- Stamatakis, E., Kelly, P., Strain, T., Murtagh, E. M., Ding, D., & Murphy, M. H. (2018). Self-rated walking pace and all-cause, cardiovascular disease and cancer mortality: Individual participant pooled analysis of 50 225 walkers from 11 population British cohorts. British Journal of Sports Medicine, 52(12), 761–768. https://doi.org/10.1136/bjsports-2017-098677
- Strain, T., Wijendale, K., Dempsey, P. C., Sharp, S. J., Pearce, M., Jeon, J., Lindsay, T., Wareham, N., & Brage, S. (2020). Wearable-device-measured physical activity and future health risk. Nature Medicine, 26(9), 1385–1391. https://doi.org/10.1038/s41591-020-1012-3
- Sudlow, C., Gallacher, J., Allen, N., Beral, V., Burton, P., Danesh, J., Downey, P., Elliott, P., Green, J., Landray, M., Liu, B., Matthews, P., Ong, G., Pell, J., Silman, A., Young, A., Sprosen, T., Peakman, T., & Collins, R. (2015). UK Biobank: An open access resource for identifying the causes of a wide range of complex diseases of middle and old age. PLoS Medicine, 12(3), e1001779. https://doi.org/10.1371/journal.pmed.1001779
- Timmins, I. R., Zaccardi, F., Nelson, C. P., Franks, P. W., Yates, T., & Dudbridge, F. (2020). Genome-wide association study of self-reported walking pace suggests beneficial effects of brisk walking on health and survival. Communications Biology, 3(1), 634. https://doi.org/10.1038/s42003-020-01357-7
- Troiano, R. P., Berrigan, D., Dodd, K. W., Mâsse, L. C., TILERT, T., & MCDOWELL, M. (2008). Physical activity in the United States measured by accelerometer. Medicine & Science in Sports & Exercise, 40(1), 181–188. https://doi.org/10.1249/mss.0b013e31815a51b3
- Troiano, R. P., McClain, J., Brychta, R., & Chen, K. Y. (2014). Evolution of accelerometer methods for physical activity research. British Journal of Sports Medicine, 48(13), 1019–1023. https://doi.org/10.1136/bjsports-2014-093546
- Verhoog, S., & Saner, H. (2021). Walking pace: Don’t hurry, be active. European Journal of Preventive Cardiology, 28(7), 702–703. https://doi.org/10.1177/2047487319895872
- Williams, E. D., Stamatakis, E., Chandola, T., & Hamer, M. (2011). Assessment of physical activity levels in South Asians in the UK: Findings from the health survey for England. Journal of Epidemiology & Community Health, 65(6), 517–521. https://doi.org/10.1136/jech.2009.102509
- Yates, T., Davies, M., Gray, L., Webb, D., Henson, J., Gill, J. M. R., Sattar, N., & Khunti, K. (2010). Levels of physical activity and relationship with markers of diabetes and cardiovascular disease risk in 5474 white European and South Asian adults screened for type 2 diabetes. Preventive Medicine, 51(3–4), 290–294. https://doi.org/10.1016/j.ypmed.2010.06.011
- Yates, T., Zaccardi, F., Dhalwani, N. N., Davies, M. J., Bakrania, K., Celis-Morales, C. A., Gill, J. M. R., Franks, P. W., & Khunti, K. (2017). Association of walking pace and handgrip strength with all-cause, cardiovascular, and cancer mortality: A UK Biobank observational study. European Heart Journal, 38(43), 3232–3240. https://doi.org/10.1093/eurheartj/ehx449
- Zaccardi, F., Davies, M. J., Khunti, K., & Yates, T. (2019). Comparative relevance of physical fitness and adiposity on life expectancy: A UK Biobank observational study. Mayo Clinic Proceedings, 94(6), 985–994. https://doi.org/10.1016/j.mayocp.2018.10.029
- Zaccardi, F., Franks, P. W., Dudbridge, F., Davies, M. J., Khunti, K., & Yates, T. (2021). Mortality risk comparing walking pace to handgrip strength and a healthy lifestyle: A UK Biobank study. European Journal of Preventive Cardiology, 28(7), 704–712. https://doi.org/10.1177/2047487319885041