
ABSTRACT
It is important to monitor secular trends in children’s motor performance, as healthy and physically active children are more likely to become healthy and physically active adults. However, studies with regular and standardized monitoring of motor performance in childhood are scarce. Additionally, the impact of COVID-19 mitigation measures on secular trends is unknown. This study describes secular changes in balancing backwards, jumping sidewards, 20-m sprint, 20-m Shuttle Run Test (SRT) and anthropometric data in 10’953 Swiss first graders from 2014 to 2021. Multilevel mixed-effects models were used to estimate secular trends for boys vs. girls, lean vs. overweight and fit vs. unfit children. The potential influence of COVID-19 was also analysed. Balance performance decreased (2.8% per year), whereas we found improvements for jumping (1.3% per year) and BMI (−0.7% per year). 20-m SRT performance increased by 0.6% per year in unfit children. Children affected by COVID-19 measures had an increased BMI and were more overweight and obese, but motor performance was mostly higher. In our sample, secular changes in motor performance show promising tendencies from 2014 to 2021. The effects of COVID-19 mitigation measures on BMI, overweight and obesity should be monitored in additional birth cohorts and follow-up studies.
Introduction
Physical fitness – including cardiovascular endurance, muscular strength, and body composition – has direct health implications for child and youth development (Ortega et al., Citation2008). For example, skill-related fitness and motor performance increase the engagement in physical activity of children (Jaakkola et al., Citation2016; Larsen et al., Citation2015). Children with low physical fitness and motor performance are less likely to participate in sport activities, as they lack the physical abilities needed to perform more complex movements (Hardy et al., Citation2012). The development of appropriate motor skills early in life also enhances the likelihood of lifelong physical activity (Hulteen et al., Citation2018). There is evidence from a systematic review showing moderate to strong associations between participation in sport activities in childhood, adolescence and early adulthood (Batista et al., Citation2019). A very similar effect has been reported for components of physical fitness, which appear to remain relatively stable from childhood to early adulthood (Utesch et al., Citation2018). Sufficient fitness levels positively affect public health issues already in young age. For instance, beneficial effects of physical fitness were found for obesity and diabetes (Dwyer et al., Citation2009; Lopes et al., Citation2012), cardiovascular health (Hamer et al., Citation2020; Ruiz et al., Citation2009) and mental health (Ruiz et al., Citation2009). Further, better motor fitness, e.g., muscular strength or endurance, is related to enhanced bone as well as mental health and lower risk of adiposity (Lopes et al., Citation2012; Smith et al., Citation2014).
Based on the above-mentioned associations, it has recently been suggested to apply regular and standardized monitoring of physical fitness in childhood to identify individuals with diminished motor fitness (Utesch et al., Citation2018). Eberhardt et al. (Citation2020) recently noted that only few studies evaluated physical fitness in children with a sufficiently large and population-based sample. An even smaller number of studies have tracked secular trends in physical fitness surveys – especially studies including regular measuring points over several years and a uniform methodology to examine secular trends in children. G. R. Tomkinson and Olds (Citation2007) reported an annual global decline of 0.46% in aerobic performance (assessed by the 20-m Shuttle Run Test) between 1970 and 2003 and mean declines ranging from 0.74% for North America to 0.31% per annum in Europe. Regarding anaerobic performance, G. R. Tomkinson et al. (Citation2006) showed no consistent trend for strength and speed over the same time period. A recent review noticed that the downward tendency in cardiorespiratory endurance reached a nadir in 2010 and remained low until 2015, whereas linear sprint ability improved (Fühner et al., Citation2021). Thus, the secular trends in aerobic and anaerobic performances sometimes differ within the same study or review, highlighting the importance of applying a test battery that allows to assess different parameters of physical functioning.
Secular trends may depend on the initial fitness level as well as anthropometric characteristics of the children. Albon et al. (Citation2010) observed substantially worse results in 2003 compared to 1991 in those children with the worst fitness and the highest body mass indices, whereas the children with the best physical fitness and the lowest body mass indexes showed only marginal declines. Similarly, Wedderkopp et al. (Citation2004) reported a greater decline in unfit and obese Danish 9-year-old boys and girls. The authors showed that in 1997–98 children with low fitness were even less fit and more overweight than their peers twelve years before. Thus, these data show an emerging polarization, with a widening gap between the fit and the unfit and a widening gap between the lean and the overweight. This effect has also been reported in a population-based study of twenty-five birth cohorts of Slovenian children. This study revealed that the share of children with poor physical fitness (defined as performance values found for children below the 5th percentile) and children with high physical fitness (defined as performance values above the 95th percentile) is 70% higher in 2007 birth cohorts compared to birth cohort in the year 1983 (Potočnik et al., Citation2020).
Since population-based studies are scarce, the aim of this study was to elucidate secular trends and the factors that may be influencing these trends. In the Sportcheck+ study, we assessed physical fitness and motor performance by a set of selected standardized tests in all first graders in the city of Basel annually from 2014 to 2021, i.e., in eight waves. Here, we describe the secular trends from 2014 to 2021 in cardiorespiratory fitness, sprint ability, a power-coordination test and balance performance as well as in body mass index. We examine further whether potential trends differ between boys and girls, between fit and unfit or between lean and overweight children. As the last two years of data acquisition were affected by the COVID-19 pandemic and corresponding non-pharmaceutical measures affected the life of children, particularly physical activity levels (Dunton et al., Citation2020), we also performed an exploratory analysis with regard to the potential impact of the pandemic on physical performance and body composition.
Materials and methods
Design and sample
The Sportcheck+ project is a large scale, cross-sectional, observational investigation examining physical fitness and motor performance in all first graders in the city of Basel and, thus, in an urban setting (Imhof et al., Citation2016). Sportcheck+ monitoring includes regular assessment of physical fitness in each school year between January and May, i.e., starting about six months after children entered school. Tests are performed during physical education lessons. Teachers and parents are informed at the beginning of the data collection and receive detailed information on the specific study objectives with the option to decline participation. In cases of absence or illness, an alternative measurement date was offered to the children. The study protocol and procedures are in compliance with the declaration of Helsinki and the study was approved by the regional ethics committee (Ethikkommission Nordwest- und Zentralschweiz, EKNZ, approval number 258/12).
In total, 10,953 children (girls n = 5370, boys n = 5583) were tested from eight school entry cohorts (2014 to 2021) which might be representative for similar cities regarding age, sex, anthropometrics, physical fitness and socioeconomic status. Due to the COVID-19 pandemic and school closings, the measurements had to be stopped after about half of the schools in 2020. Therefore, the sample is smaller, but still representative in terms of social status, migration background, motor performance and body composition. The measures affected the children’s lives as schools were closed for 34 days (March 17th 2020 to April 4th 2020), and participation and competition in organized sport were restricted or banned.
Sports facilities and recreational activities (indoor and outdoor) were closed from March 17th to May 11th and from November 23rd 2020 to March 1st 2021. Amateur sports for children were possible from May 11th to June 6th with restrictions (group size limited to a maximum of 5 children). From June 6th to November 23rd, children had no sports and recreational activities restrictions. However, children were not required to wear face masks during this time, and parks and playgrounds remained open at all times. The cohort in 2021 could be tested with the standard procedure, as the tests started in April 2021. Sample size of the exploratory analysis with regard to the potential impact of the pandemic comprised n = 5099 children including only schools that were also measured in the 2020 sample.
Methods and procedure
Data collection was conducted as part of a regular physical education classes and took place during the spring semesters. The tests were organized and carried out by trained instructors of our department. Data assessment consisted of anthropometric and motor performance measurements. Anthropometric data consisted of height determined without shoes using a wall-mounted stadiometer as well as body weight, measured in light clothing without shoes on a calibrated weight scale. BMI was calculated by dividing body weight in kg by height in metres squared. BMI percentile curves by age and gender were calculated according to the WHO reference tables (de Onis, Citation2007). Children were classified according to the CDC defining a risk for overweight as BMI above the 85th percentile and obesity as a BMI above the 95th percentile for age (2000 CDC Growth Charts for the United States, Citation2002). Motor performance was assessed by means of a balancing backwards test, by a sidewards jump test, a 20-m sprint and by a 20-m Shuttle Run Test. The following test descriptions refer to Imhof et al. (Citation2016).
We assessed dynamic balance by requesting children to balance backwards over 3 m long bars of three different widths. We started with a width of 6 cm, followed by 4.5 cm and finally 3 cm. The children were familiarized by balancing once forward and once backwards over the widest bar. We counted the number of steps until the child’s foot touched the floor. The maximum score per trial is fixed at 8. Three trials were performed for each bar width starting always from the wall. The sum of steps of these nine trials was used for analyses. The maximal possible number of steps is 72 (8×9). The intra-class correlation coefficient of this test is ICC = 0.8 in children (Cools et al., Citation2009).
We further assessed speed and coordination under time constraint by a jumping sidewards test (Cools et al., Citation2009). The children repeatedly and simultaneously jumped on alternating sides of a 2 cm wide wooden strip as many times as possible for 15 seconds. Five single test jumps for familiarization had to be performed per child prior to testing. This task was performed twice and the sum of valid jumps was taken for the analysis. The intra-class correlation coefficient of this test is ICC = 0.95 in children (Cools et al., Citation2009).
We assessed 20-m sprint times by means of electronic timing gates with a precision of 0.01 s (HL2–31, Tag Heuer, La Chaux-de-Fonds, Switzerland from 2015 to 2017 and WITTY, Microgate Srl, Bolzano, Italy, from 2018 to 2021; there were no systematic differences between the two devices regarding the measured sprint times; own unpublished data). The start followed an acoustic signal. Children conducted two runs and the faster of the two trials was analysed. The test has been shown to be reliable (r = 0.9) in children (Boes et al., Citation2001).
The 20-m shuttle run test is a widely used field-based measurement of cardiorespiratory fitness. The children ran back and forth a 20-m line. The initial running speed was 8.0 km/h with an increase of 0.5 km/h every minute, paced by beeps from an audio system. The maximal performance was achieved when the child did not cross a supporting line three metres in front of the 20 m line at the moment of the beep for two consecutive distances. The collected data during this test were the number of crossed 20 m lines at the moment of the beep. The test is reliable (r = 0.89) in children (Léger et al., Citation1988) and recommended for reasons of practicability in physical education settings as a validated test measuring aerobic fitness (van Mechelen et al., Citation1986).
Statistical analysis
Descriptive characteristics are analysed using means and standard deviations for the whole sample as well as every school entry cohort. The physical fitness tests were checked for normal distribution using histograms, skewness and kurtosis.
We compared the physical fitness scores over the years by multilevel modelling. The hierarchical structure of the data must be accounted for when estimating parameters. Therefore, multilevel modelling was the most accurate way of analysing clustered data with several levels (Twisk, Citation2006). The observation units in our analysis had two levels of hierarchy: the level-1 units were years and the level-2 units were schools. Unexplained variation between schools are expressed as “random effects”. Year, sex and BMI-percentile2 were added to the mixed effects model as “fixed effects” to explain variability at the individual and group level and to improve goodness of fit. BMI-percentile squared was used to account for the larger influence of extreme BMI-values in children as mentioned in previous studies (Kwieciński et al., Citation2018) that examined a quadratic relationship between physical fitness and BMI.
The lmer function in the lme4 package (Bates et al., Citation2015) for R was used for calculations. The model used Satterthwaite’s method for T-tests and was fitted by maximum likelihood. Estimates (absolute (“raw”) and baseline (2014) standardized (“relative”) beta coefficients) and 95% confidence interval were calculated and R2 is reported as a measure of explained variance with cut-off scores 0.01, 0.09 and 0.25 for small, medium and large model fit accuracy, respectively (Cohen, Citation1988).
We conducted three sub-analyses in order to test potential differences between (i) girls and boys, (ii) lean and overweight children, with children having a BMI above the 85th percentile being classified as overweight, and (iii) fit and unfit children, i.e., children with test scores in the upper (fit) or lower quartile (unfit) in each physical fitness test. To identify a possible influence of COVID-19 mitigation measures, population mean and confidence intervals of physical fitness and body composition of 2021 were predicted from the observed trends from 2014 to 2020. The difference between predicted and observed 2021 was calculated with 95% confidence intervals.
Results
Descriptive and summary data
The whole sample over the eight years period comprised n = 10’953 children (boys n = 5583; girls n = 5370).
The mean age of the children was 7.2 (±0.4) years and mean BMI was 16.0 (±2.4) kg/m2. Anthropometric data, percentage of overweight and obese children and detailed descriptive data for motor performance test scores are listed in for each year. Due to the measurements in 20-m sprint being rounded to only one decimal place compared to two in all the other years, the year 2014 was excluded from analysis for sprint performance.
Table 1. Descriptive characteristics. Mean ± standard deviation in anthropometric data and motor performance of participants overall and per year.
Balancing backwards
In the balancing backwards test, we identified a decline of 2.8% per year in the overall sample (, ). The decline was similar for boys (2.8% per year, , ) and girls (2.9%, , ). Unfit (3.3%) and overweight (3.6%) children showed a larger decline compared to fit (1.9%) and lean (2.6%) children (, ). In 2021, the average balancing backwards performance was 4.0% (95% CI: −0.5; 8.4) higher than what was predicted (). Especially boys “overperformed” in 2021 compared to their prediction (+7.8% (3.4; 12.5), ).
Figure 1. Secular trend in (a) balancing backwards, (b) 20-m sprint time, (c) jumping sidewards and (d) 20-m Shuttle Run Test for the lower quartile, the upper quartile and middle quartile from 2014 to 2021.
Figure 2. Secular trend in (a) balancing backwards, (b) 20-m sprint time, (c) jumping sidewards and (d) 20-m Shuttle Run Test for boys (dots, light grey) and girls (triangles, dark grey) from 2014 to 2021.
Figure 3. Secular trend in (a) balancing backwards, (b) 20-m sprint time, (c) jumping sidewards and (d) 20-m Shuttle Run Test for lean (light grey) and overweight (dark grey) children.
Table 2. Secular trends in various motor performance tests over years. Raw test score estimates [95% CI], R2 and p-value are presented for the overall sample (2014–2021) and various subsamples (boys and girls, fit and unfit children, lean and overweight children).
Table 3. Exploratory analysis with regard to the potential impact of the pandemic situation. Predicted and observed data [95% CI] are presented for motor performance tests and body composition in a sub-sample (n = 5099) and separately for boys and girls including only schools measured over the whole period 2014–2021.
Jumping sidewards
Performance in the jumping sidewards task increased by 1.3% per year in the overall sample (, ). We identified a larger increase for boys (1.6% per year) compared to girls (1.0%; , ). Secular changes of the overweight (1.3%) and lean (1.3%) children were similar (, ) and we observed only a negligible difference between fit (1.2%) and unfit (1.5%) children. In 2021, the cohort achieved 6.4% (3.7, 9.2) higher jumping scores as compared to predicted values ().
20-m sprint
For 20-m sprint time, we found a negligible change of −0.2% per year during the study period (, ). Similarly, we observed no relevant changes for boys and girls, lean (−0.2%), fit (−0.2%), overweight (0.1%) and unfit children (0.2%) (, ). We observed no deviation of the predicted data compared to the observed data when looking at the cohort affected by COVID-19 measures.
20-m shuttle run
For the 20-m Shuttle Run Test, we observed a negligible change of <0.1% per year for the overall sample (, ). Secular changes were similar for boys and girls (<0.1%, ). Overweight children slightly improved over time (0.4% per year) and a negligible decline of <0.1% per year was identified for lean children (, ). Fit children showed a negligible increase per year (0.2%) while unfit children improved by 0.6% per year (, ). The fittest girls decreased in the number of completed laps per year compared to the fittest boys (−0.3 [−0.6;0.0]). Children affected by COVID-19 measures showed a 6.1% (1.8, 10.4) higher 20-m SRT performance compared to the prediction ().
BMI
BMI in the overall sample declined by 0.7% per year (, ). Secular changes were similar for boys (−0.7%) and girls (−0.9%) (, ). The year 2021 slowed down the trend of decreasing BMI ().
Figure 4. Secular changes in BMI for a) the lower quartile, middle quartiles and the upper quartile as well as b) for boys (triangles, dark grey) and girls (dots, light grey) from 2014 to 2021. Exploratory analysis with regard to the potential impact of the pandemic situation on the proportion of overweight (c) and obese (d) children in a sub-sample (n = 5099) including only schools measured over the whole period 2014–2021.
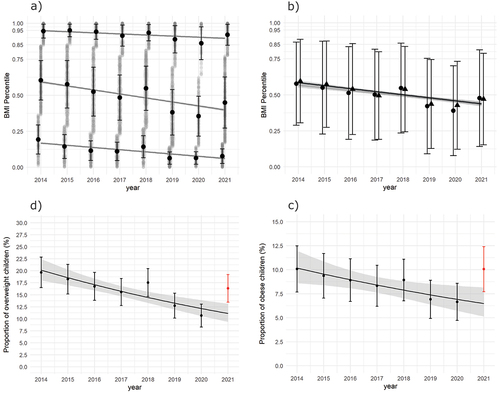
Table 4. Secular trends in BMI over years. BMI estimates [95% CI], R2 and p-value are presented for boys and girls in overall sample and for overweight and obese children (based on the CDC Growth Charts for the United States, Citation2002).
Overweight children
BMI shows a decline of −0.2% per year in overweight children. Secular changes were similar for boys and girls (, ). The observed increase in the percentage of overweight children in the cohort affected by COVID-19 measures is staggering. In 2021, 16.4% of the children were classified as overweight which is 47.4% (31.4, 63.3) more than was predicted (, ). We identified a larger increase for boys (56.6% (32.9, 80.3), ) compared to girls (35.5% (10.0, 61.0), ).
Obese children
In obese children, a small decline in BMI (−0.2%, , ) was identified for the time period 2014 to 2021. Secular changes in BMI were similar for boys and girls in overall sample (, ).
6.5% of children were predicted to be overweight in 2021. The observed data in 2021 also show an increase in the percentage of obese children in the cohort affected by COVID-19 measures as 10.1% of children were classified as obese (+55.9% (33.9, 77.9), , ). Boys (+70.4% (38.5, 102.3)) seem to be clearly more affected by COVID-19 measures than girls (+34.8% (−1.0, 70.6), ).
Discussion
The aim of this study was to analyse secular changes in motor performance and BMI in a representative sample of urban Swiss school children aged 6 to 8 years over the last eight years. The main findings of this study were a) a general downward trend in balancing backwards b) general improvements in BMI and jumping sidewards over the years, c) sex differences showing a steeper increase for boys in jumping sidewards and a steeper decrease for fit girls in 20-m SRT, d) increased performance in fit children in jumping sidewards task and unfit children in the 20-m SRT, e) the cohort affected by COVID-19 measures was associated with increased percentage of overweight and obese children and an increase in BMI but motor fitness test scores were mostly improved.
Motor coordination tasks including stability activities like balancing belong to the fundamental movement skills that provide the foundation for an active lifestyle (Hulteen et al., Citation2018). Our study results show a downward trend in balancing backwards which is in line with earlier secular declines in German preschool children from 1985 to 2007 (Roth et al., Citation2010). There might be several reasons for that decline like an increase of daily screen time (Saunders et al., Citation2014) leading to less time spent outside and thus fewer movement experiences.
Power under coordinative constraints was measured with the jumping sidewards task and showed improvements over the 8-years period for both sexes. 20-m sprint time, in contrast, showed negligible changes during the study period. These results are in line with recent studies (Fühner et al., Citation2021; Spengler et al., Citation2017) showing small increases in speed and strength for boys and girls. Boys showed in both tasks a slightly larger improvement over years compared to girls. Generally, it might be assumed that boys prefer to participate in strength-related activites whereas girls prefer sports activities that require more motor coordination abilities like balance or flexibility (Haywood & Getchell, Citation2009). As jumping sidewards also demands particular coordinative skills, it seems plausible that an increase in the relevance in motor coordination leads to a lower influence of sex as a performance limiting factor (Overman, Citation2004).
Cardiorespiratory endurance shows negligible changes in 6 to 8 years old children in Switzerland providing evidence that cardiorespiratory fitness remained constant in the past eight years. This finding is consistent with recent reviews (Fühner et al., Citation2021; L. Tomkinson et al., Citation2019), particularly, compared to high-income and upper-middle income countries. Furthermore, sex differences were found for the fit children with regard to a decline in girls compared to boys but the reason for the differences remains unclear. Different levels of motivation and differences in maintaining incentives for physical activity participation at school, through parent’s support and through lower participation in organized sport could be reasons to explain the sex differences in fit children (Telford et al., Citation2016). These potential factors should be considered in future intervention strategies to promote physical activity to increase physical fitness levels, especially in girls.
In our analysis, we particularly evaluated the upper and lower quartiles in all physical fitness tests because especially unfit children demand specific attention when promoting health behaviours to enhance physical fitness. We identified an increased performance in jumping sidewards over years in unfit children and increased performance in 20-m SRT over years in unfit and in overweight children. This tendency is encouraging as children with low levels of physical fitness are less likely to participate in sport activities due to less developed physical abilities (Hardy et al., Citation2012) and poor physical fitness levels during childhood are associated with negative health trajectories (Dwyer et al., Citation2009; Wedderkopp et al., Citation2004). Furthermore, overweight children have lower actual and perceived motor performance levels (Morano et al., Citation2011). Lower motivation for physical activity leads to fewer participation opportunities for exercise and, thus, fewer opportunities to improve their actual motor skills and perceptions of motor skills (Stodden et al., Citation2008). In particular, the perception of motor skills is an essential factor in the complex challenge of improving physical fitness in overweight children (Barnett et al., Citation2011). Therefore, enhancing the perception of motor skills should be included as a part of multicomponent approaches in the future.
The results are not in line with similar secular trend studies in other countries showing worsening results in low performing children (Albon et al., Citation2010; Wedderkopp et al., Citation2004). These studies, however, were conducted 10 to 20 years earlier and recent awareness of responsible political stakeholders might have led to the implementation of countermeasures. It remains unclear whether the improvements in 20-m SRT are already relevant from a public health perspective as the evidence supporting health-based, criterion-referenced thresholds for cardiorespiratory endurance in children is weak (Rollo et al., Citation2022).
Another promising observation was the continually decreasing proportion of obese or overweight children as well as BMI over years until 2020 with small fluctuations from year to year. A similar trend was observed in the national comparison of physical fitness tests and BMI for first graders in Winterthur, Switzerland (Gränicher, Citation2021). An international Non-Communicable-Disease Risk Factor Collaboration study showed that the rise in overweight children in high-income countries is levelling off and mean BMI in children is stabilizing (Abarca-Gómez et al., Citation2017), which is in line with our finding.
When comparing the cohorts before COVID-19 pandemic and the cohort in 2021, we observed an increase of children with overweight (16.4% overweight children in 2021 to 11.1% predicted) and an increase of obese children (10.1% in 2021 and 6.5% predicted). Boys were more affected in terms of percentage of overweight and obesity compared to girls. However, the reason for that remains unclear. The changing progression in the proportion of obese and overweight children since 2020 and the onset of the COVID-19 pandemic was also reported in the city of Winterthur in Switzerland (Gränicher, Citation2021).
Except for sprint times, improvements were found for all other parameters during COVID-19 pandemic. Thus, although more children were classified as overweight or obese, the children performed better. These findings are in contrast to studies in other countries showing a decrease in motor performance together with an increase in BMI and percentage of overweight and obesity in children (Basterfield et al., Citation2022; Jarnig et al., Citation2022).
Rossi et al. (Citation2021) state in a scoping review that generally children’s physical activity levels decreased during the pandemic. This effect was less pronounced or even not present when COVID-19 restrictions were less severe or when an increase in unstructured activities and outdoor play was possible (Rossi et al., Citation2021). COVID-19 mitigation measures were less rigorous in Switzerland compared to other countries with only a short time of school and sports club closure and open parks and playgrounds all the time. This could be an explanation for the improvements in motor performance. However, physical activity levels in children, mental health and eating behaviour were not assessed in our study.
Methodological considerations
The main strength of the study is the large population-based sample of children of the same age and an investigation period with several measuring points using a uniform methodology over years. Whereas not all previous secular trend studies in children accounted the clustered data with several levels to control for potentially varying social culture between schools, we did so. Further on, the analysis of quartiles, sex differences and the possible influence of COVID-19 mitigation measure allows a differentiated view of children’s physical fitness and anthropometric data over the past years for one of the biggest cities in Switzerland.
However, there are some limitations to be mentioned. Variables of social context for stratification and adjustments are missing. It remains speculative whether these issues relevantly affected our findings. The role of motivational aspects that affect the achieved scores in each physical fitness test is missing too. Furthermore, alternative tests for each physical fitness component exist. This leads to problems with regard to the comparability with secular trend studies from other countries since no uniform test batteries have been used in the different countries.
Conclusion
In summary, we observed a small decline of balance performance and an increase in the jumping sidewards task, whereas performance plateaus were detected in cardiorespiratory endurance and speed. Further, we found a continuous decrease in BMI and the proportion of obese and overweight children until the COVID-19 pandemic began. These recent deteriorations need to be observed and it remains unclear whether the reported changes in the cohort affected by COVID-19 mitigation measures can be reserved in the next years or if the effects are transitory. Further research regarding the continuation should also include longitudinal investigations to detect not only physical fitness levels and anthropometric data in cohorts at a certain time but also the developmental trajectories of the children. However, our study results provide important information about the fitness and health status of primary school children in Switzerland as well as about the cohort affected by COVID-19 mitigation measures.
Data availability statement
The data that support the findings of this study are available from the corresponding author (Lukas Nebiker), upon reasonable request.
Disclosure statement
No potential conflict of interest was reported by the authors.
Additional information
Funding
References
- 2000 CDC growth charts for the U.S. (2002). Public Health Service, Centers for Disease Control and Prevention. National Center for Health Statistics.
- Abarca-Gómez, L., Abdeen, Z. A., Hamid, Z. A., Abu-Rmeileh, N. M., Acosta-Cazares, B., Acuin, C., and Ezzati, M. NCD Risk Factor. (2017). Collaboration (NCD-RisC) Worldwide trends in body-mass index, underweight, overweight, and obesity from 1975 to 2016: A pooled analysis of 2416 population-based measurement studies in 128·9 million children, adolescents, and adults. The Lancet, 390(10113), 2627–2642. https://doi.org/10.1016/S0140-6736(17)32129-3
- Albon, H. M., Hamlin, M. J., & Ross, J. J. (2010). Secular trends and distributional changes in health and fitness performance variables of 10–14-year-old children in New Zealand between 1991 and 2003. British Journal of Sports Medicine, 44(4), 263. https://doi.org/10.1136/bjsm.2008.047142
- Barnett, L. M., Morgan, P. J., Van Beurden, E., Ball, K., & Lubans, D. R. (2011). A reverse pathway? Actual and perceived skill proficiency and physical activity. Medicine & Science in Sports & Exercise, 43(5), 898–904. https://doi.org/10.1249/MSS.0b013e3181fdfadd
- Basterfield, L., Burn, N. L., Galna, B., Batten, H., Goffe, L., Karoblyte, G., Lawn, M., & Weston, K. L. (2022). Changes in children’s physical fitness, BMI and health-related quality of life after the first 2020 COVID-19 lockdown in England: A longitudinal study. Journal of Sports Sciences, 40(10), 1088–1096. https://doi.org/10.1080/02640414.2022.2047504
- Bates, D., Mächler, M., Bolker, B., & Walker, S. (2015). Fitting linear mixed-effects models using lme4. Journal of Statistical Software, 67(1). https://doi.org/10.18637/jss.v067.i01
- Batista, M. B., Romanzini, C. L. P., Barbosa, C. C. L., Blasquez Shigaki, G., Romanzini, M., & Ronque, E. R. V. (2019). Participation in sports in childhood and adolescence and physical activity in adulthood: A systematic review. Journal of Sports Sciences, 37(19), 2253–2262. https://doi.org/10.1080/02640414.2019.1627696
- Boes, K., Tittlbach, S., Pfeifer, K., Stoll, O., & Woll, A. (2001). Motorische Verhaltenstests. In K. Bös (Ed.), Handbuch Motorische Tests (2., vollst. überarb. u. erw. Aufl., pp. 1–207). Hogrefe.
- Cohen, J. (1988). Statistical power analysis for the behavioral sciences (2nd ed.). L. Erlbaum Associates.
- Cools, W., Martelaer, K. D., Samaey, C., & Andries, C. (2009). Movement skill assessment of typically developing preschool children: A review of seven movement skill assessment tools. Journal of Sports Science & Medicine, 8(2), 154–168. https://www.jssm.org/jssm-08-154.xml%3EFulltext#
- de Onis, M. (2007). Development of a WHO growth reference for school-aged children and adolescents. Bulletin of the World Health Organization, 85(9), 660–667. https://doi.org/10.2471/BLT.07.043497
- Dunton, G. F., Do, B., & Wang, S. D. (2020). Early effects of the COVID-19 pandemic on physical activity and sedentary behavior in children living in the U.S. BMC Public Health, 20(1), 1351. https://doi.org/10.1186/s12889-020-09429-3
- Dwyer, T., Magnussen, C. G., Schmidt, M. D., Ukoumunne, O. C., Ponsonby, A.-L., Raitakari, O. T., Zimmet, P. Z., Blair, S. N., Thomson, R., Cleland, V. J., & Venn, A. (2009). Decline in physical fitness from childhood to adulthood associated with increased obesity and insulin resistance in adults. Diabetes Care, 32(4), 683–687. https://doi.org/10.2337/dc08-1638
- Eberhardt, T., Niessner, C., Oriwol, D., Buchal, L., Worth, A., & Bös, K. (2020). Secular trends in physical fitness of children and adolescents: a review of large-scale epidemiological studies published after 2006. International Journal of Environmental Research and Public Health, 17(16), 5671. https://doi.org/10.3390/ijerph17165671
- Fühner, T., Kliegl, R., Arntz, F., Kriemler, S., & Granacher, U. (2021). An update on secular trends in physical fitness of children and adolescents from 1972 to 2015: a systematic review. Sports Medicine, 51(2), 303–320. https://doi.org/10.1007/s40279-020-01373-x
- Gränicher, P. (2021). Motorische Fähigkeiten der Erstklässlerinnen und Erstklässsler der Stadt Winterthur 2021.
- Hamer, M., O’Donovan, G., Batty, G. D., & Stamatakis, E. (2020). Estimated cardiorespiratory fitness in childhood and cardiometabolic health in adulthood: 1970 British Cohort Study. Scandinavian Journal of Medicine & Science in Sports, 30(5), 932–938. https://doi.org/10.1111/sms.13637
- Hardy, L. L., Reinten-Reynolds, T., Espinel, P., Zask, A., & Okely, A. D. (2012). Prevalence and correlates of low fundamental movement skill competency in children. PEDIATRICS, 130(2), e390–e398. https://doi.org/10.1542/peds.2012-0345
- Haywood, K., & Getchell, N. (2009). Lifespan motor development. Human kinetics.
- Hulteen, R. M., Morgan, P. J., Barnett, L. M., Stodden, D. F., & Lubans, D. R. (2018). Development of foundational movement skills: a conceptual model for physical activity across the lifespan. Sports Medicine, 48(7), 1533–1540. https://doi.org/10.1007/s40279-018-0892-6
- Imhof, K., Faude, O., Donath, L., Bean-Eisenhut, S., Hanssen, H., & Zahner, L. (2016). The association of socio-economic factors with physical fitness and activity behaviours, spinal posture and retinal vessel parameters in first graders in urban Switzerland. Journal of Sports Sciences, 34(13), 1271–1280. https://doi.org/10.1080/02640414.2015.1109703
- Jaakkola, T., Yli-Piipari, S., Huotari, P., Watt, A., & Liukkonen, J. (2016). Fundamental movement skills and physical fitness as predictors of physical activity: A 6-year follow-up study: Motor skills, fitness, and physical activity. Scandinavian Journal of Medicine & Science in Sports, 26(1), 74–81. https://doi.org/10.1111/sms.12407
- Jarnig, G., Kerbl, R., & van Poppel, M. N. M. (2022). The impact of COVID-19-related mitigation measures on the health and fitness status of primary school children in Austria: A longitudinal study with data from 708 children measured before and during the ongoing COVID-19 pandemic. Sports, 10(3), 43. https://doi.org/10.3390/sports10030043
- Kwieciński, J., Konarski, J. M., Strzelczyk, R., Krzykała, M., Konarska, A., Bartkowiak, S., Lopes, V., & Malina, R. M. (2018). Non-linear relationships between the BMI and physical fitness in Polish adolescents. Annals of Human Biology, 45(5), 406–413. https://doi.org/10.1080/03014460.2018.1494306
- Larsen, L. R., Kristensen, P. L., Junge, T., Rexen, C. T., & Wedderkopp, N. (2015). Motor performance as predictor of physical activity in children: The CHAMPS study-DK. Medicine & Science in Sports & Exercise, 47(9), 1849–1856. https://doi.org/10.1249/MSS.0000000000000604
- Léger, L. A., Mercier, D., Gadoury, C., & Lambert, J. (1988). The multistage 20 metre shuttle run test for aerobic fitness. Journal of Sports Sciences, 6(2), 93–101. https://doi.org/10.1080/02640418808729800
- Lopes, V. P., Maia, J. A. R., Rodrigues, L. P., & Malina, R. (2012). Motor coordination, physical activity and fitness as predictors of longitudinal change in adiposity during childhood. European Journal of Sport Science, 12(4), 384–391. https://doi.org/10.1080/17461391.2011.566368
- Morano, M., Colella, D., Robazza, C., Bortoli, L., & Capranica, L. (2011). Physical self-perception and motor performance in normal-weight, overweight and obese children: Self-perception and performance in children. Scandinavian Journal of Medicine & Science in Sports, 21(3), 465–473. https://doi.org/10.1111/j.1600-0838.2009.01068.x
- Ortega, F. B., Ruiz, J. R., Castillo, M. J., & Sjöström, M. (2008). Physical fitness in childhood and adolescence: A powerful marker of health. International Journal of Obesity, 32(1), 1–11. https://doi.org/10.1038/sj.ijo.0803774
- Overman, W. H. (2004). Sex differences in early childhood, adolescence, and adulthood on cognitive tasks that rely on orbital prefrontal cortex. Brain and Cognition, 55(1), 134–147. https://doi.org/10.1016/S0278-2626(03)00279-3
- Potočnik, Ž. L., Jurak, G., & Starc, G. (2020). Secular trends of physical fitness in twenty-five birth cohorts of Slovenian children: A population-based study. Frontiers in Public Health, 8, 561273. https://doi.org/10.3389/fpubh.2020.561273
- Rollo, S., Fraser, B. J., Seguin, N., Sampson, M., Lang, J. J., Tomkinson, G. R., & Tremblay, M. S. (2022). Health-related criterion-referenced cut-points for cardiorespiratory fitness among youth: a systematic review. Sports Medicine, 52(1), 101–122. https://doi.org/10.1007/s40279-021-01537-3
- Rossi, L., Behme, N., & Breuer, C. (2021). Physical activity of children and adolescents during the COVID-19 pandemic—a scoping review. International Journal of Environmental Research and Public Health, 18(21), 11440. https://doi.org/10.3390/ijerph182111440
- Roth, K., Ruf, K., Obinger, M., Mauer, S., Ahnert, J., Schneider, W., Graf, C., & Hebestreit, H. (2010). Is there a secular decline in motor skills in preschool children? Motor skills in preschool children. Scandinavian Journal of Medicine & Science in Sports, 20(4), 670–678. https://doi.org/10.1111/j.1600-0838.2009.00982.x
- Ruiz, J. R., Castro-Pinero, J., Artero, E. G., Ortega, F. B., Sjostrom, M., Suni, J., & Castillo, M. J. (2009). Predictive validity of health-related fitness in youth: A systematic review. British Journal of Sports Medicine, 43(12), 909–923. https://doi.org/10.1136/bjsm.2008.056499
- Saunders, T. J., Chaput, J.-P., & Tremblay, M. S. (2014). Sedentary behaviour as an emerging risk factor for cardiometabolic diseases in children and youth. Canadian Journal of Diabetes, 38(1), 53–61. https://doi.org/10.1016/j.jcjd.2013.08.266
- Smith, J. J., Eather, N., Morgan, P. J., Plotnikoff, R. C., Faigenbaum, A. D., & Lubans, D. R. (2014). The health benefits of muscular fitness for children and adolescents: a systematic review and meta-analysis. Sports Medicine, 44(9), 1209–1223. https://doi.org/10.1007/s40279-014-0196-4
- Spengler, S., Rabel, M., Kuritz, A. M., & Mess, F. (2017). Trends in motor performance of first graders: A comparison of cohorts from 2006 to 2015. Frontiers in Pediatrics, 5, 206. https://doi.org/10.3389/fped.2017.00206
- Stodden, D. F., Goodway, J. D., Langendorfer, S. J., Roberton, M. A., Rudisill, M. E., Garcia, C., & Garcia, L. E. (2008). A developmental perspective on the role of motor skill competence in physical activity: an emergent relationship. Quest, 60(2), 290–306. https://doi.org/10.1080/00336297.2008.10483582
- Telford, R. M., Telford, R. D., Olive, L. S., Cochrane, T., Davey, R., & Buchowski, M. (2016). Why are girls less physically active than boys? Findings from the LOOK longitudinal study. PLOS ONE, 11(3), e0150041. https://doi.org/10.1371/journal.pone.0150041
- Tomkinson, G. R., Hamlin, M. J., & Olds, T. S. (2006). Secular changes in anaerobic test performance in Australasian children and adolescents. Pediatric Exercise Science, 18(3), 314–328. https://doi.org/10.1123/pes.18.3.314
- Tomkinson, L., J, J., & Tremblay, M. S. (2019). Temporal trends in the cardiorespiratory fitness of children and adolescents representing 19 high-income and upper middle-income countries between 1981 and 2014. British Journal of Sports Medicine, 53(8), 478–486. https://doi.org/10.1136/bjsports-2017-097982
- Tomkinson, G. R., & Olds, T. S. (2007). Secular changes in pediatric aerobic fitness test performance: the global picture. 21.
- Twisk, J. W. R. (2006). Applied multilevel analysis: a practical guide for medical researchers. Cambridge University Press. https://doi.org/10.1017/CBO9780511610806
- Utesch, T., Zinner, J., & Büsch, D. (2018). Stabilität der physischen Fitness im Kindesalter: Konstruktvalidität der Referenzkategorien für den Deutschen Motorik-Test 6–18 im Projekt „Berlin hat Talent“über fünf Jahre. German Journal of Exercise and Sport Research, 48(3), 404–414. https://doi.org/10.1007/s12662-018-0500-9
- van Mechelen, W., Hlobil, H., & Kemper, H. C. G. (1986). Validation of two running tests as estimates of maximal aerobic power in children. European Journal of Applied Physiology and Occupational Physiology, 55(5), 503–506. https://doi.org/10.1007/BF00421645
- Wedderkopp, N., Froberg, K., Hansen, H. S., & Andersen, L. B. (2004). Secular trends in physical fitness and obesity in Danish 9-year-old girls and boys: Odense school child study and Danish substudy of the European Youth Heart Study. Scandinavian Journal of Medicine and Science in Sports, 14(3), 150–155. https://doi.org/10.1111/j.1600-0838.2004.00365.x