
 ?Mathematical formulae have been encoded as MathML and are displayed in this HTML version using MathJax in order to improve their display. Uncheck the box to turn MathJax off. This feature requires Javascript. Click on a formula to zoom.
ABSTRACT
This study investigated micro-pacing strategies during sit para-biathlon. Six elite sit para-biathletes wore a positioning system device during the world-championships in three different competition formats (Sprint, Middle-distance, and Long-distance). Total Skiing Time (TST), penalty-time, shooting-time, and Total Race Time (TRT) were analysed. One-way analyses of variance were used to compare the relative contributions of TST, penalty-time, and shooting-time to TRT across the three race formats. Statistical parametric mapping (SPM) was used to determine the course positions (clusters) where instantaneous skiing speed was significantly associated with TST. The contribution of TST to TRT was lower for the Long-distance (80 ± 6%) compared to the Sprint (86 ± 5%) and Middle-distance (86 ± 3%) races, however this difference was not statistically significant (p > 0.05). The proportional contribution of penalty-time to TRT was significantly greater (p < 0.05) for the Long-distance (13 ± 6%) compared to the Sprint (5 ± 4%) and Middle-distance (4 ± 3%) races. Statistical parametric mapping (SPM) revealed specific clusters where instantaneous skiing speed was significantly associated with TST. For example, over all laps during the Long-distance race, the fastest athlete gained 6.5 s over the slowest athlete in the section with the steepest uphill. Overall, these findings can provide insights into pacing strategies and help para-biathlon coaches and athletes optimise training programmes to improve performance.
Introduction
Biathlon is a winter sport that involves the combination of cross-country (XC) skiing and precision rifle shooting, where athletes compete over a biathlon course of a certain distance (IBU, Citation2021). Since the 1988 Paralympic Winter Games in Innsbruck, biathlon has also been open to athletes with physical or visual impairments, also known as “para-biathlon”. Para-biathlon is performed as per able-bodied biathlon but with some adaptations. For example, competition is performed on an adapted course, where the total climb per lap is limited to between +35 m and +65 m and the distance of the shooting target is reduced from 50 m to 10 m (IPC, Citation2017). In addition, the distances of the various race formats are shorter than the distances of able-bodied biathlon (IPC, Citation2017). Furthermore, para-biathletes compete in different categories depending on their impairments, which includes athletes with a visual impairment, athletes with an upper-body or lower-body impairment who can compete in a standing position, and athletes with physical impairments who compete in a sitting position. Within each category, athletes are further divided into several classes depending on how much their impairment affects their performance (Visual Impairment: B1-B3; Standing: LW2-LW9; Sitting LW10-LW12). However, unlike many other para-sports, para-biathletes compete against athletes in other classes within the same category. A time factor is applied on the athlete’s race duration in an attempt to ensure even competition between athletes of different classes and functional impairments (Carlsen et al., Citation2022; IPC, Citation2017, Citation2020; Rosso et al., Citation2021).
In endurance sports, the ability to optimally distribute energy over the duration of a race, otherwise known as pacing, is a vital component to success (Abbiss & Laursen, Citation2008; Foster et al., Citation2005). Previous research has highlighted that pacing strategies can be influenced by many factors, such as sex, age, level of athlete and race format (e.g., more even pacing in higher ranked biathletes and more speed variation for women compared to men) (E. P. Andersson et al., Citation2019, Ardigò et al., Citation2020; Sollie et al., Citation2021; Staunton et al., Citation2022). Accordingly, it appears that the pacing strategy is dependent upon both the physical capacity of an athlete and the race format (Stöggl et al., Citation2018). However, it remains unknown what factors influence pacing strategies within para-biathlon (e.g., race formats).
It is well understood that XC skiing is an important component of biathlon performance (Dzhilkibaeva et al., Citation2019) where athletes must ski quickly and manage their efforts in order to maintain precision whilst shooting (Bjorklund et al., Citation2022; Hoffman et al., Citation1992; Langegger, Citation2019). Previous research has provided coaches with a good understanding of the lap-to-lap pacing strategies adopted within elite-level biathlon (Luchsinger, Kocbach, et al., Citation2019). For example, it is understood that top biathletes tend to adopt a “J-shaped” pacing strategy, where athletes start with a strong skiing effort before managing effort during the middle laps to maintain good shooting accuracy and finish the race with another strong skiing effort (Luchsinger, Kocbach, et al., Citation2019; Bjorklund et al., Citation2022). However, these lap-to-lap pacing analyses do not provide information about the performance and pacing strategies used within each lap (i.e., micro-pacing). Athletes might use micro-pacing strategies whereby they increase effort during specific sections of a course. For example, more recent research has investigated these micro-pacing strategies adopted during XC skiing (Ihalainen et al., Citation2020; Staunton et al., Citation2022) and reported that the best skiers separate themselves from the slower skiers during specific course sections, particularly in the uphill and transition sections between downhill and uphill.
Despite this, lesser attention in the sports science research has been given to biathlon (Luchsinger, Kocbach, et al., Citation2019,b), and no studies have investigated micro-pacing strategies in para-biathlon. In particular, the sitting category (SIT) of para-biathlon (classes LW10-LW12) is of special interest given these athletes use a different skiing position and apparatus (i.e., a specifically designed sledge) which impact the performance (Lund Ohlsson & Laaksonen, Citation2017). Unlike the other categories, where forward propulsion is generated using a variety of sub-techniques, the SIT biathletes can only use their upper body by pushing off with their poles (i.e., Upper-Body Double Poling technique) (Baumgart et al., Citation2019).
A better understanding of the performance and micro-pacing strategies used in SIT biathlon could assist the development of the sport and improve performance for future competitions. Further, analyses of pacing strategies in SIT biathlon could assist the identification of individual athlete’s strengths and weaknesses and help to formulate individualised training programmes. Accordingly, this study aimed to investigate the performance and micro-pacing strategies adopted during different SIT biathlon races. In particular, this study aimed to examine performance in different aspects of SIT biathlon (e.g., total skiing time, penalty time and shooting time) over different race formats, as well as examine which sections of skiing are particularly important for successful skiing performance (i.e., micro-pacing).
Methods
Participants
Six elite male para-biathletes volunteered to participate in this study. All para-biathletes competed in the SIT classification (LW10-LW12) and participated in all three biathlon races (Long-distance, Middle-distance and Sprint races). Four of the six athletes were classified as LW12 and had a time factor of 100% (i.e., no time adjustment). One athlete was classified as LW11.5 and had a time factor of 96% and one athlete was classified as LW10 and had a time factor of 87%. All athletes gave written informed consent before the study. Ethical approval for this study was granted by the Norwegian Centre for Research Data (ID 710992) and conducted in line with the Declaration of Helsinki.
Design
Data collection was conducted during the 2021 World Para Snow Sports Championships, Lillehammer, Norway. The format of the competition race was based on the World Para Nordic Skiing (WPSN) and was guided by the rules of the International Paralympic Committee (IPC, Citation2020). Each race was performed as a time trial event with a delayed start between all athletes. The Long-distance race was approximately 12.5 km of skiing distributed over five laps (approx. 2.5 km each) with four shooting bouts (one missed shot resulted in a 1 min penalty). The Middle-distance race, was approximately 10 km of skiing distributed over five laps (approx. 2 km each) with four shooting bouts, and the Sprint race was approximately 6 km of skiing distributed over three laps (approx. 2 km each) with two shooting bouts. For the Middle-distance and the Sprint races, one missed shot resulted in one penalty lap of ~150 m. For all classes, the shooting bouts were performed in the prone position. As per WPSN and IBU rules, para-biathletes do not carry the rifle during skiing, and it remains in place at the shooting range. The athletes competed with their own equipment (sledge, poles), with the exception of the rifle, which was provided by the race organisers.
A commercial GNSS sensor was worn by each athlete during competition (AdMos, Advanced Sport Instrument, Lausanne, Switzerland; dimensions 65 mm × 35 mm × 15 mm; mass: 35 g). The use of GNSS sensors to measure performance and pacing strategies (i.e., XC skiing speed), has been previously applied in able-bodied XC skiing by Gløersen et al. (Citation2018); Ihalainen et al. (Citation2020); Staunton et al. (Citation2022) and also in para-XC skiing (Baumgart et al., Citation2019). Approximately 30 min prior to the race, the GNSS sensors were placed outside in order to adapt to the climatic conditions and to allow the acquisition of satellite signals, in line with the manufacturer’s guidelines. The sensor was positioned on the athlete’s upper back between the scapulae using customised pouches attached the competition race bib. GNSS data were directly downloaded after the race onto personal computers for analyses. The GNSS sensor sampled positioning data at a frequency of 10 Hz with 30 cm of relative position accuracy in all directions, which is adequate to investigate sport performance (Malone et al., Citation2017), especially in biathlon skiing with moderate speeds and limited quick changes in direction.
Data analysis
The course for each race was separated into discrete uphill, flat and downhill sections as displayed in . Uphill was defined at any segment of the course with >2 m elevation change and were >30 m in length (shaded light grey). Downhill sections were defined as course sections with an elevation change of at least −2 m and greater than 200 m in length; or steeper sections less than 200 m in length with an elevation change of at least −6 m (shaded dark grey). Flat sections were defined as course sections more than 100 m with an elevation change between −2 and +2 m (moderate grey). Sections not fulfiling these criteria were considered “other” sections and were not included in track section analyses (shaded white). Due to different positions of the start, split and finish lines, the lap and section lengths varied slightly at the beginning and end of the lap. For example, the first lap of all three races was approximately 50 m longer because of the positioning of the start line. Accordingly, the beginning and end of the track were also not included as “sections” (shaded white).
Figure 1. Depiction of the para-biathlon course profile (Panel A: Long-distance race, 2.5 km loop; Panel B: Middle-distance race and Sprint race, 2 km loop without U4 and with D2 replaced by D2alt) with the shooting range and penalty loop sections removed for analyses of skiing pacing strategy.
In order to compare the skiing parameters/performances (time analysis) in the same location of the track and correct the GNSS positioning measurement, a coordinate mapping procedure was applied as described previously by Gløersen et al. (Citation2018), Ihalainen et al. (Citation2020) and Staunton et al. (Citation2022). Briefly, a common trajectory was used as a reference (i.e., reference track data). The reference trajectory corresponded with the coordinates of the fastest athlete from each race. First, the raw data from the reference trajectory were filtered with second-order low-pass Butterworth filter with a cut-off frequency of 5 Hz to remove artefacts created by postural movements (Gløersen et al., Citation2018). Second, data were interpolated to each integer metre using a second order cubic spline and filtered again with the same low-pass Butterworth filter used previously. These filter cut-off frequencies were selected from visual inspection of the power spectrum and are in line with the cut-off frequencies used in similar research (Jølstad et al., Citation2021; Staunton et al., Citation2022). Subsequently, these data were used to apply a coordinate mapping procedure to correct the positioning of all athletes to the same trajectory (Ihalainen et al., Citation2020; Staunton et al., Citation2022). Following this, the filtered GNSS data were corrected based on the minimum Euclidean distance (d) in two dimensions (latitude, longitude) (Equation 1) between the filtered reference track and the filtered race positioning data. For each position of the reference coordinates the minimum Euclidean distance was calculated throughout a window of 30 m. This permitted the calculation of instantaneous skiing speed at every 1 m integer of the skiing course for each athlete. All data were calculated according to the biathlete’s individual time factor (the speed was adjusted for time factors not equal to 100%). For all athletes with a time factor of 100% the time and speed were not adjusted.
Where = latitude reference coordinate,
= latitude athlete coordinate,
= longitude reference coordinate,
= longitude athlete coordinate
In order to permit analysis of the pacing strategies, the skiing and shooting components of each race were separated by excluding the shooting range (distance of 73 m; IPC, Citation2020) and the penalty loop from the GNSS race data. This permitted the calculation of the Total Skiing Time (TST) and Section Skiing Time (SST) in addition to the Total Race Time (TRT), penalty time and shooting time. TRT was the official result of the race released by competition organisation.
Statistical analyses
The normality of the data was confirmed using the Shapiro–Wilk test and the equality of variance with Levene’s test. Four separate one-way analyses of variance (ANOVA) were performed in order to compare the relative contributions of total skiing time (TST), Penalty Time and Shooting Time to the total Race Time (TRT), as well as the mean skiing speed between each race format. The main effects were followed up with pairwise comparisons using Bonferroni corrections. In order to determine which track sections were of greatest relevance to overall skiing time, relationships between TST and SST were determined using Pearson’s correlation coefficient (with 95% confidence intervals). Correlations were classified as follows: Poor: < 0.5, Moderate: 0.5 - < 0.7, Good: 0.7 - < 0.9, Excellent: ≥ 0.9. Consequently, a statistical parametric mapping (SPM) procedure was performed for each section where a significant (p < 0.05) correlation was found between TST and SST. SPM 1D one-tailed linear regression models were applied by using an SPM open-source procedure (Pataky, Citation2019) in MATLAB (The MathWorks Inc, 2019b). This procedure gives SPM{t} curves which represent the alpha values (with a critical threshold of α = 0.05) of the relationship between instantaneous speed (including time factor adjusted speed) at every 1 m with TST. When the SPM{t} curve exceeded the alpha threshold, it was deemed that instantaneous skiing speed was significantly related to TST. These track sections are termed SPM “clusters”.
Results
TRT, mean skiing speed, the proportional contribution of TST, Penalty Time and Shooting Time to TRT for each race format are displayed in . Despite differences between race formats in the magnitude of proportional contributions of TST to TRT, these did not reach statistical significance (p > 0.05). However, there were main effects for the proportional contributions of Penalty Time (F2,10 = 6.639, p = 0.008) and Shooting Time (F2,10 = 5.379, p = 0.016) to TRT. The proportional contribution of Penalty Time to TRT was greater for the Long-distance race compared to both the Sprint (mean difference Long-distance vs. Sprint: 7 ± 6%; p = 0.023) and the Middle-distance (mean difference Long-distance vs. Middle-distance: 9 ± 8%; p = 0.014) races. The proportional contribution of Shooting Time was greater for the Middle-distance race compared to the Long-distance race (mean difference: 3 ± 2%; p = 0.014) but not the Sprint (mean difference: 2 ± 1%; p = 0.414). There was a main effect for mean skiing speed between race formats (F2,10 = 13.600, p < 0.001). Mean skiing speed was lower for the Long-distance race compared to the Sprint (mean difference: Long-distance vs. Sprint: 0.6 ± 0.1 m·s−1; p < 0.001) and the Middle-distance race (mean difference Long-distance vs. Middle-distance: 0.5 ± 0.1 m·s−1; p = 0.001).
Table 1. Total Race Time and the proportional contributions of total skiing time, penalty time and shooting time for all race formats.
Correlation between Section Skiing Time (SST), Total Skiing Time (TST) and Total Race Time (TRT)
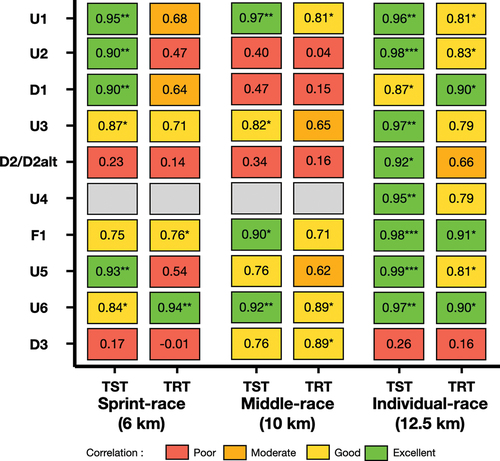
Significant relationships were found between SST and TST, as well as SST and TRT for different sections for all three races (). Statistical parametric mapping (SPM) was performed for each section where a significant (p < 0.05) correlation was found between TST and SST because these track sections were deemed to be of higher relevance to performance and overall skiing time.
Figure 2. Heatmap representing the summary of the Pearson correlation coefficients between Section Skiing Time (SST) and Total Skiing Time (TST) as well as between Section Skiing Time (SST) and Total Race Time (TRT) of all laps for all three races.
SPM analyses ‘Micro-pacing’
The SPM regressions revealed 21 “clusters” over the five laps of the Long-distance race, two clusters for the Middle-distance race (both occurring on the fifth lap), and six clusters for the Sprint race spread over the three laps.
displays the altitude profile and “cluster” locations (in green shaded area) for each lap of the Long-distance, Middle-distance and Sprint races. These “clusters” represent sections of the race where there were significant relationships between instantaneous skiing speed and TST. In addition, the total time gained within these “clusters” by the fastest athlete over the slowest athlete for each lap is displayed. The time gains by the fastest athlete over the slowest athlete were greatest for lap 5 of the Long-distance race where the fastest athlete gained 10.3 s on the slowest (Panel A). On the other hand, lap 3 of the sprint race was associated with a time gain of only 0.2 s between the fastest and slowest athlete (Panel B).
Figure 3. Altitude and “cluster” locations (in green shaded area) for each lap of the Long-distance (Panel A), Middle-distance and Sprint races (Panel B). The associated distance and time gained by the fastest athlete over the slowest athlete is displayed for each cluster as well as the total time gain for the entire lap.
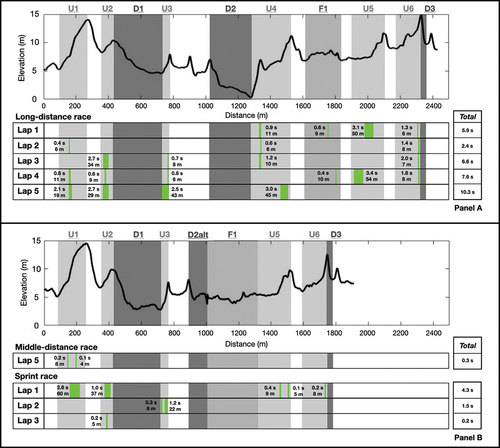
In particular, sections with the steepest gradients were associated with large time differences between the fastest and slowest athletes. For example, displays the altitude profile and the SPM{t} curve for section U6 on lap 2 of the Long-distance race. In this section, there was an 8 m cluster (t = −6.101, P < 0.05) that corresponded with a steep track section with an elevation of +1.1 m or a gradient of 14% (at 138–146 m of the section). Over this 8 m cluster, the fastest skier gained 1.4 s on the slowest skier. Over all laps in section U6 in the Long-distance race, the fastest skier gained 6.5 s on the slowest skier.
Figure 4. Elevation (Panel A), Statistical parametric mapping (Spm{t}) curve (Panel B) for U6 on lap 2 of the Long-distance race. The shaded area on the SPM{t} curve shows the course location where a significant relationship exists between Total Skiing Time (TST) and instantaneous skiing speed (at 138–146 m). *p < 0.05.
Discussion
This study analysed the performance and micro-pacing strategies in three different race formats in SIT para-biathlon. The main findings of this study were as follows: (1) the proportional contributions of TST, Penalty Time and Shooting Time to TRT varied according to the race format, which might reflect different pacing strategies in different race formats; (2) SPM regressions revealed specific track sections (clusters) where the instantaneous skiing speed was significantly correlated with TST; (3) SPM analyses are suitable to identify crucial track sections that might guide micro-pacing strategies in SIT biathlon.
An interesting finding from the present study was that the proportional contributions of TST, Penalty Time and Shooting Time varied according to the race format. Although not statistically different between race formats, the proportional contributions of TST to TRT were lowest for the Long-distance race. This coincided with a slower mean skiing speed in the Long-distance race compared to the other race formats. In addition, the proportional contribution of Penalty Time to TRT was statistically greater for the Long-distance race compared to the other two race formats. An obvious explanation for a lower skiing speed during the Long-distance race is pacing and development of fatigue due to the longer race distance. Indeed, longer race distances have different physiological requirements and thus, affect performance (Bernardi et al., Citation2013; Vanlandewijck et al., Citation2016). However, the Long-distance race was only 2.5 km longer than the Middle-distance race. Therefore, it could be argued that the difference in skiing speed between race formats cannot be solely explained by differences in race distance. Another possible explanation for the lower skiing speed during the Long-distance race is the increased penalty for shooting mistakes. In the Long-distance race, there was a one-minute penalty per shooting mistake, regardless of impairment class, which resulted in a significantly greater proportional contribution to the TRT. In contrast, there was a ~150 m penalty loop (~30 s) for the Middle-distance and Sprint races. As such, the penalty in the Long-distance race had greater consequences on TRT, as has also been demonstrated in able-bodied biathlon (Cholewa et al., Citation2005). These differences in shooting mistake penalties could explain an intentional use of lower speeds (i.e., pacing) in the Long-distance race in attempt to maintain a good shooting accuracy, and thus limit accumulating Penalty Time. Previous research has observed this same tactic in able-bodied biathletes (Bjorklund et al., Citation2022; Hoffman et al., Citation1992; Laaksonen et al., Citation2018; Langegger, Citation2019).
SPM analyses identified specific “clusters” in specific uphill and flat sections, but not in any downhill sections, where the faster athletes gained time during skiing compared to the slower athletes. These “clusters” tended to be present in parts of the uphill sections (U1, U3, U5, U6 in Sprint race; U1, U3, U4, U6 in Long-distance race), which is in line with previous research studies showing the importance of uphill sections to skiing performance in both able-bodied and para-ski athletes (Baumgart et al., Citation2019; Bernardi et al., Citation2013; Vanlandewijck et al., Citation2016). As shown by E. Andersson et al. (Citation2010) and Karlsson et al. (Citation2018), uphill sections are more energy demanding than the other sections, which leads to adoption of different pacing strategies. Consequently, as explained by Ihalainen et al. (Citation2020) for able-bodied XC skiers, slower athletes with lower physical fitness will reduce their skiing speed during the most demanding sections to adapt their energy consumption. This kind of tactical choice likely contributes to the race time differences between the faster and slower athletes (E. Andersson et al., Citation2010). These results suggest that SIT biathletes might adopt the same micro-pacing strategies as their able-bodied counterparts, where the best athletes increase effort during uphill sections in order to improve performance.
In particular, the results from the present study suggest that the steepest uphill sections are particularly important for sit skiing performance, which is in line with previous research showing a relatively higher metabolic intensity during uphill sections in sit-skiers compared to standing skiers, since they are limited to the Upper-Body Double Poling technique (Baumgart et al., Citation2019; Carlsen et al., Citation2022). For example, in section U6 in the Long-distance race, the fastest athlete gained 6.5 s over all laps, with much of these time gains observed in the steepest section as demonstrated in , which demonstrates an 8 m cluster, with a gradient of 14%. Greater time gains on the steepest part of the uphill sections could be due to a different micro-pacing strategy. Consequently, it is possible that the faster SIT biathletes took advantage of this and used these uphill sections as an opportunity to increase their effort to separate themselves from the slower athletes.
Methodological considerations
First, the small number of participants (six para-biathletes over the three races) reduces the power of the statistical analyses. Regardless, these data are representative of some of the best sit skiers in the world, a population that is severely under-represented in the scientific literature. Second, all data came from the same event/competition performed in only one location, which limits the generalisation of the findings to other race locations with different topography and environmental conditions. Nevertheless, the methodological approach used in this study is applicable to all track locations and can serve as a methodological guide for future performance analyses. Third, the methodological approach used in this study assumes that the effort distribution over the race is the result of a conscious mechanism (i.e., “pacing”). However, the differences in effort distribution could be due to different factors, such as equipment, fatigue or physical capacities as a result of conditioning or functional impairments. Further studies with more participants with different impairments and fatigue measurements (biomechanical and physiological) should be performed to extend and better understand the present findings. Finally, future studies should consider investigating lap-to-lap pacing strategies within SIT biathlon as these data can also provide important insights into race performance.
Conclusion
This study has shown that the XC skiing component of SIT biathlon played a major role in the final performance. The proportional contributions of TST, Penalty Time and Shooting Time to TRT varied according to the race format, which might reflect different pacing strategies in different race formats. For all race formats, specific sections (mostly uphill and some flat sections) were identified, where there were “clusters” with significant relationships between instantaneous skiing speed and TST. In particular, the steepest uphill sections were associated with the largest time gains for the fastest athlete over the slowest. The results of this study could be used to provide feedback to para biathlon coaches and athletes to guide pacing strategies and optimise training programmes.
Disclosure statement
No potential conflict of interest was reported by the authors.
Additional information
Funding
References
- Abbiss, C. R., & Laursen, P. B. (2008). Describing and understanding pacing strategies during athletic competition. Sports Medicine, 38(3), 239–252. https://doi.org/10.2165/00007256-200838030-00004
- Andersson, E. P., Govus, A., Shannon, O. M., & McGawley, K. (2019). Sex differences in performance and pacing strategies during sprint skiing. Frontiers in Physiology, 10, 295. https://doi.org/10.3389/fphys.2019.00295
- Andersson, E., Supej, M., Sandbakk, Ø., Sperlich, B., Stoggl, T., & Holmberg, H.-C. (2010). Analysis of sprint cross-country skiing using a differential global navigation satellite system. European Journal of Applied Physiology, 110(3), 585–595. https://doi.org/10.1007/s00421-010-1535-2
- Ardigò, L. P., Stöggl, T. L., Thomassen, T. O., Winther, A. K., Sagelv, E. H., Pedersen, S., Hammer, T. M., Heitmann, K. A., Olsen, O.-E., & Welde, B. (2020). Ski Skating Race Technique—Effect of Long Distance Cross-Country Ski Racing on Choice of Skating Technique in Moderate Uphill Terrain. Frontiers in Sports and Active Living, 2, 89. https://doi.org/10.3389/fspor.2020.00089
- Baumgart, J. K., Haugnes, P., Bardal, L. M., Østeras, S., Kocbach, J., & Sandbakk, Ø. (2019). Development of a framework for the investigation of speed, power, and kinematic patterns in para cross-country sit-skiing: A case study of an LW12 athlete. Frontiers in Sports and Active Living, 1, 4. https://doi.org/10.3389/fspor.2019.00004
- Bernardi, M., Janssen, T., Bortolan, L., Pellegrini, B., Fischer, G., & Schena, F. (2013). Kinematics of cross-country sit skiing during a Paralympic race. Journal of Electromyography and Kinesiology, 23(1), 94–101. https://doi.org/10.1016/j.jelekin.2012.07.004
- Bjorklund, G., Dzhilkibaeva, N., Gallagher, C., & Laaksonen, M. S. (2022). The balancing act between skiing and shooting – the determinants of success in biathlon pursuit and mass start events. Journal of Sports Sciences, 40(1), 96–103. https://doi.org/10.1080/02640414.2021.1976493
- Carlsen, C. H., Severin, C., Sandbakk, Ø., & Baumgart, J. K. (2022). Comparison of race time- differences between and within para and able-bodied cross-country skiers. Frontiers in Sports and Active Living, 3, 3. https://doi.org/10.3389/fspor.2021.823014
- Cholewa, J., Gerasimuk, D., Szepelawy, M., & Zajac, A. (2005). Analysis of structure of the biathlon runs. Acta Universitatis Palackianae Olomucensis Gymnica, 35(1), 35–42. https://www.gymnica.upol.cz/pdfs/gym/2005/01/04.pdf
- Dzhilkibaeva, N., Ahrens, M., & Laaksonen, M. S. (2019). Can performance in biathlon world cup be predicted by performance analysis of biathlon IBU cup? International Journal of Performance Analysis in Sport, 19(5), 856–865. https://doi.org/10.1080/24748668.2019.1665884
- Foster, C., Hoyos, J., Earnest, C., & Lucia, A. (2005). Regulation of energy expenditure during prolonged athletic competition. Medicine and Science in Sports and Exercise, 37(4), 670–675. https://doi.org/10.1249/01.MSS.0000158183.64465.BF
- Gløersen, Ø., Kocbach, J., & Gilgien, M. (2018). Tracking performance in endurance racing sports: Evaluation of the accuracy offered by three commercial GNSS receivers aimed at the sports market. Frontiers in Physiology, 9, 1425. https://doi.org/10.3389/fphys.2018.01425
- Hoffman, M., Gilson, P., Westenburg, T., & Spencer, W. (1992). Biathlon shooting performance after exercise of different intensities. International Journal of Sports Medicine, 13(3), 270–273. https://doi.org/10.1055/s-2007-1021265
- IBU. (2021). International Biathlon Union event and competition rules. Available online at: https://www.biathlonworld.com/
- Ihalainen, S., Colyer, S., Andersson, E., & McGawley, K. (2020). Performance and micro-pacing strategies in a classic cross-country skiing sprint race. Frontiers in Sports and Active Living, 2, 77. https://doi.org/10.3389/fspor.2020.00077
- IPC. (2017). World para nordic skiing rules and regulation 2017/2018.
- IPC. (2020). Explanatory guide to paralympic classification, paralympic winter sport. Available online at: https://www.paralympic.org
- Jølstad, P. A. H., Reid, R. C., Gjevestad, J. G. O., & Gilgien, M. (2021). Validity of the AdMos, advanced sport instruments, GNSS sensor for use in alpine skiing. Remote Sensing, 14(1), 22. https://doi.org/10.3390/rs14010022
- Karlsson, Ø., Gilgien, M., Gløersen, Ø. N., Rud, B., & Losnegard, T. (2018). Exercise intensity during cross-country skiing described by oxygen demands in flat and uphill terrain. Frontiers in Physiology, 9, 846. https://doi.org/10.3389/fphys.2018.00846
- Laaksonen, M. S., Finkenzeller, T., Holmberg, H.-C., & Sattlecker, G. (2018). The influence of physiobiomechanical parameters, technical aspects of shooting, and psychophysiological factors on biathlon performance: A review. Journal of Sport and Health Science, 7(4), 394–404. https://doi.org/10.1016/j.jshs.2018.09.003
- Langegger, D. (2019). Comparison of pacing strategies between sprint and individual biathlon competitions: Evaluation of speed and heart rate profiles. Submitted to the Faculty of Psychology and Sports Science Leopold-Franzens University, Innsbruck.
- Luchsinger, H., Kocbach, J., Ettema, G., & Sandbakk, Ø. (2019). The contribution from cross- country skiing and shooting variables on performance-level and sex differences in Biathlon world cup individual races. International Journal of Sports Physiology and Performance, 14(2), 190–195. https://doi.org/10.1123/ijspp.2018-0134
- Lund Ohlsson, M., & Laaksonen, M. S. (2017). Sitting position affects performance in cross-country sit-skiing. European Journal of Applied Physiology, 117(6), 1095–1106. https://doi.org/10.1007/s00421-017-3596-y
- Malone, J., Lovell, R., Varley, M.-C., & Coutts, A.-J. (2017). Unpacking the black box: Applications and considerations for using GPS devices in sport. International Journal of Sports Physiology and Performance, 12(s2), S2–18. https://doi.org/10.1123/ijspp.2016-0236
- Pataky, T. C. (2019). One-dimensional statistical parametric mapping in Python. Computer Methods in Biomechanics and Biomedical Engineering, 15(3), 295–301. https://doi.org/10.1080/10255842.2010.527837
- Rosso, V., Linnamo, V., Vanlandewijck, Y., Rapp, W., Fasel, B., Karczewska-Lindinger, M., Lindinger, S., & Gastaldi, L. (2021). Evaluating objective measures of impairment to trunk strength and control for cross-country sit skiing. Sports Engineering, 24(1), 6. https://doi.org/10.1007/s12283-021-00342-5
- Sollie, O., Gløersen, Ø., Gilgien, M., & Losnegard, T. (2021). Differences in pacing pattern and sub‐technique selection between young and adult competitive cross‐country skiers. Scandinavian Journal of Medicine & Science in Sports, 31(3), 553–563. https://doi.org/10.1111/sms.13887
- Staunton, C. A., Colyer, S. L., Karlsson, Ø., Swarén, M., Ihalainen, S., & McGawley, K. (2022). Performance and micro-pacing strategies in a freestyle cross-country skiing distance race. Frontiers in Sports and Active Living, 4, 4. https://doi.org/10.3389/fspor.2022.834474
- Stöggl, T., Pellegrini, B., & Holmberg, H.-C. (2018). Pacing and predictors of performance during cross-country skiing races: A systematic review. Journal of Sport and Health Science, 7(4), 381–393. https://doi.org/10.1016/j.jshs.2018.09.005
- Vanlandewijck, Y., Thompson, W., Vanlandewijck, Y. C., Thompson, W. R. (2016). Handbook of sports medicine and science: training and coaching the paralympic athlete. John Wiley & Sons, Ltd. https://doi.org/10.1002/9781119045144