
ABSTRACT
The main purpose of this study was to investigate the relationship among Achilles tendon (AT) dimensions, ankle joint stiffness, and footfall patterns in recreational rearfoot and non-rearfoot runners. Based on the foot strike index, a total of 107 runners were divided into rearfoot (47 females/40 males) and non-rearfoot runners (14 females/6 males). All participants had theirs AT dimensions (AT length, AT thickness, and AT moment arm) measured using a combination of ultrasound and motion capture systems. In addition, all performed running trials measured at self-selected speed in laboratory-neutral shoes. A partial correlation coefficient was used for correlations between the selected variables. The results revealed a significant relationship between ankle joint stiffness and level of footfall pattern in rearfoot (r = 0.232, p = 0.032) and non-rearfoot runners (r = -0.811, p < 0.001). The results also suggest a relationship between AT thickness and foot strike index (r = -0.486) in non-rearfoot runners. Runners whose footfall pattern is closer to the heel have greater ankle joint stiffness. Non-rearfoot runners whose footfall pattern is closer to the toe have a thinner AT. Non-rearfoot runners with thicker AT had greater ankle joint stiffness.
Introduction
The evolutionary process of the Achilles tendon (AT) and calcaneus from short to longer structures played a pivotal role in the birth of bipedal locomotion and endurance running (Bramble & Lieberman, Citation2004). AT contributes significantly to the resulting mechanical positive work of the ankle plantar-flexors during running, up to 75% (Monte et al., Citation2020). Current research evidence showed that AT length and AT moment arm length may influence the running economy and running performance (C. E. Hansen et al., Citation2021; Kunimasa et al., Citation2014; Scholz et al., Citation2008; Ueno et al., Citation2018). Several studies are consistent in stating that a shorter AT moment arm and longer AT is more beneficial for running economy (C. E. Hansen et al., Citation2021; Scholz et al., Citation2008; Ueno et al., Citation2018). A longer AT and shorter AT moment arm should positively contribute to the storage and return of more elastic strain energy. It could cause higher force production during the subsequent muscle contraction during running. A study by Foster et al. (Citation2021) provided an empirical mechanical explanation that a shorter AT moment arm increases the storage of more elastic strain energy during running. Moreover, a shorter AT moment arm may have a positive effect on the force-velocity relationship of skeletal muscles (C. E. Hansen et al., Citation2021; Ueno et al., Citation2018). In addition, a quasi-experimental study showed that AT length and AT moment arm appear to be associated with the ability to maintain footfall pattern constancy during intense endurance running (Urbaczka, Vilimek, et al., Citation2022). However, it is not clear whether footfall patterns can be associated with different AT lengths, AT thicknesses, or AT moment arms.
Footfall pattern is a heavily discussed topic in the running literature. Gruber et al. (Citation2011) present footfall patterns as key to running efficiency. However, a number of studies that have investigated footfall patterns and running economy are not unified in their opinion of which footfall pattern during running is the most economical (Hamill & Gruber, Citation2017; Melcher et al., Citation2017). From an injury prevention perspective, a retrospective study by Hollander et al. (Citation2021) suggested that a midfoot footfall pattern is associated with AT running injuries. This can be explained by the higher AT loading, stress, and impulse in runners with a forefoot strike pattern compared to runners using a rearfoot strike pattern (Gruber et al., Citation2011; Rice & Patel, Citation2017).
Hamill et al. (Citation2014) showed lower ankle joint stiffness and higher knee joint stiffness in forefoot runners compared to rearfoot runners. However, Kubo et al. (Citation2015) compared directly AT stiffness between highly trained runners with different footfall patterns (rearfoot, midfoot, and forefoot) and reported no significant differences. Wearing et al. (Citation2019) assessed the AT behaviour during running in recreational runners using an acoustic transmission technique. These authors showed that the peak ultrasound transmission velocity in the AT is significantly higher in forefoot runners compared to rearfoot runners indicating specific loading of AT according to footfall pattern.
Therefore, the primary aim of this study was to determine the relationship among AT dimensions, ankle joint stiffness, and footfall patterns in recreational rearfoot and non-rearfoot runners. If a longer AT has more potential energy storage and returns more elastic energy during running, we hypothesized that a positive relationship will be found between AT length and footfall pattern mainly in the non-rearfoot group of runners. Moreover, we know that AT is significantly more loaded during non-rearfoot running (Gruber et al., Citation2011; Rice & Patel, Citation2017). Tendon hypertrophy can occur during short-term resistance training or high-load training (Geremia et al., Citation2018). Therefore, our second hypothesis is that a thicker AT will be related to the level of footfall pattern more over the toe, especially in non-rearfoot runners.
Methods
Participants
This is a further analysis from the data collection of a prospective study investigating biomechanical risk factors associated with running-related injuries. A total of 107 recreational runners (61 female and 46 male) aged 18–57 years participated in this study. Runners were recruited through digital advertising on social media. None of the runners had any previously diagnosed running injuries at the study entry. In addition, participants had no musculoskeletal problems affecting their running activity 6 months prior to study entry. The foot strike index (%) was analysed during overground running biomechanics at self-selected endurance speed to categorize runners with different footfall patterns (Altman & Davis, Citation2012). The length of the whole foot corresponds to 100%. The recreational runners with a foot strike index of 0–33% or 33.01–100% were categorized as rearfoot runners (87) or non-rearfoot runners (20), respectively. Using the G*Power, the sensitivity of the correlation tests was determined for a sample size of 87 and 20 participants (Brysbaert, Citation2019). A partial correlation coefficient with 87 and 20 participants is sensitive to effects of r = 0.263 and r = 0.525 with 80% power (α = 0.05), respectively. Therefore, the study will not be able to reliably detect correlations smaller than r = 0.263 (87 rearfoot runners) and r = 0.525 (20 non-rearfoot runners). shows the basic descriptive characteristics of rearfoot and non-rearfoot runners. All participants agreed to enter the study by signing an informed consent form. This study was approved by the ethics committee of the University of Ostrava (OU-54483/49–2019).
Table 1. Basic characteristics of the participants and variables investigated in rearfoot and non-rearfoot runners.
Experimental set-up
Anthropometric data were measured using a body composition analyser (InBody 770, South Korea) and Stadiometer (InBody BSM370, South Korea). A diagnostic ultrasound system (Mindray, Mindray Z5, orthopaedic mode 10 MHz, Shenzhen, China) with a 50 mm electronic linear ultrasound transducer probe (Mindray, Mindray 75L38EA, Shenzhen, China) was used to measure AT thickness and detect AT insertions. Biomechanical analysis of overground running at self-selected endurance speed was measured using a motion capture system (1× Oqus 510+ and 9× Oqus 700+, Qualisys, Inc., Gothenburg, Sweden) and force plate (Kistler 9287CCAQ02, Kistler Instruments AG, Winterthur, Switzerland). The sampling frequencies of the motion capture system and force plate were 240 Hz and 2160 Hz, respectively. Running speed was controlled by two photocells (OPZZ, EGMedical s.r.o., Brno, Czech Republic).
Protocol
All participants visited the biomechanics laboratory on a single occasion. At the beginning of the measurements, each participant completed the demographic and Victorian Institute of Sports Assessment – Achilles Questionnaire (VISA-A) translated into the Czech language, which serves as an index of assessment of the severity of Achilles tendinopathy (Robinson, Citation2001; Skypala Citation2023). Afterwards, the participant was familiarized with the testing protocol. Subsequently, the participant’s body composition was measured.
AT length was measured by using a combination of a diagnostic ultrasound system and a motion capture system. AT length was determined from the proximal attachment of the calcaneus osteotendinous junction to the musculotendinous junction of the mid-point of the lateral and medial heads of the gastrocnemius. The technique of measuring the AT length is described in more detail elsewhere (Skypala et al., Citation2019). The AT thickness was detected using the diagnostic ultrasound system at a point 2 cm proximal to the calcaneal insertion (Cassel et al., Citation2015). The AT moment arm was determined as the perpendicular distance between the ankle joint centre and AT (Scholz et al., Citation2008) using a motion capture system. From the medial and lateral malleoli, the perpendicular distances to the skin were marked to the AT. A midpoint was specified between these marked points. Retroreflective markers (9.5 mm diameter) were located at the marked midpoint on the AT, medial and lateral malleoli. The testing mentioned above was measured three times on the right lower limb.
Afterward, the biomechanics of running at self-selected endurance speed were collected. Marker placement at selected anatomical locations on the pelvis and lower extremities was chosen based on a study by (Malus et al., Citation2021). A total of 24 retroreflective markers were placed bilaterally on the posterior and anterior superior iliac spine, greater trochanter of the femur, lateral/medial femoral epicondyle, lateral/medial malleolus, distal first/fifth metatarsal head and triad markers were positioned on the heels. In addition, marker cluster plates with four fixed markers were located on the thighs and shanks. After standing calibration measurement, a separate measurement of overground running biomechanics was performed at a self-selected endurance speed. The participant’s self-selected endurance speed was determined by asking the participant their usual 45-min running pace. Then, each participant ran at this pace continuously for 2 min around the runway, and in the last 30 s, the speed of six runs was recorded by photocells. The average of the six runs determined their self-selected running speed. A more detailed description of the self-selected endurance speed setting has been presented in previous studies (Jandacka et al., Citation2020; Skypala Citation2023). Participants ran on a 17-m-long running lane in neutral running shoes with a 10 mm drop (Brooks Launch 5, Brooks Sport Inc., Seattle, Washington, USA). A successful running trial was considered to result when the self-selected speed was within ±3% of the set speed and the right foot was on the force plate during the whole stance phase. A total of eight valid trials were collected for each participant. All testing mentioned above was performed by a single evaluator.
Data analysis
AT length, AT moment arm, and biomechanics of running were processed in the Qualisys Track Manager (Qualisys, Inc., Gothenburg, Sweden) and Visual 3D v6 software (C-Motion, Inc., Germantown, Maryland, USA). AT length was analysed between the Calcaneus-Gastrocnemius on the right lower limb. We presented a detailed description of the AT length analysis elsewhere (Skypala et al., Citation2019). AT length was normalized to the length of the shank (AT length/Shank length × 100). The AT moment arm was determined by the perpendicular distance between the reflective marker on the AT and the joint centre of the ankle. The AT moment arm was normalized to the length of the foot (AT moment arm/Foot length × 100).
A skeletal model of the pelvis, thigh, shank and foot on the right lower limb was created for the running biomechanics data (Malus et al., Citation2021). Standing calibration measurements were used to define proximal and distal skeletal segments and to determine the local coordinate system. A fourth-order Butterworth low-pass filter with a cut-off frequency of 50 Hz and 12 Hz was applied to the ground reaction force data and kinematic data, respectively. Three-dimensional kinematics of foot, ankle, knee, and hip joint angles were analysed at initial contact during the stance phase. Ankle joint stiffness during the energy absorption phase was analysed (Hamill et al., Citation2014). Ankle joint stiffness was determined as the ∆ankle joint moment/∆ankle joint angle. Δankle joint moment is the difference between the joint moment at initial contact and at that at maximum ankle dorsiflexion. Δankle joint angle is the difference in the angle at initial contact and at that at maximum ankle dorsiflexion (Hamill et al., Citation2009, Citation2014). Therefore, the maximum ankle dorsiflexion during the stance phase was additionally determined. In addition, the net ankle joint moment during initial contact and maximal ankle dorsiflexion in the sagittal plane were calculated using a Newton-Euler inverse dynamics technique (Robertson et al., Citation2014).
Statistical analysis
Basic descriptive statistics of anthropometric, biomechanical data, and AT dimensions were calculated for both groups of runners with different footfall patterns. The partial correlation coefficient was used to determine the relationship between the variables AT dimensions x foot strike index, foot, ankle (plantarflexion and dorsiflexion), knee (flexion and extension), and hip (flexion and extension) joint angles at initial contact during the stance phase in the sagittal plane. Furthermore, the partial correlation coefficient was used to determine the relationship between ankle joint stiffness and AT dimensions, foot strike index, and joint angles at initial contact. Because different running speeds affect all these biomechanical variables (Schache et al., Citation2011) for these partial correlation analyses, we controlled the relationship of the tested variables by self-selected endurance running speed and age. In addition, the coefficient of determination was calculated for all correlation analyses. Since the possibility of false positive correlations increases with the number of correlations performed, correlations for multiple tests were corrected using the Benjamini-Hochberg method (Ghosh, Citation2020). Based on the normality of the data distribution (Shapiro-Wilk test) a parametric or nonparametric independent T-test was performed to compare selected parameters between rearfoot and non-rearfoot runners. All statistical tests were performed in IBM SPSS Statistics software (version 24, IBM SPSS Inc., Chicago, Illinois, USA). The level of statistical significance was adjusted to p < 0.05.
Results
Differences between populations
The mean values of AT dimensions, foot strike index, joint angles, and ankle joint stiffness for both groups of runners with different footfall patterns are presented in . These parameters were compared between rearfoot and non-rearfoot runners. Significant differences between groups were found for mass (p = 0.006), BMI (p = 0.001), foot strike index (p < 0.001), ankle joint stiffness (p < 0.001), knee (p = 0.001), ankle (p < 0.001), and foot angle (p < 0.001) at initial contact during stance phase.
Correlations between parameters in rearfoot runners
In runners with rearfoot footfall pattern, no significant partial correlation coefficients were found between AT dimensions and foot strike index, foot, ankle, knee, and hip joint angles at initial contact of the stance phase during running (). The results of this study suggest a significant relationship between ankle joint stiffness and ankle angle (r = 0.232, p = 0.032) at initial contact (). A partial correlation coefficient with 87 participants is sensitive to the effects of r = 0.263. Based on this, we cannot reliably detect that this relationship is statistically significant. Even after applying Benjamini–Hochberg corrections, the relationship was not statistically significant (r = 0.232, p = 0.368). Furthermore, ankle joint stiffness was not significantly related to the variables AT length (r = −0.023), AT thickness (r = 0.156), relative AT moment arm (r = −0.062), knee (r = 0.148), and hip (r = −0.088) angle during initial contact.
Figure 1. Relationship between ankle joint stiffness and variables describing footfall pattern in rearfoot and non-rearfoot runners (a-c). Figure d shows the relationship between ankle joint stiffness and Achilles tendon thickness. p (BH) – p-value after applying Benjamini-Hochberg correction.
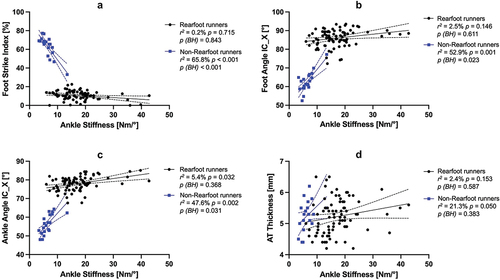
Table 2. The relationship between Achilles tendon dimensions and footfall pattern expressed by a partial correlation coefficient.
Correlations between parameters in non-rearfoot runners
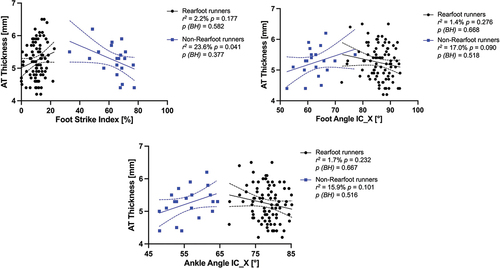
In testing the relationship between AT dimensions and footfall pattern in non-rearfoot runners, a significant relationship was found only between AT Thickness and foot strike index (r = −0.486, p = 0.041), which represents the level of footfall pattern (, ). Furthermore, significant correlations were found between ankle joint stiffness and foot strike index (r = −0.811, p < 0.001), foot angle (r = 0.727, p = 0.001), and ankle angle (r = 0.690, p = 0.002) at initial contact (). Moreover, shows positive correlations between ankle joint stiffness and AT thickness (r = 0.462, p = 0.050). A partial’s correlation coefficient with 20 participants is sensitive to the effects of r = 0.525. Therefore, we can claim that we could only reliably detect the relationships between ankle joint stiffness and foot strike index, foot angle, and ankle angle. This claim was confirmed by the results of the Benjamini–Hochberg corrections, where significant relationships between ankle joint stiffness and foot strike index, foot and ankle angle remained after their application (). Lastly, ankle joint stiffness was not significantly related to the variables AT length (r = −0.168), relative AT moment arm (r = 0.106), knee (r = 0.262), and hip (r = −0.160) angle during initial contact.
Figure 2. Relationship between Achilles tendonthickness and variables describing footfall pattern in rearfoot and non-rearfoot runners.
Discussion
The aim of this study was to determine the relationship between AT dimensions, ankle joint stiffness, and footfall pattern in recreational rearfoot and non-rearfoot runners. We hypothesized that a positive relationship will be found between AT length and footfall pattern mainly in non-rearfoot runners. The second hypothesis was that thicker AT would be related to the level of footfall pattern more across the toe mainly in non-rearfoot runners. However, no significant relationship was found between AT length and footfall pattern in both investigated groups. Current knowledge suggests that longer AT and shorter AT moment arms positively affect the running economy (C. E. Hansen et al., Citation2021; Scholz et al., Citation2008; Ueno et al., Citation2018). Since a longer AT should have the potential to store more elastic strain energy (McCarthy et al., Citation2006), we also hypothesised that this would allow runners to run more over the toe, which research findings lead to the generation of more resultant AT force (Rice & Patel, Citation2017). However, this was not also confirmed, and no relationship was found between AT length and foot strike index, foot angle, and lower limb joint angles at initial contact of the running stance phase in rearfoot and non-rearfoot runners. Therefore, our data suggest that the choice of footfall pattern does not seem to be related to AT length and AT moment arm even though both parameters may influence running economy. Nevertheless, a study by Urbaczka, Silvernail, et al. (Citation2022) suggested that these two parameters are related to the ability to maintain footfall pattern stability during endurance running.
Our second hypothesis was also not confirmed. It has been conclusively shown that the AT is significantly more loaded in non-rearfoot running than in rearfoot running (Gruber et al., Citation2011; Rice & Patel, Citation2017). The literature shows that short-term resistance training or a high-load training program can cause tendon hypertrophy (Geremia et al., Citation2018). Thus, we would suggest that there may be more adaptation of AT thickness (thicker) than in rearfoot running. Therefore, it is a very surprising result that non-rearfoot runners have a higher foot strike index value (i.e., running more over the toe) and have a thinner AT (). Based on the resulting partial correlation coefficient for this relationship (r = −0.486) which is just less than the sensitivity of the correlation test for 87 participants (r = 0.525), it cannot be claimed that this relationship has been reliably detected. The relationship between AT thickness and foot strike index can be explained by the study by Biewener and Roberts (Citation2000) which points out that a thinner AT should resist more stress and more strain when a given force is applied, which contributes to the storage and subsequent generation of more elastic strain energy than would be the case with a thicker AT. As the design of this study is cross-sectional, we can only speculate whether the thinner AT in non-rearfoot runners who run more over the toe is an adaptation to this level of footfall pattern or does a thinner AT allows running more over the toe.
The AT has the ability to adapt to different types of loading (Cassel et al., Citation2015; P. Hansen et al., Citation2003). However, this is not confirmed for endurance running. When after 9 months of running training, there was no change in the cross-sectional area of the AT in novice runners (P. Hansen et al., Citation2003). A thinner AT could potentially be an advantage during running where a stretch-shortening cycle occurs regularly. This was confirmed by Biewener and Roberts (Citation2000) who further added that a thinner and longer AT should have a positive effect on a more potent stretch-shortening cycle. There also may be an explanation that a thinner AT in non-rearfoot runners allows them to run more over the toe and use more of the stretch-shortening cycle potential of the AT, thus using more elastic strain energy. However, this possible explanation is not supported by some studies in the literature that report that there is no significant difference in the stored elastic strain energy in the AT of rearfoot or forefoot runners (Swinnen et al., Citation2019; Yong et al., Citation2020). In contrast, a thinner AT reduces AT stiffness and that results in lower a running economy (Fletcher et al., Citation2013). Nevertheless, the relationship between AT thickness and running economy has not yet been investigated in the research evidence.
In this study, we found an association between ankle joint stiffness and the level of footfall pattern in both groups of runners (). In addition, ankle joint stiffness was significantly related to initial contact foot angle and ankle angle, which can be considered as variables describing the footfall pattern (Urbaczka, Silvernail, et al., Citation2022). Our results that ankle joint stiffness increases with more heel strike confirms an earlier study finding by Hamill et al. (Citation2014) that the rearfoot footfall pattern has greater ankle joint stiffness than the forefoot footfall pattern. Moreover, our findings suggest that ankle joint stiffness depends not only on the footfall pattern but also on the level of the footfall pattern. In addition, our study found a relationship that, non-rearfoot runners with thicker AT had greater ankle joint stiffness (). The result is interesting as this relationship exists between AT thickness (or cross-sectional area) and AT stiffness (Ker et al., Citation1988). However, this study lacks information on AT stiffness, which is a significant limitation, but the results of a study by Kubo et al. (Citation2015) found no significant differences in AT stiffness between the footfall pattern of rearfoot, midfoot, and forefoot. Higher stiffness of the AT positively affects running economy (Fletcher et al., Citation2013), while this is not the case for ankle joint stiffness (Melcher et al., Citation2017). In addition, the current prospective study by Davis and Gruber (Citation2021) suggests that leg, knee, and ankle joint stiffness may not even be an important factor in the development of running injuries. However, this prospective study did not perform analyses on individual injury areas but included all injuries together. So far, however, we do not know what relationship exists between AT stiffness and ankle joint stiffness.
Limitations
A possible limitation of the present study is its cross-sectional design. The main limitation of this study is the lack of information on the AT stiffness and AT force produced during running at different levels of footfall pattern. These variables would have aided in the strength of the study design and the interpretation of our findings. To better understand the relationship between AT thickness and footfall pattern, it would be helpful to know more detailed information about the running history and other information about the supplemental physical activity of the participants. Another limitation may be the non-inclusion of the gender factor in our analyses, as males have a thicker AT and a larger cross-sectional area of the AT than females (Zhang et al., Citation2021).
For future studies, we could detect the AT thickness not only in one location but also analyse the thickness throughout the free AT length (Devaprakash et al., Citation2020). When a runner is fatigued there is a change in their running biomechanics (Urbaczka, Silvernail, et al., Citation2022; Weir et al., Citation2019). Therefore, we must consider that our results show relationships between selected variables when runners were not fatigued.
Conclusion
The main finding of this study is that ankle joint stiffness decreases in runners as the footfall pattern moves from heel to toe. We observed a positive relationship between AT thickness and ankle joint stiffness, suggesting that the non-rearfoot runners with the higher AT thickness were those with the higher values of ankle joint stiffness. Furthermore, we observed a negative relationship between AT thickness and foot strike index, where the non-rearfoot runners with lower values of AT thickness were those with higher foot strike index. In the rearfoot runners, no relationship was found between AT dimensions and the foot strike index, ankle joint stiffness, foot angle, and lower limb joint angles at initial contact of the stance phase, suggesting that AT dimensions play a different role as a function of footfall technique. Further research might investigate could address the question of whether there is a relationship between AT thickness and running economy. Additionally, research should look at whether different AT dimensions may also influence AT loading in different footfall patterns of running and thus contribute to AT overload even during fatigue running. These investigations should include the use of magnetic resonance imaging and T2* measurements of the AT to determine the relationship between the quality of the AT tissue and AT dimensions.
Disclosure statement
No potential conflict of interest was reported by the authors.
Additional information
Funding
References
- Altman, A. R., & Davis, I. S. (2012). A kinematic method for footstrike pattern detection in barefoot and shod runners. Gait & Posture, 35(2), 298–300. https://doi.org/10.1016/j.gaitpost.2011.09.104
- Biewener, A. A., & Roberts, T. J. (2000). Muscle and tendon contributions to force, work, and elastic energy savings: A comparative perspective. Exercise and Sport Sciences Reviews, 28(3), 99–107.
- Bramble, D. M., & Lieberman, D. E. (2004). Endurance running and the evolution of Homo. Nature, 432(7015), 345–352. https://doi.org/10.1038/nature03052
- Brysbaert, M. (2019). How many participants do we have to include in properly powered experiments? A tutorial of power analysis with reference tables. Journal of Cognition, 2(1), 1–38. https://doi.org/10.5334/joc.72
- Cassel, M., Carlsohn, A., Fröhlich, K., John, M., Riegels, N., & Mayer, F. (2015). Tendon adaptation to sport-specific loading in adolescent athletes. International Journal of Sports Medicine, 37(2), 159–164. https://doi.org/10.1055/s-0035-1559772
- Davis, J. J., & Gruber, A. H. (2021). Leg stiffness, joint stiffness, and running-related injury: evidence from a prospective cohort study. Orthopaedic Journal of Sports Medicine, 9(5), 1–8. https://doi.org/10.1177/23259671211011213
- Devaprakash, D., Obst, S. J., Lloyd, D. G., Barrett, R. S., Kennedy, B., Ball, I., Adams, K. L., Collings, T. J., Davico, G., Hunter, A., Vlahovich, N., Pease, D. L., & Pizzolato, C. (2020). The free achilles tendon is shorter, stiffer, has larger cross-sectional area and longer T2* Relaxation time in trained middle-distance runners compared to healthy controls. Frontiers in Physiology, 11, 1–10. https://doi.org/10.3389/fphys.2020.00965
- Fletcher, J. R., Pfister, T. R., & MacIntosh, B. R. (2013). Energy cost of running and Achilles tendon stiffness in man and woman trained runners. Physiological Reports, 1(7), e00178. https://doi.org/10.1002/phy2.178
- Foster, A. D., Block, B., Capobianco, F., Peabody, J. T., Puleo, N. A., Vegas, A., & Young, J. W. (2021). Shorter heels are linked with greater elastic energy storage in the Achilles tendon. Scientific Reports, 11(1), 9360. https://doi.org/10.1038/s41598-021-88774-8
- Geremia, J. M., Baroni, B. M., Bobbert, M. F., Bini, R. R., Lanferdini, F. J., & Vaz, M. A. (2018). Effects of high loading by eccentric triceps surae training on Achilles tendon properties in humans. European Journal of Applied Physiology, 118(8), 1725–1736. https://doi.org/10.1007/s00421-018-3904-1
- Ghosh, D. (2020). Wavelet-based Benjamini-Hochberg procedures for multiple testing under dependence. Mathematical Biosciences and Engineering, 17(1), 56–72. https://doi.org/10.3934/mbe.2020003
- Gruber, A. H., Umberger, B. R., Jewell, C., Del Pilar Li, S., & Hamill, J. (2011, August 10–13). Achilles tendon forces in forefoot and rearfoot running. 35th Annual Meeting of American Society of Biomechanics, Long Beach, CA (pp. 373–374). https://www.asbweb.org/wp-content/uploads/2011ASBmeetingproceedings.pdf
- Hamill, J., & Gruber, A. H. (2017). Is changing footstrike pattern beneficial to runners? Journal of Sport and Health Science, 6(2), 146–153. https://doi.org/10.1016/j.jshs.2017.02.004
- Hamill, J., Gruber, A. H., & Derrick, T. R. (2014). Lower extremity joint stiffness characteristics during running with different footfall patterns. European Journal of Sport Science, 14(2), 130–136. https://doi.org/10.1080/17461391.2012.728249
- Hamill, J., Moses, M., & Seay, J. (2009). Lower extremity joint stiffness in runners with low back pain. Research in Sports Medicine, 17(4), 260–273. https://doi.org/10.1080/15438620903352057
- Hansen, P., Aagaard, P., Kjaer, M., Larsson, B., & Magnusson, S. P. (2003). Effect of habitual running on human Achilles tendon load-deformation properties and cross-sectional area. Journal of Applied Physiology, 95(6), 2375–2380. https://doi.org/10.1152/japplphysiol.00503.2003
- Hansen, C. E., Stensvig, M., Wienecke, J., Villa, C., Lorentzen, J., Rasmussen, J., & Simonsen, E. B. (2021). Factors correlated with running economy among elite middle‐ and long‐distance runners. Physiological Reports, 9(20), 1–15. https://doi.org/10.14814/phy2.15076
- Hollander, K., Johnson, C. D., Outerleys, J., & Davis, I. S. (2021). Multifactorial determinants of running injury locations in 550 injured recreational runners. Medicine & Science in Sports & Exercise, 53(1), 102–107. https://doi.org/10.1249/MSS.0000000000002455
- Jandacka, D., Uchytil, J., Zahradnik, D., Farana, R., Vilimek, D., Skypala, J., Urbaczka, J., Plesek, J., Motyka, A., Blaschova, D., Beinhauerova, G., Rygelova, M., Brtva, P., Balazova, K., Horka, V., Malus, J., Silvernail, J. F., Irwin, G., Nieminen, M. T. … Hamill, J. (2020). Running and physical activity in an air-polluted environment: the biomechanical and musculoskeletal protocol for a prospective cohort study 4HAIE (Healthy aging in industrial environment—Program 4). International Journal of Environmental Research and Public Health, 17(23), 9142. https://doi.org/10.3390/ijerph17239142
- Ker, R. F., Alexander, R. M., & Bennett, M. B. (1988). Why are mammalian tendons so thick? Journal of Zoology, 216(2), 309–324. https://doi.org/10.1111/j.1469-7998.1988.tb02432.x
- Kubo, K., Miyazaki, D., Tanaka, S., Shimoju, S., & Tsunoda, N. (2015). Relationship between Achilles tendon properties and foot strike patterns in long-distance runners. Journal of Sports Sciences, 33(7), 665–669. https://doi.org/10.1080/02640414.2014.962576
- Kunimasa, Y., Sano, K., Oda, T., Nicol, C., Komi, P. V., Locatelli, E., Ito, A., & Ishikawa, M. (2014). Specific muscle-tendon architecture in elite Kenyan distance runners. Scandinavian Journal of Medicine & Science in Sports, 24(4), e269–e274. https://doi.org/10.1111/sms.12161
- Malus, J., Skypala, J., Silvernail, J. F., Uchytil, J., Hamill, J., Barot, T., & Jandacka, D. (2021). Marker placement reliability and objectivity for biomechanical cohort study: Healthy Aging in Industrial Environment (HAIE—Program 4). Sensors, 21(5), 1830. https://doi.org/10.3390/s21051830
- McCarthy, J. P., Hunter, G. R., Larson-Meyer, D. E., Bamman, M. M., & Landers, K. … , & Newcomer, B. R. (2006). Ethnic differences in triceps surae muscle-tendon complex and walking economy. The Journal of Strength and Conditioning Research, 20(3), 511. https://doi.org/10.1519/17395.1
- Melcher, D. A., Paquette, M. R., Schilling, B. K., & Bloomer, R. J. (2017). Joint stiffness and running economy during imposed forefoot strike before and after a long run in rearfoot strike runners. Journal of Sports Sciences, 35(23), 2297–2303. https://doi.org/10.1080/02640414.2016.1266016
- Monte, A., Maganaris, C., Baltzopoulos, V., & Zamparo, P. (2020). The influence of Achilles tendon mechanical behaviour on “apparent” efficiency during running at different speeds. European Journal of Applied Physiology, 120(11), 2495–2505. https://doi.org/10.1007/s00421-020-04472-9
- Rice, H., & Patel, M. (2017). Manipulation of foot strike and footwear increases achilles tendon loading during running. The American Journal of Sports Medicine, 45(10), 2411–2417. https://doi.org/10.1177/0363546517704429
- Robertson, D. G. E., Caldwell, G. E., Hamill, J., Kamen, G., & Whittlesey, S. N. (2014). Research methods in biomechnics (2nd ed.). Human Kinetics. https://doi.org/10.5040/9781492595809
- Robinson, J. M. (2001). The VISA-A questionnaire: A valid and reliable index of the clinical severity of Achilles tendinopathy. British Journal of Sports Medicine, 35(5), 335–341. https://doi.org/10.1136/bjsm.35.5.335
- Schache, A. G., Blanch, P. D., Dorn, T. W., Brown, N. A. T., Rosemond, D., & Pandy, M. G. (2011). Effect of running speed on lower limb joint kinetics. Medicine & Science in Sports & Exercise, 43(7), 1260–1271. https://doi.org/10.1249/MSS.0b013e3182084929
- Scholz, M. N., Bobbert, M. F., van Soest, A. J., Clark, J. R., & van Heerden, J. (2008). Running biomechanics: Shorter heels, better economy. The Journal of Experimental Biology, 211(20), 3266–3271. https://doi.org/10.1242/jeb.018812
- Skypala, J., Hamill, J., Sebera, M., Elavsky, S., Monte, A., & Jandacka, D. (2023). Running-Related Achilles Tendon Injury: A Prospective Biomechanical Study in Recreational Runners. Journal of Applied Biomechanics, 1–9. https://doi.org/10.1123/jab.2022-0221
- Skypala, J., Jandacka, D., & Hamill, J. (2019). Reliability of a measurement technique for Achilles tendon length. Journal of Sports Sciences, 37(20), 2389–2395. https://doi.org/10.1080/02640414.2019.1635375
- Swinnen, W., Hoogkamer, W., Delabastita, T., Aeles, J., De Groote, F., & Vanwanseele, B. (2019). Effect of habitual foot-strike pattern on the gastrocnemius medialis muscle-tendon interaction and muscle force production during running. Journal of Applied Physiology, 126(3), 708–716. https://doi.org/10.1152/japplphysiol.00768.2018
- Ueno, H., Suga, T., Takao, K., Tanaka, T., Misaki, J., Miyake, Y., Nagano, A., & Isaka, T. (2018). Relationship between Achilles tendon length and running performance in well-trained male endurance runners. Scandinavian Journal of Medicine and Science in Sports, 28(2), 446–451. https://doi.org/10.1111/sms.12940
- Urbaczka, J., Silvernail, J. F., & Jandacka, D. (2022). Effect of training volume on footstrike patterns over an exhaustive run. Gait & Posture, 91, 240–246. https://doi.org/10.1016/j.gaitpost.2021.10.040
- Urbaczka, J., Vilimek, D., & Jandacka, D. (2022). Does the achilles tendon influence foot strike patterns during an exhaustive run? Journal of Applied Biomechanics, 38(4), 263–270. https://doi.org/10.1123/jab.2021-0384
- Wearing, S. C., Davis, I. S., Brauner, T., Hooper, S. L., & Horstmann, T. (2019). Do habitual foot-strike patterns in running influence functional Achilles tendon properties during gait? Journal of Sports Sciences, 37(23), 2735–2743. https://doi.org/10.1080/02640414.2019.1663656
- Weir, G., Jewell, C., Wyatt, H., Trudeau, M. B., Rohr, E., Brüggemann, G.-P., & Hamill, J. (2019). The influence of prolonged running and footwear on lower extremity biomechanics. Footwear Science, 11(1), 1–11. https://doi.org/10.1080/19424280.2018.1539127
- Yong, J. R., Dembia, C. L., Silder, A., Jackson, R. W., Fredericson, M., & Delp, S. L. (2020). Foot strike pattern during running alters muscle-tendon dynamics of the gastrocnemius and the soleus. Scientific Reports, 10(1), 5872. https://doi.org/10.1038/s41598-020-62464-3
- Zhang, X., Deng, L., Xiao, S., Li, L., & Fu, W. (2021). Sex differences in the morphological and mechanical properties of the achilles tendon. International Journal of Environmental Research and Public Health, 18(17), 8974. https://doi.org/10.3390/ijerph18178974