
 ?Mathematical formulae have been encoded as MathML and are displayed in this HTML version using MathJax in order to improve their display. Uncheck the box to turn MathJax off. This feature requires Javascript. Click on a formula to zoom.
ABSTRACT
During prolonged jogging, joint moment and work tend to decrease in the distal (ankle) joint but increase at proximal (hip/knee) joints as performance fatigue manifests, and such adaptations might be expected to occur in sprinting. Fatigue is also thought to increase inter-limb asymmetries, which is speculated to influence injury risk. However, the effects of fatigue on sprint running gait have been incompletely studied, so these hypotheses remain untested. Using statistical parametric mapping, we compared 3-D kinematics and ground reaction force production between the dominant (DL) and non-dominant (NDL) legs of 13 soccer players during both non-fatigued and fatigued sprint running. Contrary to the tested hypotheses, relative between-leg differences were greater in non-fatigued than fatigued sprinting. DL generated higher propulsive impulse due to increased ankle work, while NDL exhibited greater vertical impulse, potentially due to greater hip flexion prior to downward foot acceleration. Whilst few changes were detected in DL once fatigued, NDL shifted towards greater horizontal force production, largely resulting from an increase in plantar flexion (distal-joint) moments and power. After fatiguing running, inter-limb asymmetry was reduced and no distal-to-proximal shift in joint work was detected. These adaptations may attenuate decreases in running speed whilst minimising injury risk.
KEYWORDS:
Introduction
Running is not only a common pastime but an integral part of many games and sports. Consistent with its societal importance, researchers have developed a detailed biomechanical picture of human running under varying environmental conditions in both non-sports-trained (Carrier et al., Citation2011; Kikel et al., Citation2020; Bramble & Lieberman, Citation2004) and sports-trained (Bezodis et al., Citation2014, Citation2015; Hunter et al., Citation2005; Kawamori et al., Citation2013; Schache et al., Citation2010) populations. In sports, the greatest distances are often covered whilst walking or running at submaximal speeds, with sporadic bursts of acceleration and/or maximal speed sprinting needed to chase or evade an opponent or when an offensive opportunity arises. Thus, sprinting gaits may be needed after already covering considerable distance (Gabbett, Citation2010; Gabbett & Jenkins, Citation2011; Harper et al., Citation2019; Johnston et al., Citation2012; Mohr et al., Citation2004; Varley & Aughey, Citation2013). In professional soccer, for example, decreases in total distance covered and high-intensity running (i.e., near or at top speed) are commonly reported after periods of high-intensity running during match play as well as towards the end of a match (Mohr et al., Citation2003), broadly indicating fatigue development.
Decrements in the capacity of the muscles to produce sufficient force or power during complex tasks such as running, i.e., performance fatiguability (Enoka et al., Citation2016), negatively impacts sprinting speed (Hautier et al., Citation2000; Pinniger et al., Citation2000; Sánchez-Sánchez et al., Citation2018; Small et al., Citation2009). However, little is known about our propensity to alter running biomechanics as a result of such fatigue. Fatigue-related gait alterations may be expected in response to decreased muscle force or power, but such alterations might also be causative of the decrements in force and power through changes in the muscle lengths adopted and muscle shortening speeds reached when the gait pattern is altered (Brown et al., Citation2014; García-Pinillos et al., Citation2020; Willwacher et al., Citation2020). For example, performing repeated sprint efforts decreased total positive and negative work, mainly attributed to hip and knee joint moments in the swing phase, alongside increased relative ankle work in the latter half of stance (Gonçalves et al., Citation2021). On the other hand, reduced work performed at the ankle has been observed with concomitant increased joint work about the knee and hip joints (i.e., a disto-proximal shift) during both fatiguing, persistent jogging (Candau et al., Citation1998) and higher-speed runs (e.g., ~180 s to exhaustion; Willer et al., Citation2021). Thus, it is unknown if joint moments and work may shift proximo-distally, or vice versa, during fatigued maximal sprint running.
Additionally, human gait is usually performed relatively symmetrically between limbs, although small inter-limb differences exist (Ciacci et al., Citation2013; Segers et al., Citation2007; von Lieres et al., Citation2020). Nonetheless, stronger, less fatigable muscles might be expected to be recruited more whilst weaker, fatigued muscles might be rested or at least provide less power during fatigued sprinting, even when a high running speed is required. Given that humans show significant lateral bias, i.e., handedness (Fitch & Stephanie, Citation2013), this might conceivably lead to asymmetries in joint moment and work produced during running (Bagesteiro & Sainburg, Citation2002; Radzak et al., Citation2017; Willer et al., Citation2021). Asymmetries in muscle force production measured in strength tests have been associated with increases in injury risk (Lord et al., Citation2018; Stephens et al., Citation2005), leading to speculation that substantive force or power production asymmetries may be inherently injurious (Ciacci et al., Citation2013; Fousekis et al., Citation2011). Whether gait asymmetry is directly causative of injury, or even whether substantive asymmetries evolve during sprinting after prior bouts of fatiguing running, remains unclear (Haugen et al., Citation2018; Kenneally-Dabrowski et al., Citation2019; Schuermans et al., Citation2017). Moreover, limb asymmetry has been assessed using various forms of analysis that evaluate kinematic and kinetic variables at discrete time-points. For example, the symmetry angle which involves measuring the angle between the line of symmetry and a reference line, allowing a quantitative assessment of the degree of between-limb asymmetry (Zifchock et al., Citation2008). Although this, and other approaches are informative, they only take a single time point into account to assess between-limb asymmetry. Hence, further research is needed using more robust statistical analyses, such as statistical parametric mapping (SPM) (Pataky, Citation2012), which takes into account both the magnitude and shape of a waveform, and may help to better understand possible fatigue-induced asymmetries during running-based activities.
The primary aim of this study, using statistical parametric mapping, was to comprehensively explore the joint kinematic and kinetic patterns of dominant and non-dominant legs during both non-fatigued and fatigued maximal sprinting in order to describe differences in the response of each leg to fatiguing running exercise. Therefore, we tested the following hypotheses: i) small-to-negligible joint kinematic and kinetic inter-limb asymmetries would be observed before fatiguing exercise, ii) dominant and non-dominant limbs would display significant joint kinematic and kinetic asymmetries after fatiguing exercise, iii) a proximo-distal shift in joint moments, power, and work produced would be observed in the dominant and non-dominant limbs after fatiguing exercise.
Methods
Population and training history
Thirteen intermediate-level (semi-professional) male Association Football (i.e., soccer) players (age: 19.1 ± 2.1 y, body mass: 72.5 ± 6.9 kg, height: 175 ± 7.7 cm) volunteered for the study – this sample was selected as a convenient representation of the available participants. The athletes regularly performed sprint running as well as lower intensity endurance running both in competitive (i.e., stressful) games as well as in their (less stressful) training but had not received any formal running technique instruction. Thus, they present a cohort who have a freely chosen running method. They also performed no formal strength or other supplementary training that might influence running performance or their response to fatiguing running exercise. Additional rationale for the choice of study cohort (e.g., over participants in track & field or other sports) as well as participant data are presented in Supplementary Information (Section 12). All subjects were free from injury for at least 6 months before testing, wore their normal training attire, and wore the same (their own) running shoes during testing. This study was approved by Edith Cowan University of Human Ethics Committee and was performed in accordance with the guidelines of the Declaration of Helsinki. Informed consent was obtained from all subjects prior to testing.
Biomechanical measurements
On arrival, height and body mass were recorded for each subject and then a custom-defined set of retroreflective cluster-based markers used for the 3D motion analysis were attached to identified anatomical landmarks (Table S1). The retroreflective markers were captured during the trials by 13 VICON motion analysis cameras (Oxford Metrics Ltd., Oxford, UK) set at a frame rate of 250 Hz. Motion data capture was synchronised with ground reaction force data, recorded with five serially arranged 600 × 900-mm in-ground triaxial force platforms (Kistler Quattro, Type9290AD, Victoria, Australia) at an analogue-digital conversation rate of 1000 Hz. Motion capture cameras were positioned to ensure a suitable capture volume around the in-ground force platforms to capture the sprint running trials (). In order for the anatomical markers to be referenced to the tracking markers prior to recording sprint running trials, static subject calibration trials were obtained with the subject standing in the anatomical position, followed by dynamic calibration trials in which subjects moved their legs through a range of motion to enable post-collection determination of functional joint centres using Visual 3D software (C-Motion, Germantown, MD, USA).
Figure 1. Aerial schematic of the laboratory set up during data collection. Left: motion capture cameras were positioned to create a capture volume around the in-ground force platforms over which the subjects completed their sprint running trials. Right: testing protocol order of procedure.
Protocol
After completing the static and dynamic calibration trials, subjects performed a comprehensive standardised warm-up (~15–20 min) at their chosen intensity (Table S2). Then, three single-leg vertical jumps (SLVJ) were performed on each leg to obtain jump height (Figure S2) as a measure to determine the dominant and non-dominant limb (the SLVJ requires significant force production, skill, and coordination – see Supplementary Information). In some studies, researchers have designated the preferred kicking leg as dominant, which may not be the stronger of the two legs and thus may not accord with our definition. After SLVJs, three maximal 50-m sprint running efforts were performed from a standing start. The starting point was located 40-m from the last force platform in the series to enable force recordings during the maximal velocity phase (i.e., 35–40 m). The end point of the sprint was located 50 m from the start point to ensure subjects did not decelerate through the data capture zone. The subjects were allowed exactly 60 s of rest between trials; the relatively short rest was used to minimise the recovery from fatigue in post-running trials but did not induce detectable running fatigue in the non-fatigued tests (see Results).
After the first set of sprints (pre-fatigue test), subjects completed a soccer-specific fatiguing exercise protocol (Ball – Sport Endurance and Sprint Test; BEAST 45, Figure S3) lasting 45 min (Williams et al., Citation2010) that included repeated bouts of sprint running, jogging, changes of direction, walking, backward running, and stationary recovery similar to the first half of a soccer match. This protocol was chosen as it was familiar to the subjects, who could therefore complete it without a notable pacing strategy or extensive familiarisation, and because it incorporated all directions of movement that might be performed in field-based team sports. After performing the fatiguing exercise, subjects jogged to the start line in ~ 80 s. Once at the start line, a countdown from 5 to 1 led into the first sprint effort. The subjects performed three further maximal sprinting trials (post-fatigue test) with 60-s inter-sprint rests (Figure S1).
Data analysis
All trials were digitised using VICON Nexus software (Oxford Metrics Ltd., Oxford, UK). Both ground reaction force and marker trajectory data were filtered using a fourth-order (zero-lag) low-pass Butterworth filter with a 15 Hz cut-off frequency; residual analyses were performed to determine cut-off frequencies, and this cut-off frequency successfully removed artificial fluctuations in joint moments during the initial stance phase (Bisseling & Hof, Citation2006; Mai & Willwacher, Citation2019; van den Bogert & de Koning, Citation1996). Using Visual 3D software (C-Motion, Germantown, MD, USA), static calibration data, subject height, and body mass were used to create an individually scaled skeletal model that included the trunk, pelvis, thigh, shank, and foot segments using standard available inertial parameters (segment mass (Hanavan, Citation1964) and moments of inertia (Winter, Citation2009)) in Visual 3D. For both limbs in the sprint running trials, sagittal segment angles were calculated relative to the laboratory reference frame and were normalised to normal upright standing position, while conventional Visual 3D (C-Motion) calculation methods using Newton-Euler procedures were used to compute joint moments and powers as the hip transitioned from flexion to extension through to toe-off (see ). Force platform data was used to determine timings of foot-strike and toe-off with a threshold value set at 20 N. Impulse data (braking, propulsive, and vertical) were expressed in N s, and then normalised to body mass (expressed as m/s) since momentum is the product of mass and velocity and the mass of the athlete remains constant during each ground contact.
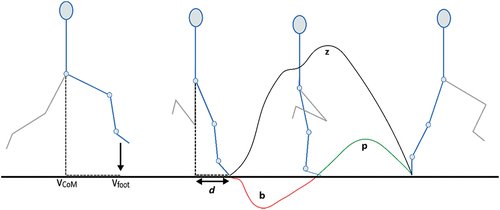
Figure 2. In the sprint gait cycle, leg retraction (forward rotation) begins as the foot leaves the ground and continues up until peak hip flexion. Leg protraction (backward rotation) commences as the hip extends and continues up until toe-off. For each limb, data were obtained as the hip transitioned from flexion (i.e., late retraction) to extension through to toe-off (i.e., protraction phase). Key variables compared between dominant and non-dominant legs in non-fatigued and fatigued sprinting. Vertical centre of mass velocity (vCoM), vertical foot velocity (vfoot), anterior-posterior distance of foot relative to CoM at foot-strike (d), braking impulse (b), propulsive impulse (p), vertical impulse (z).
The net joint moments were subsequently multiplied by joint angular velocities to obtain joint powers at the hip, knee, and ankle joints. To obtain positive and negative mechanical work performed by the lower limbs, joint power data were individually integrated with respect to time using the trapezoidal method (Farris & Sawicki, Citation2012). For each limb, all values of positive work were summed, and all negative work values were summed, to give individual joint totals for positive and negative work, respectively. The average positive powers calculated for the hip, knee, and ankle joints were summed and this value was described as total positive power output (equation 1), where ,
,
,
are total, hip, knee, and ankle joint average positive powers. Each joint’s average positive power as a percentage of total average positive power was determined (equation 2), where
is the percentage of an individual joint to the total work. The same equations were used to obtain total average negative power at each joint.
and
Statistical analysis
Descriptive statistics (means and standard deviations) were obtained for variables captured in both the non-fatigued and fatigued conditions. For discrete variables, repeated-measures one-way analysis of variance (ANOVA) were used to compare between the dominant and non-dominant legs as well as non-fatigued and fatigued trials (p < 0.05). Effect sizes were determined using standard mean differences. Values of 0.2–0.5, 0.5–0.8, and > 0.8 were considered as small, medium, and large, respectively. All statistical analyses for discrete variables were performed using JAMOVI (Version 1.6, Sydney, Australia). For statistical testing of one-dimensional continua, data were averaged across the three trials in non-fatigued and fatigued conditions, respectively. Statistical Parametric Mapping (SPM) was used to compared joint kinematic and kinetic data during the second half of the retraction and protraction phases of the dominant and non-dominant legs across both conditions using open-source SPM code (SPM1D open-source package, spm1d.org) in Python (Pataky, Citation2012). Joint kinematic and kinetic data were normalised, representing 0%-100% of the trial. Subsequently, we conducted a two-way ANOVA, which yielded a statistical parametric map (SPM{F}) as the output (set at p < 0.05). When the SPM{F} exceeded the critical threshold, the variable was considered significantly different between legs or conditions, and a collection of ≥ 5 consecutive points exceeding the threshold was considered statistically meaningful (Colyer et al., Citation2018).
Results
The key sprint performance variables compared between dominant (DL) and non-dominant (NDL) legs in non-fatigued and fatigued sprinting are shown in . DL was selected as the leg that produced the greatest jump height in the single-leg vertical jump test, with non-fatigued DL jumps being 22.7 ± 0.9 cm and NDL jumps being 21.1 ± 1.5 cm (Figure S2). After fatiguing exercise, jump height significantly decreased for both DL (p < 0.001, ES = 2.26) and NDL (p < 0.001, ES = 1.47) with no differences observed between limbs. The average maximum horizontal velocity of the CoM during non-fatigued sprinting was 8.59 m/s, and decreased 0.33 m/s during fatigued sprinting (Table S3).
Dominant (DL) vs. Non-Dominant (NDL) Legs: non-fatigued sprinting
Vertical foot velocity (i.e., towards the ground) relative to the centre of mass (CoM) was not statistically different between DL and NDL; additionally, no statistical differences were observed in horizontal foot velocity. The anterior-posterior position of the foot relative to the CoM at foot-strike was closer to the CoM in DL than NDL (p = 0.027, ES = 0.345; ). Accordingly, a smaller braking impulse (p = 0.028, ES = 0.431) and greater propulsive impulse (p = 0.003, ES = 0.651), but smaller vertical impulse (p = 0.001, ES = 0.702) was produced by DL than NDL () with similar ground contact times (DL = 0.133, NDL = 0.136).
Figure 3. (A) shows peak vertical velocity of the foot (metres per second) relative to the centre of mass velocity between early protraction to foot-strike; (B) anterior-posterior (AP) position of the foot at ground contact relative to the horizontal position of the centre of mass (metres) for the non-fatigued dominant leg (NFDL), non-fatigued non-dominant leg (NFNDL), fatigued dominant leg (FDL), and fatigued non-dominant leg (FNDL). Vfoot represents the vertical velocity of the foot; d represents the anterior-posterior position of the foot relative to CoM at foot-strike. (A)* statistical difference of vertical velocity of the foot relative to CoM velocity, (B)* statistical difference of AP foot position relative to horizontal CoM position between legs and conditions, respectively (p < 0.05).
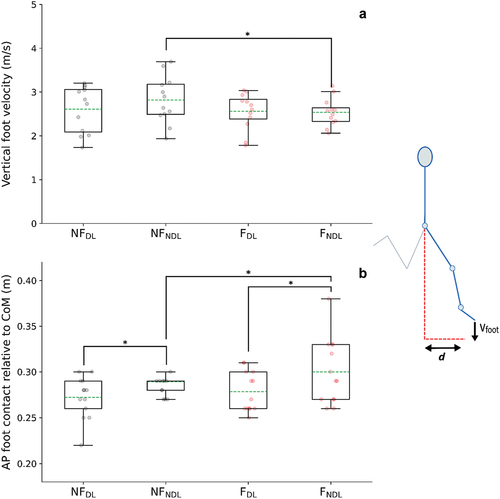
Table 1. Non-fatigued and fatigued braking, propulsive, vertical, and propulsive/braking impulse ratios for dominant and non-dominant legs. *statistical difference between dominant and non-dominant legs trials. ^statistical difference between non-fatigued and fatigued trials, respectively (p < 0.05).
The peak hip flexion angle relative to the pelvis was greater in NDL than DL during the retraction-protraction transition point (Table S4). The ankle was the dominant source of lower limb positive and negative joint work (J kg−1) for DL, whereas NDL had a relatively even distribution across the lower limb joints (). Both limbs had the same proportion of positive (31%) and negative (34%) work performed at the hip joint. Proportionally, there was significantly more negative work (~14%) performed at the knee joint in NDL than DL, and more positive (p < 0.001, ES = 0.554) and negative (p = 0.025, ES = 0.262) work produced at the ankle in DL. In addition, SPM analyses showed that hip power absorption was greater in NDL than DL during the second half of the stance phase (); while knee extension moment (Nm/kg) increased earlier, and the peak occurred sooner between foot-strike early stance. By contrast, DL knee extension moment showed a more gradual increase and later peak than NDL (, p = 0.001) whilst the peak ankle plantar flexion moment was greater during the first half of stance in DL (, p < 0.001) and a higher peak plantarflexor moment was produced (Table S5).
Figure 4. Percentage of total average positive and negative work contributed by the hip (light grey), knee (dark grey), and ankle (black) joints in dominant (DL) and non-dominant (NDL) legs. Significant differences were observed in DL and NDL positive ankle work, negative ankle work, and negative knee work in non-fatigued sprinting, but only in negative knee work in fatigued sprinting, despite statistical increase (#) in DL after fatigue. *statistical difference between legs within conditions. #statistical change between non-fatigued and fatigued conditions (p < 0.05).
Figure 5. Mean (± standard deviation) joint moments (column 1; N/kg) and powers (column 2; W/kg) at the hip from maximum hip flexion to toe-off for the dominant (DL - black) and non-dominant (NDL - red) legs in the non-fatigued (NF - solid) and fatigued (F - dashed) conditions. Vertical dotted line represents foot-strike. Significant main effects (p < 0.05) of fatigue (green) and between limb (blue) are highlighted during the corresponding periods.
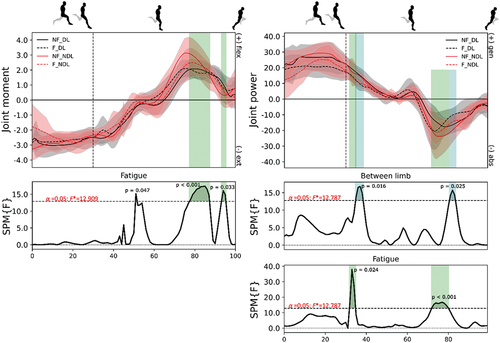
Figure 6. Mean (± standard deviation) joint moments (column 1; N/kg) and powers (column 2; W/kg) at the knee from maximum hip flexion to toe-off for the dominant (DL - black) and non-dominant (NDL - red) legs in the non-fatigued (NF - solid) and fatigued (F - dashed) conditions. Vertical dotted line represents foot-strike. Significant main effects (p < 0.05) of fatigue (green) and between limb (blue) are highlighted during the corresponding periods.
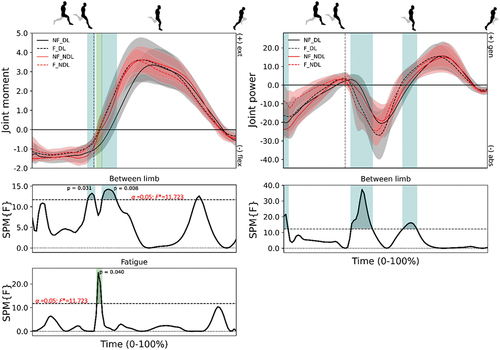
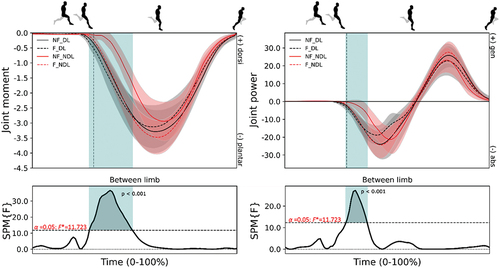
Figure 7. Mean (± standard deviation) joint moments (column 1; N/kg) and powers (column 2; W/kg) at the ankle from maximum hip flexion to toe-off for the dominant (DL – black) and non-dominant (NDL - red) legs in the non-fatigued (NF - solid) and fatigued (F - dashed) conditions. Vertical dotted line represents foot-strike. Significant main effects (p < 0.05) of fatigue (green) and between limb (blue) are highlighted during the corresponding periods.
Effect of fatigue on DL leg and pelvis kinetics and kinematics
There was no change in positive and negative work () observed at the hip joint whilst greater power was generated at the knee () around mid-stance after the fatiguing running in DL, which corresponded with a greater braking impulse (p = 0.020, ES = 0.471) (). After the fatiguing running exercise, the SPM analyses revealed a greater knee extension moment from foot-ground contact through to early stance ().
Effect of fatigue on NDL leg and pelvis kinetics and kinematics
During fatigued sprinting, slightly more positive and negative work (not statistically different) at the ankle with similar proportional contributions at the hip and knee observed in NDL (). Furthermore, both peak hip flexion angle (3.2°) and hip extension moment (0.4 Nm/kg) decreased in NDL (Table S5). The knee remained more extended during early protraction in the fatigued condition but was similar by the point of foot-ground contact. Also, significantly greater power absorption and larger plantar flexion moment () was observed from foot-ground contact to early stance after the fatiguing exercise. This coincided with a reduced vertical foot velocity (, p = 0.004, ES = 0.542) immediately prior to foot-ground contact relative to the CoM yet greater propulsive impulse (p = 0.003, ES = 0.648) ().
Differential effects of fatigue on DL and NDL
SPM analyses revealed a small but not meaningful difference in ankle joint kinetics () after the fatiguing running exercise (Colyer et al., Citation2018). A slightly greater ankle plantar flexion moment was produced at foot-strike in DL than NDL and with shorter ground contact times (p = 0.012, ES = 0.287; see Figure S4), yet both legs produced similar braking, propulsive, and vertical impulses (). Less vertical CoM displacement (Figure S5) was observed during DL than NDL (p = 0.020, ES = 0.266) force production phases in the fatigued condition.
See Figures S6-S9 in the Supplementary Information for visual representation of the differences observed between and within limbs and across conditions.
Discussion
Contrary to the tested hypothesis, inter-limb asymmetry was greater during non-fatigued sprint running. In particular, the foot was positioned further in front of the CoM in NDL than DL at foot-ground contact, which was followed by an earlier rise and greater peak knee extension moment, both of which presumably contributed to the greater vertical impulse generation observed in NDL. Additionally, the plantarflexors generated more torque in DL than NDL, possibly due to greater utilisation of energy storage and release mechanisms in structures such as the Achilles tendon (Lai et al., Citation2014). After fatiguing running however, a strategy was adopted that maintained (DL) or increased (NDL) the proportional positive and negative ankle joint work contributions in the face of fatigue, which consequently reduced inter-limb asymmetry. That is, after fatiguing running, the joint kinematics and kinetics reflected greater symmetry between limbs. This may a result of our cohort of athletes regularly engaging in both sprint running and lower intensity endurance running in competitive games and training, potentially leading to acclimation to fatigued running exercise.
Significant kinetic and kinematic differences were observed between DL and NDL during non-fatigued sprint running. At the retraction-protraction transition point, the hip flexion angle was greater in NDL than DL along with foot-strike occurring further in front of the CoM, resulting in a faster rate of knee extensor moment development during initial ground contact. In contrast, in DL the ankle absorbed more power and the plantar flexion moment both commenced and reached an earlier and greater peak during ground contact. Such differences in technique between the legs might explain the differences observed in ground force production. For example, NDL produced greater braking and vertical impulse, whereas DL produced greater propulsive impulse. In order to reduce braking impulse and maximise propulsive impulse during maximal speed sprinting, it is crucial to position the foot more underneath the centre of mass (Hunter et al., Citation2005; Mann & Sprague, Citation1980). Thus, we speculate that DL influenced forward CoM velocity more critically, while NDL primarily projected the body with vertical velocity, presumably to maintain stride length, providing less assistance to forward propulsion (Radzak et al., Citation2017; Segers et al., Citation2007). During non-fatigued sprint running, the knee and ankle joints contributed differently, which led to different vertical, braking, and propulsive impulses between limbs. To further understand the association between interlimb joint contribution and sprint running performance, more research is required.
Muscle force asymmetries have been linked with increases in injury risk, raising the possibility that significant asymmetries in force production may be intrinsically injurious (Clark, Citation2001; Fousekis et al., Citation2010; Lord et al., Citation2018; Wilk et al., Citation2003). After completing the BEAST protocol, jump height (~ −7–9%) and maximum sprint running velocity (~ −4%) decreased, indicating that the chosen protocol effectively induced match-related fatigue, commensurate with the extant literature (Cooper et al., Citation2020; Jiménez-Reyes et al., Citation2019). Contrary to our tested hypothesis, inter-limb asymmetry decreased with fatigue, which may indicate that our subjects loaded their limbs more evenly as fatigue developed, potentially reducing injury risk (Brown et al., Citation2017, Olivier et al. Citation2017; Heil et al., Citation2020). Another explanation might be that the greater work produced by the non-dominant leg after fatiguing exercise could theoretically increase its risk of injury, i.e., the reduction in asymmetry observed in the present study might reflect a situation in which NDL was loaded more after fatiguing exercise and thus may be at greater risk. Nonetheless, given the large variation in the findings previously reported for inter-limb asymmetry (Bishop et al., Citation2018), particularly after completing fatiguing exercise (Heil et al., Citation2020), it is challenging to contextualise our findings with respect to the existing literature. Subsequent investigations should aim for methodological standardisation to evaluate the impact of fatigue induced by exercise on inter-limb asymmetries. We recommend employing statistical parametric mapping for evaluating limb asymmetry instead of relying solely on discrete time-point observations of kinematic and kinetic variables (Pataky, Citation2012).
During running at a constant middle-distance pace, fatigue is primarily observed in the plantar flexors with a compensatory increase in positive work done at the knee, showing that relative joint work shifts to more proximal joints in fatigued endurance running (Folland et al., Citation2017; Willer et al., Citation2021). However, as running speed increases from jogging to sprint running, the contribution of tendon elastic strain energy to the positive work produced by the soleus and gastrocnemius muscle-tendon unit has been shown to increase from 53% to 74% and 62% to 75%, respectively (Lai et al., Citation2014). Greater muscular activation and the comparatively isometric behaviour of the soleus and gastrocnemius muscle fibres were found to contribute to this increase; these two traits have been shown to improve tendon stretch and recoil (Lai et al., Citation2014). As fatigue deepens, one strategy might be to rely on tendon stretch and recoil to a greater extent, which might explain the greater contribution in NDL plantarflexor moment (~12%) and power (~9%) observed in the present study. As such, unlike during prolonged submaximal running, there is a tendency to maintain the proportional positive and negative joint work at the ankle during sprint running, which we speculate may be due to the tendon stretch and recoil capacity at the ankle joint (Lai et al., Citation2014). That is, fatiguing running exercise does not promote a more knee- or hip-dominant strategy during maximal sprint running. Given the divergent approaches adopted in our study as compared to Lai et al. (Citation2014), Folland et al. (Citation2017), and Willer et al. (Citation2021), caution should be exercised when interpreting and comparing the results. Nevertheless, according to our results, the adaptations observed during submaximal fatigued running do not appear to extrapolate to fatigued sprint running.
The comparison during non-fatigued sprinting showed significant differences between DL and NDL, and since comparatively little change was observed in DL than NDL after fatiguing running, the resulting similarity between limbs in fatigue can be attributed largely to a shift in kinematic and kinetic patterns in NDL. Fatigue and asymmetry are often (Hiemstra et al., Citation2001; McLean & Samorezov, Citation2009; Verschueren et al., Citation2020), but not always (Brown et al., Citation2014; Haugen et al., Citation2018), cited as important yet interrelated risk factors for injury. If this is true, then the greater asymmetry observed in non-fatigued sprinting might be explained by running speed being prioritised in non-fatigued sprinting but injury risk reduction being prioritised during fatigued sprinting. This hypothesis is worthy of explicit scrutiny in future studies.
In summary, movement pattern differences between DL and NDL indicate that the legs played partly unique roles (DL contributed more to forwards running speed) during non-fatigued sprint running in a small group of male athletes who commonly perform both endurance- and sprint-type running but have not been coached in their techniques. However, these differences diminished significantly under fatigue, primarily due to changes in NDL. This increased similarity in leg function during fatigue may help reduce the risk of injury, but it might also come at the cost of running speed. Unlike slower running speeds, running at faster speeds in a fatigued state does not seem to compromise ankle joint work, moment, or power production. It is important to note some limitations. The relatively small sample size restricts the generalisability of findings to other athlete populations. Additionally, to induce greater changes in lower-limb joint mechanics, a more intense stimulus, such as repeated sprints with short rest periods, might be necessary. While the fatiguing running protocol was conducted on a grassed sports field, sprint running testing took place in an indoor laboratory on an athletic track (Mondo surface). Although this minimised environmental effects, future studies should explore sprint running mechanics on various surfaces commonly used in running-based sports, like grass and dirt surfaces. Finally, while appropriate statistical methods were used, there is still a risk of false positives due to multiple comparisons. Hence, the results should be interpreted with caution.
Practical considerations
The ability to attain fast running speeds may critically determine success in modern sports competitions. At times, sprint running may have to be performed whilst fatigued from previous, longer-distance running, when speeds are reduced, and injury risk may be higher. We observed that the dominant leg (DL) played a larger role in propelling the athletes forward during non-fatigued sprinting. However, the difference between the dominant and non-dominant legs (NDL) became smaller when the athletes were fatigued, mainly because of changes in NDL. Moreover, asymmetry between the legs was reduced under fatigued conditions, however, this appears to be at the expense of maximum sprinting speed.
Author contributions
SV, JCW, and AJB designed research; SV and MT performed research; SV and AJB analysed data; and SV, JCW, MT, and AJB wrote the paper.
Supplemental Material
Download MS Word (915 KB)Disclosure statement
No potential conflict of interest was reported by the author(s).
SUPPLEMENTARY MATERIAL
Supplemental data for this article can be accessed online https://doi.org/10.1080/02640414.2023.2268374
Additional information
Funding
References
- Bagesteiro, L. B., & Sainburg, R. L. (2002). Handedness: Dominant arm advantages in control of limb dynamics. Journal of Neurophysiology, 88(5), 2408–2421. https://doi.org/10.1152/jn.00901.2001
- Bezodis, N. E., Salo, A. I., & Trewartha, G. (2014). Lower limb joint kinetics during the first stance phase in athletics sprinting: Three elite athlete case studies. Journal of Sports Sciences, 32(8), 738–746. https://doi.org/10.1080/02640414.2013.849000
- Bezodis, N. E., Trewartha, G., & Ilkka Tapio Salo, A. (2015). Understanding the Effect of touchdown distance and ankle joint kinematics on sprint acceleration performance through computer simulation. Sports Biomechanics, 14(2), 232–245. https://doi.org/10.1080/14763141.2015.1052748
- Bishop, C., Turner, A., & Read, P. (2018). Effects of inter-limb asymmetries on physical and Sports performance: A systematic review. Journal of Sports Sciences, 36(10), 1135–1144. https://doi.org/10.1080/02640414.2017.1361894
- Bisseling, R. W., & Hof, A. L. (2006). Handling of impact forces in inverse dynamics. Journal of Biomechanics, 39(13), 2438–2444. https://doi.org/10.1016/j.jbiomech.2005.07.021
- Bramble, D. M., & Lieberman, D. E. (2004). Endurance running and the evolution of Homo. Nature, 432(7015), 345–352. https://doi.org/10.1038/nature03052
- Brown, S. R., Cross, M. R., Girard, O., Brocherie, F., Samozino, P., & Morin, J.-B. (2017). Kinetic sprint asymmetries on a non-motorised treadmill in Rugby Union athletes. International Journal of Sports Medicine, 38(13), 1017–1022. https://doi.org/10.1055/s-0043-117607
- Brown, A. M., Zifchock, R. A., & Hillstrom, H. J. (2014). The effects of limb dominance and fatigue on running biomechanics. Gait and Posture, 39(3), 915–919. https://doi.org/10.1016/j.gaitpost.2013.12.007
- Candau, R., Belli, A., Millet, G. Y., Georges, D., Barbier, B., & Rouillon, J. D. (1998). Energy cost and running mechanics during a treadmill run to voluntary exhaustion in humans. European Journal of Applied Physiology and Occupational Physiology, 77(6), 479–485. https://doi.org/10.1007/s004210050363
- Carrier, D. R., Anders, C., & Schilling, N. (2011). The musculoskeletal System of humans is not tuned to maximize the economy of locomotion. Proceedings of the National Academy of Sciences of the United States of America, 108(46), 18631–18636. https://doi.org/10.1073/pnas.1105277108
- Ciacci, S., DiMichele, R., Fantozzi, S., Merni, F., & Mokha, M. (2013). Assessment of kinematic asymmetry for reduction of hamstring injury risk. International Journal of Athletic Therapy and Training, 18(6), 18–23. https://doi.org/10.1123/ijatt.18.6.18
- Clark, N. C. (2001). Functional performance testing following knee ligament injury. Physical Therapy in Sport, 2(2), 91–105. https://doi.org/10.1054/ptsp.2001.0035
- Colyer, S. L., Nagahara, R., & Salo, A. I. T. (2018). Kinetic demands of sprinting shift across the acceleration phase: Novel analysis of entire force waveforms. Scandinavian Journal of Medicine and Science in Sports, 28(7), 1784–1792. https://doi.org/10.1111/sms.13093
- Cooper, C. N., Dabbs, N. C., Davis, J., & Sauls, N. M. (2020). Effects of lower-body muscular fatigue on vertical jump and balance performance. Journal of Strength and Conditioning Research, 34(10), 2903–2910. https://doi.org/10.1519/JSC.0000000000002882
- Enoka, R. M., & Duchateau, J. (2016). Translating fatigue to human performance. Medicine and Science in Sports and Exercise. https://doi.org/10.1249/MSS.0000000000000929
- Farris, D. J., & Sawicki, G. S. (2012). The mechanics and energetics of Human walking and running: A joint level perspective. Journal of the Royal Society Interface, 9(66), 110–118. https://doi.org/10.1098/rsif.2011.0182
- Fitch, W. T., & Stephanie, N. B. (2013). Primate laterality and the biology and evolution of Human handedness: A review and synthesis. Annals of the New York Academy of Sciences, 1288(1), 70–85. https://doi.org/10.1111/nyas.12071
- Folland, J. P., Allen, S. J., Black, M. I., Handsaker, J. C., & Forrester, S. E. (2017). Running technique is an important component of running economy and performance. Medicine and Science in Sports and Exercise, 49(7), 1412–1423. https://doi.org/10.1249/MSS.0000000000001245
- Fousekis, K., Tsepis, E., Poulmedis, P., Athanasopoulos, S., & Vagenas, G. (2011). Intrinsic risk factors of non-contact quadriceps and hamstring strains in soccer: A prospective study of 100 professional players. British Journal of Sports Medicine, 45(9), 709–714. https://doi.org/10.1136/bjsm.2010.077560
- Fousekis, K., Tsepis, E., & Vagenas, G. (2010). Multivariate isokinetic Strength asymmetries of the knee and ankle in professional soccer players. THE JOURNAL of SPORTS MEDICINE and PHYSICAL FITNESS, 50(4), 11.
- Gabbett, T. J. (2010). The development and application of an injury prediction model for noncontact, soft-tissue injuries in elite collision Sport athletes. Journal of Strength and Conditioning Research, 24(10), 2593–2603. https://doi.org/10.1519/JSC.0b013e3181f19da4
- Gabbett, T. J., & Jenkins, D. G. (2011). Relationship between training load and injury in professional Rugby League players. Journal of Science and Medicine in Sport, 14(3), 204–209. https://doi.org/10.1016/j.jsams.2010.12.002
- García-Pinillos, F., Cartón-Llorente, A., Jaén-Carrillo, D., Delgado-Floody, P., Carrasco-Alarcón, V., Martínez, C., & Roche-Seruendo, L. E. (2020). Does fatigue alter step characteristics and stiffness during running? Gait and Posture, 76, 259–263. https://doi.org/10.1016/j.gaitpost.2019.12.018
- Gonçalves, B. A. M., Meinders, E., Saxby, D. J., Barrett, R. S., Bourne, M. N., & Diamond, L. E. (2021). Repeated sprints alter mechanical work done by hip and knee, but not ankle, sagittal moments. Journal of Science and Medicine in Sport, 24(9), 939–944. https://doi.org/10.1016/j.jsams.2021.03.008
- Hanavan, E. P. (1964). A mathematical model of the Human body. AMRL-TR-64-102.AMRL TR.
- Harper, D. J., Carling, C., & Kiely, J. (2019). High-intensity acceleration and deceleration demands in elite team Sports competitive match play: A systematic review and meta-analysis of observational studies. Sports Medicine, 49(12), 1923–1947. https://doi.org/10.1007/s40279-019-01170-1
- Haugen, T., Danielsen, J., McGhie, D., Ettema, G., & Sandbakk, Ø. (2018). Kinematic stride cycle asymmetry is not associated with sprint performance and injury prevalence in athletic sprinters. Scandinavian Journal of Medicine & Science in Sports, 28(3), 1001–1008. https://doi.org/10.1111/sms.12953
- Hautier, C. A., Arsac, L. M., Deghdegh, K., Souquet, J., Belli, A., & Lacour, J. R. (2000). Influence of fatigue on EMG/Force ratio and cocontraction in cycling. Medicine and Science in Sports and Exercise, 32(4), 839–843. https://doi.org/10.1097/00005768-200004000-00017
- Heil, J., Loffing, F., & Büsch, D. (2020). The influence of exercise-induced fatigue on inter-limb asymmetries: A systematic review. Sports Medicine - Open, 6(1), 39. https://doi.org/10.1186/s40798-020-00270-x
- Hiemstra, L. A., Lo, I. K. Y., & Fowler, P. J. (2001). Effect of fatigue on knee proprioception: Implications for dynamic stabilization. Journal of Orthopaedic and Sports Physical Therapy, 31(10), 598–605. https://doi.org/10.2519/jospt.2001.31.10.598
- Hunter, J. P., Marshall, R. N., & McNair, P. J. (2005). Relationships between ground reaction force impulse and kinematics of sprint-running acceleration. Journal of Applied Biomechanics, 21(1), 31–43. https://doi.org/10.1123/jab.21.1.31
- Jiménez-Reyes, P., Pareja-Blanco, F., Cuadrado-Peñafiel, V., Ortega-Becerra, M., Párraga, J., & José González-Badillo, J. (2019). Jump height loss as an indicator of fatigue during sprint training. Journal of Sports Sciences, 37(9), 1029–1037. https://doi.org/10.1080/02640414.2018.1539445
- Johnston, R. J., Watsford, M. L., Pine, M. J., Spurrs, R. W., Murphy, A. J., & Pruyn, E. C. (2012). The validity and reliability of 5-Hz global positioning System units to measure team Sport movement demands. Journal of Strength and Conditioning Research, 26(3), 758–765. https://doi.org/10.1519/JSC.0b013e318225f161
- Kawamori, N., Nosaka, K., & Newton, R. U. (2013). Relationships between ground reaction impulse and sprint acceleration performance in team Sport athletes. Journal of Strength and Conditioning Research, 27(3), 568–573. https://doi.org/10.1519/JSC.0b013e318257805a
- Kenneally-Dabrowski, C., Brown, N. A. T., Warmenhoven, J., Serpell, B. G., Perriman, D., Lai, A. K., & Spratford, W. (2019). Late swing running mechanics influence hamstring injury susceptibility in elite rugby athletes: A prospective exploratory analysis. Journal of Biomechanics, 92, 112–119. https://doi.org/10.1016/j.jbiomech.2019.05.037
- Kikel, M., Gecelter, R., & Thompson, N. E. (2020). Is step width decoupled from pelvic Motion in Human evolution? Scientific Reports, 10(1). https://doi.org/10.1038/s41598-020-64799-3
- Lai, A., Schache, A. G., Lin, Y.-C., & Pandy, M. G. (2014). Tendon elastic strain energy in the human ankle plantar-flexors and its role with increased running speed. Journal of Experimental Biology, 217(17), 3159–3168. https://doi.org/10.1242/jeb.100826
- Lord, C., Ma’ayah, F., & Blazevich, A. J. (2018). Change in knee flexor torque after fatiguing exercise identifies previous hamstring injury in football players. Scandinavian Journal of Medicine and Science in Sports, 28(3), 1235–1243. https://doi.org/10.1111/sms.13007
- Mai, P., & Willwacher, S. (2019). Effects of low-pass filter combinations on lower extremity joint moments in distance running. Journal of Biomechanics, 95, 109311. https://doi.org/10.1016/j.jbiomech.2019.08.005
- Mann, R., & Sprague, P. (1980). A kinetic analysis of the ground leg during sprint running. Research Quarterly for Exercise and Sport. https://doi.org/10.1080/02701367.1980.10605202
- McLean, S. G., & Samorezov, J. E. (2009). Fatigue-induced acl injury risk stems from a degradation in central control. Medicine and Science in Sports and Exercise, 41(8), 1661–1672. https://doi.org/10.1249/MSS.0b013e31819ca07b
- Mohr, M., Krustrup, P., & Bangsbo, J. (2003). Match performance of high-standard soccer players with special reference to development of fatigue. Journal of Sports Sciences, 21(7), 519–528. https://doi.org/10.1080/0264041031000071182
- Mohr, M., Krustrup, P., Nybo, L., Nielsen, J. J., & Bangsbo, J. (2004). Muscle temperature and sprint performance during soccer matches - beneficial effect of re-warm-up at half-time. Scandinavian Journal of Medicine and Science in Sports, 14(3), 156–162. https://doi.org/10.1111/j.1600-0838.2004.00349.x
- Olivier, G., Brocherie, F., Benoit Morin, J., & Millet, G. P. (2017). Lower limb mechanical asymmetry during repeated treadmill sprints. Human Movement Science, 52, 203–214. https://doi.org/10.1016/j.humov.2017.02.008
- Pataky, T. C. (2012). One-dimensional statistical parametric mapping in Python. Computer Methods in Biomechanics and Biomedical Engineering, 15(3), 295–301. https://doi.org/10.1080/10255842.2010.527837
- Pinniger, G. J., Robyn Steele, J., & Groeller, H. (2000). Does fatigue induced by repeated dynamic efforts affect hamstring muscle function? Medicine and Science in Sports and Exercise, 32(3), 647–653. https://doi.org/10.1097/00005768-200003000-00015
- Radzak, K. N., Putnam, A. M., Tamura, K., Hetzler, R. K., & Stickley, C. D. (2017). Asymmetry between lower limbs during rested and fatigued state running Gait in healthy individuals. Gait and Posture, 51, 268–274. https://doi.org/10.1016/j.gaitpost.2016.11.005
- Sánchez-Sánchez, J., Bishop, D., García-Unanue, J., Ubago-Guisado, E., Hernando, E., López-Fernández, J., Colino, E., & Gallardo, L. (2018). Effect of a repeated sprint ability test on the muscle contractile properties in elite futsal players. Scientific Reports, 8(1). https://doi.org/10.1038/s41598-018-35345-z
- Schache, A. G., Joo Kim, H., Morgan, D. L., & Pandy, M. G. (2010). Hamstring muscle forces prior to and immediately following an acute sprinting-related muscle strain injury. Gait and Posture, 32(1), 136–140. https://doi.org/10.1016/j.gaitpost.2010.03.006
- Schuermans, J., Van Tiggelen, D., Palmans, T., Danneels, L., & Witvrouw, E. (2017). Deviating running kinematics and hamstring injury susceptibility in male soccer players: Cause or consequence? Gait and Posture, 57, 270–277. https://doi.org/10.1016/j.gaitpost.2017.06.268
- Segers, V., Lenoir, M., Aerts, P., & De Clercq, D. (2007). Kinematics of the transition between walking and running when gradually changing speed. Gait and Posture, 26(3), 349–361. https://doi.org/10.1016/j.gaitpost.2006.10.013
- Small, K., McNaughton, L. R., Greig, M., Lohkamp, M., & Lovell, R. (2009). Soccer fatigue, sprinting and hamstring injury risk. International Journal of Sports Medicine, 30(8), 573–578. https://doi.org/10.1055/s-0029-1202822
- Stephens, T. M., Lawson, B. R., & Reiser, R. F. (2005). Bilateral asymmetries in max effort single-leg vertical jumps. Biomedical Sciences Instrumentation, 41, 317–322 .
- van den Bogert, A., & de Koning, J. J. (1996). On optimal filtering for inverse dynamics analysis. Proceedings of the IXth Biennial Conference of the Canadian Society for Biomechanics, 214–215.
- Varley, M. C., & Aughey, R. J. (2013). Acceleration profiles in elite Australian soccer. International Journal of Sports Medicine, 34(1), 34–39. https://doi.org/10.1055/s-0032-1316315
- Verschueren, J., Tassignon, B., De Pauw, K., Proost, M., Teugels, A., Van Cutsem, J., Roelands, B., Verhagen, E., & Meeusen, R. (2020). Does acute fatigue negatively affect intrinsic risk factors of the lower extremity injury risk profile? A systematic and critical review. Sports Medicine, 50(4), 767–784. https://doi.org/10.1007/s40279-019-01235-1
- von Lieres und Irwin, G., Wilkau, H. C., Irwin, G., Bezodis, N. E., Simpson, S., and Bezodis, I. N. (2020). Phase analysis in maximal sprinting: An investigation of step-to-step technical changes between the initial acceleration, transition and maximal velocity phases. Sports Biomechanics, 19(2), 141–156. https://doi.org/10.1080/14763141.2018.1473479
- Wilk, K. E., Reinold, M. M., & Hooks, T. R. (2003). Recent advances in the rehabilitation of isolated and combined anterior cruciate ligament injuries. Orthopedic Clinics of North America, 34(1), 107–137. https://doi.org/10.1016/S0030-5898(02)00064-0
- Willer, J., Allen, S., Burden, R., & Folland, J. (2021). Neuromechanics of middle-distance running fatigue: A key role of the plantar flexors? Medicine & Science in Sports & Exercise, 53(10), 2119–2130. https://doi.org/10.1249/MSS.0000000000002695
- Williams, J. D., Abt, G., & Kilding, A. E. (2010). Ball-Sport endurance and sprint test (BEAST90): Validity and reliability of a 90-minute soccer performance test. Journal of Strength and Conditioning Research, 24(12), 3209–3218. https://doi.org/10.1519/JSC.0b013e3181bac356
- Willwacher, S., Sanno, M., & Peter Brüggemann, G. (2020). Fatigue matters: An intense 10 km run alters frontal and transverse plane joint kinematics in competitive and recreational adult runners. Gait and Posture, 76, 277–283. https://doi.org/10.1016/j.gaitpost.2019.11.016
- Winter, D. A. (2009). Biomechanics and motor control of human movement. 4th ed.
- Zifchock, R. A., Davis, I., Higginson, J., & Royer, T. (2008). The symmetry angle: A novel, robust method of quantifying asymmetry. Gait & Posture, 27(4), 622–627. https://doi.org/10.1016/j.gaitpost.2007.08.006