
ABSTRACT
Well-designed talent programmes in sports with a focus on talent identification, orientation, development, and transfer support the engagement of young individuals and the pursuit of elite performance. To facilitate these processes, an analysis of task, environmental and individual characteristics per sport is much needed. The aims of this study were to 1) analyse whether unique profiles per sport could be established by generic characteristics and 2) to discuss similarities and differences for the potential application in talent development and transfer. By means of a validated survey, 1247 coaches from 34 sports ranked 18 characteristics on importance to their sports (0 = not important − 10 = very important). To discriminate the responses per sport a Discriminant Analysis (DA) was carried out. To refine the DA-classification, Uniform Manifold Approximation and Projection (UMAP) with CatBoost classifier was performed. To test the performance of the CatBoost classifier-algorithm, a confusion-matrix was generated. The cross-validated DA showed that 70.2% of the coaches were correctly classified to their sport. The UMAP/CatBoost technique revealed 75.1% accuracy with correctly predicted responses per sport ranging from 18.2% (sailing) to 98.2% (soccer). With varying precision, the algorithm was able to differentiate sports by importance of its characteristics indicating similarities and differences per sport.
1. Introduction
Youth sports is an important pillar within modern society. Evidence-based policies for (youth) sports demonstrate that well-designed sports systems and programmes can play a crucial role in encouraging sport participation across the lifespan, personal development, and elite performance (Côté & Hancock, Citation2016; Côté & Vierimaa, Citation2014; Goodway & Robinson, Citation2015). Lifetime sport participation and the potential for elite performance can be achieved through various development pathways. These pathways can be categorized as early specialization in one sport or sampling multiple sports in the younger years (Côté & Vierimaa, Citation2014), but designing these programmes remains a challenge. A significant portion of active children drop out of sports annually due to factors such as lack of enjoyment or perceived competence (Crane & Temple, Citation2015), thereby missing out on the opportunity to attain physical, psychosocial, and motor skill benefits (Moulds et al., Citation2020).
Various solutions to overcome these issues have been suggested. A crucial first step towards optimal development and maintaining young participants’ motivation is to help them choose a sport that aligns with their capabilities (Pion, Citation2015). In addition to careful sport selection, development programmes should focus on optimizing the broad development (e.g., sampling multiple sports or activities) of young participants (Côté et al., Citation2007; Goodway & Robinson, Citation2015), as this can facilitate effective and efficient transfers between sports (Strafford et al., Citation2018). This notion is supported by developmental models in youth sports such as the Mountain of Motor Development (Clark & Metcalfe, Citation2002) and the Developmental Model of Sports Participation (Côté et al., Citation2007). Compared to early specialization, developing a broad range of fundamental movement skills during early childhood offers developmental benefits. Young participants can successfully apply their acquired skills to various sports throughout their lives, have fewer barriers to achieving elite sports status, and reduce the risk of injuries and burnout (Goodway & Robinson, Citation2015). Furthermore, evidence has shown that many successful athletes have trained and competed in multiple sports, developing a wide range of skills during their formative years (Seifert et al., Citation2018).
To achieve lifetime sport participation and potential elite performance in a healthy manner, it is suggested that talent programmes in sports incorporate well-designed concepts for talent detection, orientation, identification, transfer, selection, and development (Pion, Citation2015; Williams & Reilly, Citation2000). To support these programmes, coaches must have a clear understanding of young participants’ individual performance profiles, enabling talent identification, among other factors. Moreover, having a clear picture of the requirements (e.g., physical demands) in a sport would allow coaches to 1) assign young participants to a sport that aligns with their characteristics and requirements, 2) optimize their development, and 3) potentially suggest a transfer to another sport if there is a desire or need based on motivation or a specific injury (Teunissen et al., Citation2021).
There are hundreds of sports, and each sport possesses unique characteristics, including rules, culture, environments, dress codes, materials used, and the number of players involved. Despite these differences, many similarities can be found between sports. This is evident when considering popular sports such as soccer, cricket, and field hockey, all of which are team sports played outdoors, while sports like badminton and table tennis are played individually or in pairs indoors. Most of the aforementioned sports are ball games, yet they utilise different types of balls, have varying field demarcations, and employ dissimilar equipment. Some current sports even combine elements from other sports, such as triathlon, biathlon, or the modern pentathlon. The intricate and complex interactions between individual athletes, the sport tasks, and the environment determine the unique sport profiles, highlighting both differences and similarities between sports. Understanding the similarities and differences between sport profiles can contribute to the decisions made in shaping talent development programmes. However, it is still unclear what the generic task demands are for a wide range of sports, as not all sports require similar abilities and processes (Fransen et al., Citation2012; Pion et al., Citation2015).
The hypothesis is that it is possible to profile different sports based on coaches’ perspectives of the generic environmental, individual, and task demands, thereby constructing unique profiles for each sport. These unique sport profiles can be a valuable tool for talent development, orientation, and transfer, as previously demonstrated in studies using Discriminant Analysis for racket sports (Robertson et al., Citation2018) and paddle sports (Robertson et al., Citation2018; Teunissen et al., Citation2021). Robertson et al. (Citation2018) identified key differences and similarities between racket sports using linear statistical methods such as MANOVA and Discriminant Analysis. In a second study, Teunissen et al. (Citation2021) conducted a systematic analysis of task constraints in 18 sports, revealing 1) similarities between sports that could facilitate talent transfers and expand talent pools and 2) differences between sports to identify those with complementary characteristics for the construction of broad motor development programmes. These studies used linear methods to differentiate the profiles; however, more recent non-linear techniques such as the UMAP method (McInnes et al., Citation2018) are able to classify more accurately and will be used alongside the linear method to differentiate the profiles. The current study aims to differentiate sports based on their generic individual, environmental, and task demands from the coaches’ perspective, to explore similarities and differences between sports for the purpose of optimizing talent development programmes and talent transfer pathways.
2. Materials and methods
The project has been conducted in accordance with recognised ethical standards and was approved by the local ethics committee of the Ghent University Hospital (N° 20171548; Ghent, Belgium). All data were analysed confidentially.
A total of 1247 coaches representing 34 different sportsFootnote1 Archery (n = 16), Athletics (running) (n = 17), Badminton (n = 97), Baseball/Softball (n = 12), Basketball (n = 38), Bowling (n = 17), Canoe/Kayak (n = 52), Canoe/Kayak (sprint) (n = 10), Climbing (n = 28), Cycling (n = 47), Diving (n = 18), Figure Skating (n = 25), Free running (n = 21), Futsal (n = 11), Gymnastics (n = 32), Gymnastics (trampoline) (n = 34), Handball (n = 22), Hockey (n = 14), Judo (n = 26), Karate (n = 26), Mountain biking (n = 15), Netball (n = 29), Pencak Silat (n = 28), Rowing (n = 16), Sailing (n = 11), Sepak Takraw (n = 52), Shooting (n = 34), Soccer (n = 127), Swimming (n = 63), Table Tennis (n = 85), Taekwondo (n = 15), Tennis (n = 96), Triathlon (n = 37), Volleyball (n = 76) participated in the survey. The coaches were recruited via email through the national federation of 36 countries in all continents. All the coaches who participated in the survey had official coaching diplomas and/or certificates of their respective countries. In total 964 coaches were club level coaches, 71 were national level coaches, 130 of the coaches were international level coaches and 82 of the coaches were unable to be classified.
For the data collection process, an online survey distributed by SurveyAnyplace was used. The starting page contained questions used for gathering formal information such as name, gender, age, and the different levels of coaching qualifications. The SportKompas I Need survey (Pion, Citation2015) comprised 18 questions, in which participants were asked to indicate the level of importance for different performance (n = 14), environmental (n = 3) and individual (n = 1) characteristics. The sports profile was defined by the weight 18 characteristics: indoor, or outdoor sport; contact or no-contact sport; individual or team sport and the stature of the participants tall or small; agility; balance; catching; core stability; endurance; flexibility; hitting; jump; kicking; speed; rhythm; climbing; overall strength; and throwing. The rating scale – for all questions ranged from 0 to 10, with 0 = not important at all, 10 = very important. The 11-point Likert scale was based upon the content of a validated field test battery for talent identification in Flanders in a wide variety of sports (Pion, Citation2015) and firstly introduced in the I Like web application. Intraclass Correlation (ICC) was calculated approximately 2 months after the original survey was taken on a sample of 63 certified coaches. The ICC revealed good test–retest reliability, with coefficients ranging from 0.827 to 0.860 and p < 0.001 for the individual items of the questionnaire.
Statistical analysis was performed using SPSS version 27 and the Python programming language. First, descriptive statistics are presented for 34 sports and disciplines as means and standard deviations. Second, a Discriminant Analysis (DA) was applied to elucidate the characteristics with discriminative power between the sports and cross validated with the leave-one-out method. Next, with the help of the Python programming language, the previous linear step was refined with a non-linear method to optimize the search for correlations between the features. To better represent the patterns in the data and improve the performance of eventual subsequent clustering steps, the dimensionality of the data was reduced to two features with the Uniform Manifold Approximation and Projection (UMAP) technique (Allaoui et al., Citation2020). The analysis consists of finding patterns and similarities in the data in an unsupervised manner. Dimensionality reduction can be defined as the reduction of the number of available features (i.e., the responses of the coaches on the questionnaire) to a smaller number of features, but with preservation of the meaningful patterns in the original features. The UMAP algorithm reduces the dimension of the original features based on a theoretical framework by Riemannian geometry and algebraic topology (McInnes et al., Citation2018). As a subsequent step, the two-dimensional features were used to train a CatBoost model (learning rate: 0.03, evaluation metric: AUC, cross validation: leave-one-out) to classify the sport belonging to a respondent’s answer. Next to an evaluation of the accuracy of the classification, a F1-score was calculated to represent both precision and recall of the prediction model in one metric. As a final step, a confusion matrix (see ) was generated to visualize the classification of sports based on the results of the non-linear prediction model.
Table 1. Descriptive statistics of 1247 coach responses for the importance of 18 characteristics and 34 different sports – results presented by means and standard deviations (mean (SD)).
Table 2. Confusion matrix shows the cross validated (leave-one-out) performance (accuracy: 75.1, F1-score: 74.6%) of the CatBoost classifier algorithm of correctly classified cases per sport of 1247 responses in absolute and relative values per sport. The “true label” is defined as the unsupervised machine trained algorithm for each sport. The ”predicted label” is defined as the classification of the leave-one-out response with the “true” algorithm. If “true label” is [sport] than the table shows the [%] accurately predicted responses and the misclassifications for that sport. The shading from light-to-dark shows to what extent the classification of the response is consistent with the “true” sport. The misclassifications for each sport show possible similarities with the “true” sport.
3. Results
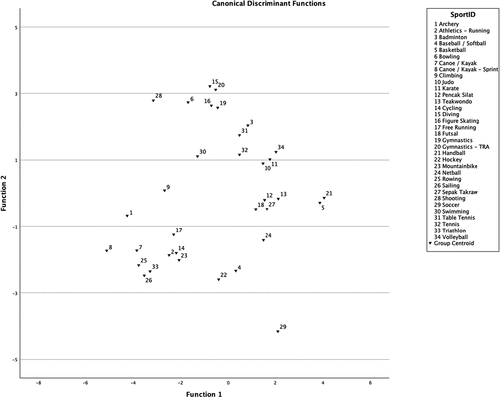
Descriptive statistics for all characteristics (n = 18) and all sports (n = 34) are presented in . Discriminant Analysis (see ) resulted in 18 significant functions. The first function (rcan = .908, Wilks’ Lambda < 0.001 and p < 0.001) accounted for 24.7% of the variance between the 34 sports, while the second function (rcan = .907, Wilks’ Lambda < 0.001 and p < 0.001) augmented the variance to 48.9%. With every next function, the variance increased, until the 18th function reached 100%. The cross validated LDA showed that 70.2% of the coaches of the 34 different sports were correctly assigned to their sport.
Figure 1. Linear classification plot based on the first two canonical discriminant functions (correctly classified accuracy: 70.2%). Data points (n = 1247) for all sports (n=34) are presented as group centroids and show the clustering of coach responses. The numerical values represent the sports included in the analysis, and the proximity of their centroids indicates the degree of overlap between different sports.
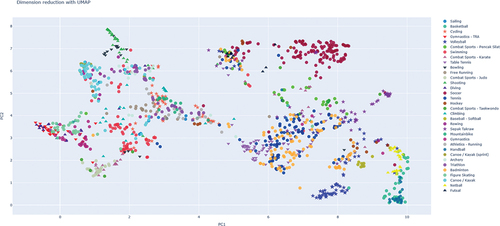
Furthermore, non-linear classification of the sports based on the underlying features revealed that the UMAP technique reduced the items and its underlying correlations in two principal components (see PC1 & PC2 in ). The non-linear CatBoost method showed a higher accuracy compared to the LDA in predicting to which sport the underlying features belonged (accuracy-score = 75.1%, F1-score = 74.6%).
Figure 2. Two-dimension feature space of reduced questionnaire data by UMAP method (correctly classified accuracy: 75.1%). Data points (n = 1247) show the clustering per sport (n = 34). PC1 & PC2 are the principal components of the reduced questionnaire data. The Figure shows the degree of overlap between the 34 different sports.
The percentages of correctly classified responses using the CatBoost classifier are shown in descending order according to the percentage of correct classifications. Next, to the number of correctly classified responses, CatBoost also revealed the mismatched responses from the leave-one-out validation (see mismatches per sport between brackets and their percentage of total number of responses per “true” sport): Soccer 98.4% (Teakwondo 0.8%, Volleyball 0.8%); Shooting 94.1% (Swimming 2.9%, Tennis 2.9%); Netball 93.1% (Soccer 3.5%, Basketball 3.5%); Swimming 92.1% (Badminton 1.6%, Bowling 1.6%, Canoe/Kayak 1.6%, Pencak Silat 1.6%, Tabel Tennis 1.6%); Volleyball 92.1% (Basketball 1.3%, Netball 2.6%, Sepak Takraw 2.6%, Tennis 1.3%); Baseball/Softball 91.7% (Volleyball 8,3%); Sepak Takraw 90.4% (Badminton 3,9%, Cycling 1.9%, Figure Skating 1.9%, Volleyball 1.9%); Judo 88.5% (Karate 7.7%, Gymnastics 3.9%); Triathlon 86.5% (Canoe/Kayak 5.4%, Sailing 5.4%, Soccer 2.7%); Free running 85.7% (Archery 4.8%, Climbing 4.8%, Cycling 4.8%); Canoe/Kayak 82.7% (Canoe/Kayak (sprint) 1.9%, Cycling 3.9%, Rowing 1.9%, Sailing 1.9%, Swimming 1.9%, Tennis 1.9%, Triathlon 3.9%); Canoe/Kayak (sprint) 20% (Canoe/Kayak 80%); Cycling 74.5% (Athletics (running) 2.1%, Canoe/Kayak 4.3%, Free running 2.1%, Mountain bike 2.1%, Swimming 6.4%, Triathlon 8.5%); Badminton 74.2% (Figure Skating 1.0%, Futsal 3.1%, Sepak Takraw 2.1%, Table Tennis 6.2%, Tennis 12.4%, Volleyball 1.0%); Tennis 71.9% (Badminton 15.6%, Cycling 1.0%, Hockey 1.0%, Speak Takraw 2.1%, Table Tennis 8.3%); Climbing 71.4% (Archery 3.6%, Athletics (running) 3.6%, Badminton 3.6%, Canoe/Kayak 3.6%, Cycling 7.1%, Diving 3.6%, Swimming 3.6%); Hockey 71.4% (Rowing 7.1%, Soccer 7.1%, Volleyball 14.3%); Basketball 71.1% (Figure Skating 2.6%, Handball 21.1%, Netball 5.3%); Archery 68.8% (Canoe/Kayak 18.8%, Cycling 6.3%, Tennis 6.3%); Gymnastics (trampoline) 67.7% (Diving 5.9%, Figure Skating 5.9%, Gymnastics 17.7%, Table Tennis 2.9%); Karate 65.4% (Judo 11.5%, Pencak Silat 15.4%, Taekwondo 3.9%, Gymnastics 3.9%); Table Tennis 63.5% (Badminton 11.8%, Tennis 24.7%); Futsal 63.6% (Pencak Silat 18.2%, Taekwondo 9.1%, Soccer 9.1%); Bowling 64.7% (Gymnastics 5.9%, Netball 5.9%, Shooting 17.7%, Tennis 5,9%); Gymnastics 59.4% (Badminton 6.3%, Basketball 3.1%, Climbing 3.1%, Pencak Silat 3.1%, Taekwondo 3.1%, Figure Skating 6.3%, Gymnastics (trampoline) 9.4%, Tennis 3.1%, Volleyball 3.1%); Figure Skating 56.0% (Badminton 4.0%, Basketball 4.0%, Canoe/Kayak 4.0%, Diving 8.0%, Gymnastic 12.0%, Gymnastic (trampoline) 12.0%); Athletics (running) 52.9% (Canoe/Kayak 5.9%, Cycling 17.7%, Mountain bike 5.9%, Tennis 5.9%, Triathlon 11.8%); Rowing 50.0% (Canoe/Kayak 31.3%, Canoe/Kayak (sprint) 12.5%, Cycling 6.3%); Pencak Silat 46.4% (Basketball 3.6%, Canoe/Kayak 3.6%, Judo 3.6%, Karate 7.1%, Taekwondo 10.7%, Figure Skating 3.6%, Futsal 14.3%, Swimming 3.6%, Tennis 3.6%); Handball 45.5% (Basketball 50.0%, Pencak Silat 4.6%); Mountain biking 40.0% (Athletics (running) 6.7%, Cycling 40.0%, Triathlon 13.3%); Diving 33.3% (Figure Skating 16.7%, Gymnastics 5.6%, Gymnastics (trampoline) 44.4%); Taekwondo 33.3% (Judo 6.7%, Karate 6.7%, Pencak Silat 33.3%, Futsal 6.7%, Sepak Takraw 6.7%, Tennis 6.7%); Sailing 18.2% (Canoe/Kayak 45.5%, Cycling 9.1%, Rowing 9.1%, Tennis 9.1%, Triathlon 9.1%).
4. Discussion
The purpose of this study was to examine to what extent different generic characteristics vary between sports by classifying coach responses per sport based on a trained algorithm. The analysis revealed that sports can be classified with varying results, as shown in , by individual, task, and environmental characteristics to generate unique profiles for optimal talent orientation, identification, development, and transfer. This study found that different classification models could be used to assign individual coach responses to their sport. A cross-validated classification model (DA) can allocate 70.2% of the coach responses to their sport, while the cross-validated machine-trained model (UMAP/CatBoost) showed 75.1% accuracy. A more in-depth analysis of the classification of individual coach responses by the machine-trained model () shows that most coach responses could be classified to their own sport.
As hypothesized, the algorithm could differentiate between sports. However, some predictions were mismatched with the “true” sport (see ). The mismatch is initiated by the considerable overlap in the importance of characteristics between sports, possibly revealing options for talent transfer by similarities in task, environmental, and individual constraints. This study revealed that the algorithm was unable to make a clear distinction between the included racket sports (i.e., badminton, tennis, table tennis), suggesting a similar sport profile between these sports. These findings are in line with Robertson et al. (Citation2018) where similar results were obtained between racket sports profiles. Moreover, diving showed a similar profile compared to gymnastics (trampoline) and figure skating. The similarities between these artistic sports are in line with the findings of Pion et al. (Citation2021) where the importance of similar skills between different sports (e.g., Figure Skating, Gymnastics, Gymnastics Trampolining, and Free running) is compared for joint talent development. Furthermore, the included paddle sports (i.e., canoe/kayak and canoe/kayak sprint) also show a considerable overlap in their profiles. The paddle sport disciplines differ in specific task and individual demands, however, the generic character (e.g., core stability, pulling, pushing) of the items in the survey made a clear distinction between these disciplines not possible. These findings enable us to advise athletes on a possible transition to another sport if they wish to leave their current sport and have the desire to quickly engage in a new sport. However, this is possible if sports show a considerable overlap (Seifert et al., Citation2018). Additionally, this data provides insights into which skills are important in sports, thereby assisting government sports agencies with a more systematic approach in efficiently establishing talent identification and transfer programmes. This can be achieved by linking athlete profiles (such as strength, endurance, etc.) to sport profiles. Programmes like Girls4Gold (UK Sport) demonstrate the success of such identification programmes in identifying talent for a new sport (Collins et al., Citation2014). By understanding the demands placed on an athlete to achieve performance in a specific sport (sport profile), it becomes possible to optimize the alignment with athlete profiles, thereby enhancing the efficiency of talent identification programmes.
Similarities between sports were also found when Basketball and Handball were compared. As mentioned, algorithms were set up for each sport, which are unique given the weights assigned by the coaches to the characteristics. However, when Basketball’s algorithm is compared with Handball, 21% of Basketball responses are classified as Handball. However, if the algorithm of Handball is compared with Basketball, then 50% of Handball responses are classified as Basketball (see ). The lack of reciprocity between profiles may be explained by the differential weighting of characteristics across sports. The more a characteristic is involved in making critical decisions within the algorithm, the greater its relative importance. Consequently, the influence of a characteristic in a specific profile may have an inverse relationship with characteristics in other profiles, aiming to optimize the classification process. Within the transfer of learning paradigm, this negative influence of skills can result in negative transfer between sports. Learning one of these skills typically hinders the initial learning of the other skill, as noted by Edwards (Citation2011). This dampening effect of experience in one skill on the performance of another skill leads to negative transfer. This could be the case between Basketball and Handball, where the unique profiles may appear similar, but there may be different positive and potentially negative relationships among the characteristics, which could potentially explain the lack of reciprocity. These findings align with the research conducted by Travassos et al. (Citation2018), which suggests that Futsal can serve as a donor sport, facilitating the transfer of skills related to ball control and technique to soccer. However, the cross over from soccer to Futsal may not be as prominent.
Despite the apparent similarities and shared traits that one might expect between certain skills (such as basketball and baseball, tennis and racquetball, gymnastics and springboard diving), it is noteworthy that these activities actually rely on significantly distinct clusters of motor abilities for their execution (Edwards, Citation2011). This demonstrates that for every sport, a unique cluster of corresponding sports with relative similarities can be generated based on the combination of characteristics. This cluster of related sports provides coaches with the opportunity to specifically search for similar sports and can facilitate the search for corresponding sports. We could propose this approach of clustering sports by its degree of overlap as a “sport family”. This grouping into “families” per sport based on relative similarities can also be found in approaches like Teaching Games for Understanding (Bunker & Thorpe, Citation1982). In this approach, sports are grouped into categories such as net/wall games to facilitate talent development and talent transfer (García López et al., Citation2009). In essence, the sports may appear different, but the unique combination of characteristics shows significant similarities.
In addition to similarities between sports, it is also noticeable that soccer appears to be unique. When looking at the dataset, it becomes evident that soccer has a unique combination of characteristics, outdoor play and kicking. This combination of characteristics is not found in any other sport in the dataset. A glance at the sports landscape reveals that there are few sports with this combination. Rugby, American Football, and Australian Football also share this combination, but they include throwing, which is prohibited in soccer. Does this mean there are no similarities between soccer and other sports? Not at all, but we believe a distinction needs to be made between searching for similarities in sports for talent development and for talent transfer. For talent development, it is possible to look for similarities in specific characteristics across sports, learning, for example, how kicking is done in other sports (e.g., Taekwondo) can inspire coaches to adjust their training sessions with variation of practice in their minds. Also, the interdependent connections among various sports can aid coaching interventions in devising practice tasks that emphasize informational constraints, encouraging learners to engage in exploration, discovery, and adaptations (Travassos et al., Citation2018). However, for talent transfer and a more efficient transition to another sport, it is desirable to examine the complex relationships between characteristics and its environment (Seifert et al. Citation2018). After all, this provides the greatest overlap between sports, potentially increasing the likelihood of a successful transition.
This study leads to insights about the characteristics that determine 34 sports. These insights can help sport scientists to choose field tests that match the different characteristics needed in a specific sport so that transfer between sports with the same characteristics is possible. Some talent identification/orientation studies applied a generic test battery to show the differences and similarities of athlete profiles between sports. Pion et al. (Citation2014) argued that orientation is possible when the characteristics of combat sports match with the personal characteristics of young athletes. In this study by Pion et al. (Citation2014), it was shown that the differences between athlete profiles were more pronounced in the older athletes. This is in line with the development of performance profiles of young athletes over time (Opstoel et al., Citation2015). Young athletes who spent more time on task-specific training in a sport-specific environment showed a less diverse performance profile. It can, therefore, be hypothesized that task-specific training in a specific environment will shape specific athlete profiles in line with the task demands of the sport.
Although the extensive number of coach responses and variety of sports included in this study, possible limitations must be acknowledged. A limitation of this study is the narrow focus of the characteristics within the sport profiles. The sport profiles were only constructed for environmental, physical, and motoric characteristics from the SportKompas study (Pion, Citation2015). A broader scope of generic characteristics in other domains (e.g., intellectual, intrapersonal, and social abilities) as proposed by Collins et al. (Citation2014) with relevance for talent transfer could benefit from the methods proposed here. Also, the dataset is large in total, however the number of responses per sport vary. Although the ICC (see Materials & Methods) shows a good reliability for the survey, increasing the number of responses for some sports could help establish a more solid profile for these sports. Furthermore, constructing sport profiles from the perspective of the coach on their sport is supposed to be a valid method. However, coaches differ in their philosophy and vision on development and training in their sport. It is suggested that the training philosophy of the coach and/or sport organizations influences performance outcomes. Within this study, we made no distinction between culture or country based on the little number of responses per country and, therefore, chose to average coach responses of similar sports, regardless of coach origin.
Future research may focus on clustering sports by similarities in their profiles. This may enable coaches to optimize talent development programmes by searching for and applying similar task demands in different environments, therefore stimulating practice variation. It is also suggested to broaden the focus of the included characteristics beyond physical, environmental, and motoric items to construct more comprehensive sport profiles for talent transfer, orientation, and development by including psychological items like suggested by Collins et al. (Citation2014). Further, we could look at the non-reciprocity of the algorithms by sport. It is possible that some sports are more suitable to transfer to than others when the profiles are compared. This could increase the chances of a successful transfer if we know which sports these are then.
In conclusion, unique sport profiles can be created based on the coach’s perspective on the task and environmental requirements of the sport. This approach is an innovative gateway to assign individuals with specific characteristics to a sport in a more targeted way. The confusion matrix shows possible similarities between sports to 1) suggest a transfer to another relatively similar sport when interest declines in the target sport or due to injuries or 2) to optimize the search for inspiring exercise with relatively similar characteristics in different sports. Additionally, it provides options for talent development programmes to look for additional sports for broad development.
Acknowledgments
The authors would like to thank all the coaches who took the time sharing their experience in completing the I Need survey and also Elena Wopperer for her contribution to the results section.
Disclosure statement
No potential conflict of interest was reported by the authors.
Notes
1 For some specific sports, the number of coaches’ reponses was low. In order to obtain a sufficient number of cases in each (sports)group, and after consulting experts in the field, it was decided to merge data from Baseball/Softball and Canoe/Kajak based upon common characteristics of the task, the athlete, and the environment.:
References
- Allaoui, M., Kherfi, M. L., & Cheriet, A. (2020). Considerably improving clustering algorithms using umap dimensionality reduction technique: A comparative study. Lecture Notes in Computer Science (Including Subseries Lecture Notes in Artificial Intelligence and Lecture Notes in Bioinformatics), 12119 LNCS, 317–325. https://doi.org/10.1007/978-3-030-51935-3_34
- Bunker, D., & Thorpe, R. A. (1982). A model for the teaching of games in secondary schools. Bulletin of Physical Education, 18, 5–8.
- Clark, J. E., & Metcalfe, J. S. (2002). The mountain of motor development. In J. E. Clark & J. Humphrey (Eds.), Motor development: Research and reviews (Vol. 2, pp. 163–190). NASPE Publications.
- Collins, R., Collins, D., Macnamara, Á., & Jones, M. I. (2014). Change of plans: An evaluation of the effectiveness and underlying mechanisms of successful talent transfer. Journal of Sports Sciences, 32(17), 1621–1630. https://doi.org/10.1080/02640414.2014.908324
- Côté, J., Baker, J., & Abernethy, B. (2007). Practice and play in the development of sport expertise. In G. Tenenbaum & R. C. Eklund (Eds.), Handbook of sport psychology (3rd ed., pp. 184–202). John Wiley & Sons. Inc. https://doi.org/10.1002/9781118270011.ch7
- Côté, J., & Hancock, D. J. (2016). Evidence-based policies for youth sport programmes. International Journal of Sport Policy & Politics, 8(1), 51–65. https://doi.org/10.1080/19406940.2014.919338
- Côté, J., & Vierimaa, M. (2014). The developmental model of sport participation: 15 years after its first conceptualization. Science & Sports, 29, 63–69. https://doi.org/10.1016/j.scispo.2014.08.133
- Crane, J., & Temple, V. (2015). A systematic review of dropout from organized sport among children and youth. European Physical Education Review, 21(1), 114–131. https://doi.org/10.1177/1356336X14555294
- Edwards, W. H. (2011). Motor Learning and Control. From Theory to Practice. www.cengage.com/highered
- Fransen, J., Pion, J., Vandendriessche, J., Vandorpe, B., Vaeyens, R., Lenoir, M., & Philippaerts, R. M. (2012). Differences in physical fitness and gross motor coordination in boys aged 6–12 years specializing in one versus sampling more than one sport. Journal of Sports Sciences, 30(4), 379–386. https://doi.org/10.1080/02640414.2011.642808
- García López, L. M., Contreras Jordán, O. R., Penney, D., & Chandler, T. (2009). The role of transfer in games teaching: Implications for the development of the sports curriculum. European Physical Education Review, 15(1), 47–63. https://doi.org/10.1177/1356336X09105211
- Goodway, J. D., & Robinson, L. E. (2015). Developmental trajectories in early sport specialization: A case for early sampling from a physical growth and motor development perspective. Kinesiology Review, 4(3), 267–278. https://doi.org/10.1123/kr.2015-0028
- McInnes, L., Healy, J., & Melville, J. (2018). UMAP: Uniform Manifold Approximation and Projection for Dimension Reduction. http://arxiv.org/abs/1802.03426
- Moulds, K., Abbott, S., Pion, J., Brophy-Williams, C., Heathcote, M., & Cobley, S. (2020). Sink or swim? A survival analysis of sport dropout in Australian youth swimmers. Scandinavian Journal of Medicine and Science in Sports, 30(11), 2222–2233. https://doi.org/10.1111/sms.13771
- Opstoel, K., Pion, J., Elferink-Gemser, M., Hartman, E., Willemse, B., Philippaerts, R., Visscher, C., Lenoir, M., & Buchowski, M. (2015). Anthropometric characteristics, physical fitness and motor coordination of 9 to 11 year old children participating in a wide range of sports. PLoS ONE, 10(5), 1–16. https://doi.org/10.1371/journal.pone.0126282
- Pion, J. (2015). The Flemish Sports Compass from Sports Orientation to Elite Performance Prediction. http://www.universitypress.be
- Pion, J., Fransen, J. B., Lenoir, M., Segers, V., Pion, J., Fransen, J. B., Lenoir, M., & Segers, A. C. D. (2014). The value of non-sport-specific characteristics for talent orientation in young male judo, karate and taekwondo athletes. Archives of Budo, 10(1), 147–154. www.archbudo.com
- Pion, J., Segers, V., Fransen, J., Debuyck, G., Deprez, D., Haerens, L., Vaeyens, R., Philippaerts, R., & Lenoir, M. (2015). Generic anthropometric and performance characteristics among elite adolescent boys in nine different sports. European Journal of Sport Science, 15(5), 357–366. https://doi.org/10.1080/17461391.2014.944875
- Pion, J., Teunissen, J. W., Welle, S., Spruijtenburg, G., Faber, I., & Lenoir, M. (2021). How similarities and differences between sports lead to talent transfer; a process approach. In J. Baker, S. Cobley, & J. Schorer (Eds.), Talent identification and development in sport (pp. 184–196). Routledge.
- Robertson, K., Pion, J., Mostaert, M., Norjali Wazir, M. R. W., Kramer, T., Faber, I. R., Vansteenkiste, P., & Lenoir, M. (2018). A coaches’ perspective on the contribution of anthropometry, physical performance, and motor coordination in racquet sports. Journal of Sports Sciences, 36(23), 2706–2715. https://doi.org/10.1080/02640414.2018.1441941
- Seifert, L., Papet, V., Strafford, B. W., Coughlan, E. K., Davids, K., Dicks, M., O’Halloran, J., & Navarro, M. (2018). Skill transfer, expertise and talent development: An ecological dynamics perspective. Movement & Sport Sciences - Science & Motricité, 102(102), 39–49. https://doi.org/10.1051/sm/2019010
- Strafford, B. W., van der Steen, P., Davids, K., & Stone, J. A. (2018). Parkour as a donor sport for athletic development in youth team sports: Insights through an ecological dynamics lens. Sports Medicine - Open, 4(1), 21. https://doi.org/10.1186/s40798-018-0132-5
- Teunissen, J. W. (., Ter Welle, S. (., Platvoet, S. (., Faber, I., Pion, J., & Lenoir, M. (2021). Similarities and differences between sports subserving systematic talent transfer and development: The case of paddle sports. Journal of Science & Medicine in Sport, 24(2), 200–205. https://doi.org/10.1016/j.jsams.2020.09.005
- Travassos, B., Araújo, D., & Davids, K. (2018). Is futsal a donor sport for football?: Exploiting complementarity for early diversification in talent development. Science and Medicine in Football, 2(1), 66–70. https://doi.org/10.1080/24733938.2017.1390322
- Williams, A. M., & Reilly, T. (2000). Talent identification and development in soccer. Journal of Sports Sciences, 18(9), 657–667. https://doi.org/10.1080/02640410050120041