
ABSTRACT
Footballers with vision impairment (VI) are eligible to compete in the Para sport if they meet a minimum impairment criteria (MIC) based on measures of their visual acuity (VA) and/or visual field. Despite the requirements of the International Paralympic Committee Athlete Classification Code that each sport uses an evidence-based classification system, VI football continues to use a medical-based system that lacks evidence to demonstrate the relationship between impairment and performance in the sport. The aim of this study was to systematically simulate vision loss to establish the minimum level of impairment that would affect performance in futsal. Nineteen skilled sighted players completed tests of individual technical skill and anticipation performance under six levels of simulated blur that decreased both VA and contrast sensitivity (CS). VA needed to be reduced to a level of acuity that represents worse vision than that currently used for inclusion in VI football before meaningful decreases in performance were observed. CS did not have a clear effect on football performance. These findings produce the first evidence for the minimum impairment criteria in VI football and suggest a more severe degree of impairment may be required for the MIC.
Introduction
Legitimate sporting competition requires a fair contest between participants. The process of grouping athletes to create fair competition is known as classification. Athletes competing within a given sport are commonly grouped by sex, age, weight, and/or impairment type to ensure skilled performance determines the winner. For example, combat sports use weight categories to ensure fighters compete against others of a comparable weight. In a similar vein, Para athletes are grouped to compete against others who have a similar impairment. The goal of classification in Para sport is to minimise the impact of impairment on the outcome of competition (Tweedy & Vanlandewijck, Citation2011; Tweedy et al., Citation2014). To compete in Para sport, such as football for athletes with vision impairment (VI football), athletes are required to meet the minimum impairment criteria (MIC) that represents the lowest level of impairment that has an impact on performance in the specific sport. The MIC and other classification processes need to be based on sport-specific research evidence (International Paralympic Committee, Citation2015), no such evidence currently exists for VI football.
Historically, Para sport classified athletes based on medical diagnosis. This then moved towards a functional system based on type and severity of an impairment, such as level of vision loss. Sports for athletes with vision impairments all used the same system that was based on the World Health Organisation definitions of low vision and blindness (World Health Organisation, Citation2004; see ). This system remains in many sports and uses three classes (B1, B2 and B3). B1 athletes are effectively blind with some having the ability to perceive light. The B2 and B3 classes have progressively more sight. Football for VI athletes is an adapted version of futsal that incorporates sighted goal keepers and is currently structured into two different competitions, with different rules and adaptations based on the level of vision impairment of the outfield players. In the men’s game B1 athletes compete in a separate class while wearing eyeshades, with sound in the ball and barriers around the pitch and B2 and B3 athletes compete together without eye shades, instead relying on their remaining sight (IBSA Football, Citation2023). In the women’s game, all athletes compete with eyeshades and other B1 adaptations. The two men’s versions are sometimes even considered to be different Para sports and currently have different rule books (IBSA Football, Citation2023). Only the class for male B1 athletes is currently offered in the Paralympic Games. We use the term VI football to capture both “blind football” and “partially sighted football”.
Table 1. Current classes based on visual acuity and visual field; LogMAR 1.0 represents the current MIC (World Health Organisation, Citation2004.).
This current system for classification in VI football does not account for how the impairment affects performance in the specific Para sport. For example, the loss of the peripheral visual field may not impact performance in archery, where the athlete can still view the target using their central vision, but it may impact performance in a sport where athletes need awareness of opponents around them, such as VI football. In order to create legitimate competition, it is important to understand the relationship between a specific impairment and how it might impact performance in a specific sport (International Paralympic Committee, Citation2015). As a result, the IPC now requires all Para sports to have an evidence-based sport-specific classification system.
Sports for athletes with physical impairments, such as Para athletics wheelchair racers (Beckman et al., Citation2014; Vanlandewijck et al., Citation2011), have a long history of research into the relationship between impairment and performance. In Para football, a body of work has been conducted on the impairment–performance relationship for athletes with cerebral palsy (Pastor et al., Citation2019; Reina et al., Citation2020). However, sports for athletes with vision impairments, including VI football, have made slower progress. Research is therefore required to investigate the minimum impairment criteria (MIC) for an individual to compete in Para sport. For VI football this is currently a visual acuity (VA) of 1.0 logMAR or visual field of less than 40 degrees diameter. This MIC would represent the criteria needed for women to compete in their single version of the game, and for men to compete in the partially sighted game. Our initial focus in this study will be the MIC for VA and further research can then be conducted into visual field and then to establish the sport classes to which eligible athletes who meet the MIC should be allocated (International Paralympic Committee, Citation2016).
A Delphi study that consulted an expert panel across a variety of VI sports found that the existing three-class approach used across almost all Para sports (see ) did not achieve the aim of classification to minimise the impact of impairment on performance (Ravensbergen et al., Citation2016). To address this issue, the International Blind Sports Federation (IBSA) and the IPC published a joint consensus statement that outlined research models for the development of evidence-based sport-specific classification for VI sports (Mann & Ravensbergen, Citation2018). On the basis of these models, a number of individual VI sports including shooting (Allen et al., Citation2016, Citation2018, Citation2019; Myint et al., Citation2016), swimming (Fortin-Guichard et al., Citation2022; Ravensbergen et al., Citation2018), skiing (Stalin & Dalton, Citation2021, Citation2023; Stalin et al., Citation2021), athletics (Allen et al., Citation2020), and judo (Krabben et al., Citation2018, Citation2019) have developed evidence bases for classification which led to policy changes. Team sports, where it is more challenging to measure an individual’s performance, have made slower progress. However, research is under way in goalball (Martin et al., Citation2023) and VI football (Runswick et al., Citation2021).
Success in developing research evidence to guide classification in these sports has been informed by a variety of methods suggested in the IBSA/IPC consensus statement (Mann & Ravensbergen, Citation2018). Expert consultations are conducted to garner current knowledge and understanding of important aspects of visual function that might affect certain elements of performance (Allen et al., Citation2021; Krabben et al., Citation2019; Ravensbergen et al., Citation2016, Citation2018; Runswick et al., Citation2021). To establish evidence for MIC, researchers have used “simulation studies” whereby sighted athletes have their vision systematically impaired using lenses or filters to establish the point at which impairment becomes severe enough to affect performance (Allen et al., Citation2018; Krabben et al., Citation2021). This method allows the amount of impairment to be controlled along with the time that individuals have had to adapt to that impairment. Finally, work is then conducted to test existing athletes with VI to produce evidence which guides the development of sport classes for those para-athletes who are eligible to compete (e.g., Allen et al., Citation2019; Chun et al., Citation2019; Fortin-Guichard et al., Citation2022).
The classification research process requires an ability to implement valid and reliable measures of both the impairment (visual function) and of performance in that Para sport. When establishing the MIC, performance should be evaluated in the unadapted form of the sport given that the MIC should be the level of impairment that impacts performance in the absence of any adjustments made to the sport to make it more accessible for people with impairment (Mann & Ravensbergen, Citation2018). Therefore, when establishing the MIC for VI football, there is a need to consider how VI impacts performance in the sport of futsal, played without eyeshades, given that it is the equivalent unadapted form of VI football. To develop an understanding of vision impairment and performance in futsal, Runswick et al. (Citation2021) conducted an expert consultation with an international panel of players, coaches, and officials with an average of 16 years’ experience in VI football across all current sport classes. The Delphi study focused on understanding the aspects of performance and visual function that need to be measured in classification research. The panel then identified ten elements of football/futsal performance and prioritised these for research by establishing which are most important to winning matches and most likely to be affected by vision impairment. Technical elements of performance, such as ball control, dribbling, and passing, were followed by perceptual-cognitive skills such as spatial awareness, anticipation, and decision-making. The lowest priority areas were related to set plays, movement, and tactics. This provided a guide to what needs to be measured in performance tests to establish evidence for the impairment–performance relationship in VI football. The panel also identified six measures of visual function that could affect these elements of performance, VA, visual field, dynamic VA, motion perception, contrast sensitivity (CS), and light sensitivity.
Despite the international popularity of football, and the wealth of research in the sport (Reilly & Gilbourne, Citation2003), there remains a lack of performance measures suitable for classification research. To address this, Runswick et al. (Citation2022) developed the Vision Impaired Football Skills (VIFS) test. The VIFS test is an adapted form of the Futsal Special Performance Test (Farhani et al., Citation2019) that removes the need for additional players for testing, incorporates high contrast passing targets (Runswick et al., Citation2021). To ensure content validity, the VIFS test involves timed completion of a skills course on a futsal court and focuses on the technical elements of performance identified as most important to measure in the previous Delphi study (Runswick et al., Citation2021). It has been made accessible for players with VI and to be practical to use across testing locations. The test was developed alongside experienced coaches and practitioners to ensure face validity. Construct validity was measured by comparing performance on the test by two groups of sighted players who were matched in football experience but differed in their highest level of performance achieved. Within and between-day reliability were measured through participants completing the test six times across two days. The VIFS test was found to be both valid and reliable.
While the VIFS test includes anticipation and decision-making elements in the form of responding to a defender, it focuses solely on play while in possession of the ball and does not directly measure anticipation skills from a defensive perspective. The ability to anticipate the actions of an opponent and to respond in an appropriate amount of time are important in both attacking and defensive play (see Harris et al., Citation2022; Runswick et al., Citation2021). Therefore, valid and reliable measures of anticipation performance in football would also be beneficial in establishing the impairment–performance relationship. Many studies in this area test anticipation skill using screen-based tests that are filmed from the defender’s perspective and that occlude prior to the execution of an action. While these tests only capture visual elements of the task and not the full cycle of perception and action, expert to novice differences have shown these tests to be valid in other games sports, such as cricket (Runswick et al., Citation2019), rugby (Runswick et al., Citation2020), and also in football (Roca et al., Citation2011). However, there is variability in how these tests are displayed and levels of reliability have yet to be evidenced (Mann & Savelsbergh, Citation2015).
With the combination of valid and reliable measures of performance and an understanding of the aspects of visual function that could affect performance, it is possible to conduct research into the impairment–performance relationship in Para sport and thereby to establish an evidence-based MIC. In this initial study, we focus on VA and CS for several reasons. These have been identified as two of the six aspects of visual function that are most likely to affect performance in football (Runswick et al., Citation2021) and it is not practical in a repeated measures design to simulate and test all measures of visual function in one study. VA and CS are the focus here over measures, such as visual field, because they have been shown to have importance to performance in other sports (Allen et al., Citation2018) and can be practically simulated across a wide spectrum using the same established methods to minimise burden on participants (Krabben et al., Citation2022). It is therefore possible to investigate the effect of different levels of impairment that are both less than and greater than the current MIC that is primarily based on VA and set at 1.0 logMAR, while maintaining a practical number of repeated measures. Using simulations allows us to control the amount that the players have adapted to their impairment to ensure that the classification system does not penalise those who are better adapted to their vision impairment. Here, we simulate vision impairment using lenses to simulate a range of different levels of impairment to VA and CS in fully sighted football players (e.g., see Krabben et al., Citation2022). We develop and validate an anticipation test and measure changes in performance in the anticipation test and the VIFS test (Runswick et al., Citation2020). The aim of this study was to systematically simulate vision loss to establish the minimum level of impairment that would affect performance in futsal. The results were expected to lead to evidence for the MIC in football for athletes with visual impairment.
Method
Participants
Nineteen sighted footballers (mean VA = −0.14 ± 0.09; mean age = 25.9 ± 6.4 years [range = 19–39 years]; mean competitive experience = 13.8 ± 5.1 years [range = 7–22 years]) who had competed at semi-pro (n = 5) and county (n = 9) level or in organised amateur leagues (n = 5) took part in the study. Five females and fourteen males were recruited given the need for classification evidence that reflects both the men’s and women’s games, though we did not expect the relationship between impairment and performance to differ by sex. Our sample size was planned based on an a priori sample size calculation to detect a medium effect (f = 0.25) with two-tailed α of 0.05, power (1-β) of 0.80 across six repeated measures (simulation levels) with a moderate correlation between measures (0.5) resulting in a total sample size of 19. This presents a practically feasible sample based on availability of the skilled player population for multiple visits (Campitelli, Citation2019; Lakens, Citation2022). Participants were compensated £10 per hour. The study was approved by the local university research ethics committee (REF: 1920_23). All participants signed informed consent forms prior to participating.
Simulation of vision impairment
Following pilot testing, safety glasses produced by Bollé Safety, (Surrey, UK) were chosen as mounts for simulation lenses due to their robustness to movement during sprinting and changes of direction. Hampshire Frost (HF) filters that are produced by Lee Filters (Reading, UK) were chosen as these are the same as those used in the established “Cambridge simulation glasses” (Goodman-Deane et al., Citation2013). These filters come in a variety of levels of blur with product number HF258 representing the lowest level of blur followed by HF257, HF256, and then HF253. These are also referred to as 1/8 strength, 1/4 strength, ½ strength and full strength, but we will not use those terms here as two 1/4 filters do not represent the same level of blur as one 1/2. It is possible to layer these different strengths of filter and mount them into the frames as you would with lenses in a pair of reading glasses. Through pilot testing, we aimed to develop a systematic decrease in both VA and CS that reflected a range of impairments that stretch either side of the current VA MIC of 1.0 logMAR. The actual impairment simulated can be viewed in .
Table 2. Mean ± SD (min – max) for each level of simulated impairment in this study.
Measures
Measures of vision
For practical reasons, vision testing occurred in the same area of an indoor sports dome where performance testing also took place. The lighting level averaged 328 lux. This lighting level is slightly above what is recommended when testing VA (British Standards Institution, Citation2009), but more closely represents the outdoor conditions of blind football. All tests followed the standardised procedures recommended by developers or manufacturers.
Visual acuity (VA) was measured in logMAR. Higher logMAR values represent worse VA. An externally illuminated Early Treatment Diabetic Retinopathy Study Chart (ETDRS) LogMAR letter chart at 4 m (2000 Series Revised, Precision Vision, La Salle, IL, USA) was used to detect distance VA. Letter by letter scoring was used. The Berkeley Rudimentary Vision Test (BRVT; Bailey et al., Citation2012; Cal, USA) was used when participants could not read any letters from the ETDRS.
Contrast sensitivity (CS) was measured in logCS with a lower value representing worse CS. Two tests were used to measure CS, the Berkeley Contrast Sensitivity Test (BCST), which was administered on a 13-inch tablet (Apple iPad Pro, 1st generation, Cupertino, CA, USA) (CSapp) and the MARS numbers test (Mars Perceptrix, Chappaqua, NY; CSmars).
Technical performance (VIFS) test
The VIFS test takes place on a futsal court and is designed to capture the technical elements of performance that have been suggested to be affected by VI and important to performance in football (Runswick et al., Citation2021). Two researchers are required during testing, the tester, and the defender (). The tester timed using a stopwatch and followed the player while filming using a smartphone, this allowed for all penalties and exact timing to be checked post-hoc. Players were required to navigate a course () of ball control, dribbling, changes of direction and passing around a futsal court with defender to incorporate an element of anticipation and decision-making and to enhance content and face validity. The start was indicated by a call of “3, 2, 1, go!” at which point the tester dropped a futsal from the participants waist height so that it hit the floor no more than 50 cm from the participant’s feet (action point 1). The time starts at the moment the futsal hit the floor. The participant was required to control the ball and begin dribbling it to action point 2 where the participant was required to trap the ball. The trap was required to prevent participants from using a kick and chase technique and to ensure the need to keep control. Once the ball was at a complete stop, they resumed dribbling to action point 3 where participants turned 90 degrees right, and on to action point 4 where again the participants turned 90 degrees right. The participant then dribbled to action point 5 where the participants were required to pass the ball against bench A. The participant was able to pass the ball on the line, or at any point beyond it to incorporate an element of decision-making between time and accuracy. Once the ball struck the bench the participant controlled the ball and turned to dribble the ball to action point 6, where they were required to make a pass against bench B. From here they turned and returned with the ball to action point 7, repeating the two passes against benches A and B (action point 8). At the moment the participant touched the ball following their second pass against bench B, the defender stood at action point 9 ran at game speed either towards bench C or bench D as if they were tracking an opposition player towards that location. This decision was pre-determined to ensure a balance across visits for pass directions. The participant again had a time vs accuracy decision to make and choose their preferred quickest route (pass and/or dribble the ball) to get the ball to the bench the defender was not covering (C or D). The performance was measured in seconds and time was stopped when the ball struck the bench, left the court, or was intercepted by the defender (whichever event happened first). Full details on the development of VIFS test are available and free to access in Runswick et al. (Citation2021) and the associated supplementary materials. When using the average of the two best times from three attempts the test can differentiate skill level in experience matched players and has an intraclass correlation of 0.81, small bias between visits of 0.92 seconds, and limits of agreement −4.91 to 6.74 seconds.
Figure 1. Schematic showing the set-up and execution of the vision impaired football skills test (Runswick et al., Citation2022).
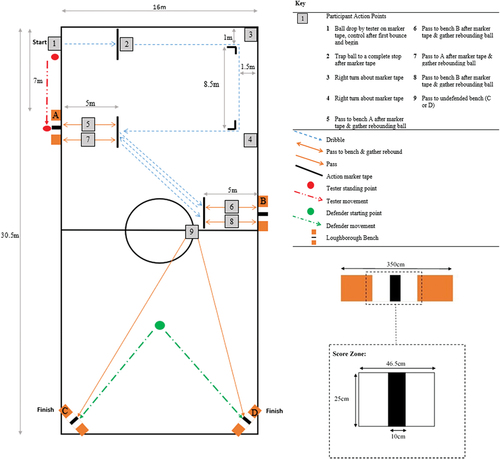
The performance variable is total time to complete the course with time penalties included in the design to maintain the game’s realistic speed and accuracy trade-off, while producing a single time-based performance score. Passing penalties and rewards matched those used in the Loughborough Soccer Passing Test (Ali et al., Citation2007) and were applied to participants’ final time as follows: Striking the black section of a bench was rewarded with a 1 second deduction from the overall time, striking the white section incurred no penalties or rewards, and striking any other section of the bench resulted in 3 seconds being added to the final time. Missing the correct bench with the final required pass resulted in a 5 second penalty, whilst missing any other action point or bench voided the trial. The test is completed three times with two minutes rest between each trial. The average total time (raw time + penalties) of the best two out of three attempts being the final performance variable (Runswick et al., Citation2021).
Anticipation performance test
Full details can be found in the supplementary materials. We developed a screen-based anticipation test that represented a one-versus-one scenario viewed from the defender’s perspective. Participants were required to anticipate the direction of the next dribble of skilled attacker across 35 trials that were occluded 240 ms prior to foot-ball contact. We tested the validity and reliability of this test and how it should be displayed in two experiments that can be found in the supplementary materials. An additional 10 skilled (semi-professional) and 10 less-skilled players took part in the validity testing where the test showed strong construct validity with skilled players significantly outperforming less-skilled. A further 10 skilled players completed reliability testing using three different display methods (projector, high resolution iPad pro, and Apple iMac with 27-inch retina 5k display (Cupertino, CA, USA)) with key gaze behaviour metrics measured using a mobile eye-tracker (Tobii Pro, Tobii, Danderyd, Sweden). Results found optimum within- and between-day reliability for performance scores and gaze strategy when stimuli were displayed using the Apply iMac.
Procedure
The two performance tests and three vision tests were completed eight times (once per simulation condition) over three different visits. Participants were asked not to conduct any high intensity physical activity on testing days and dress and prepare as they normally would for playing. They took part in two conditions without impairment (no goggles and clear lens) and six levels of simulated impairment that impacted VA and CS (1 being the least impairment and 6 being the highest). The order of control, clear, and simulation levels was randomized across participants. At the first visit, participants completed informed consent, and were familiarised with the procedure and completed testing for two levels of simulation. At visits two and three participants completed testing for three further levels of simulation at each.
When completing testing for each level of simulation, participants put on the simulation glasses and completed VA and CS testing. When levels of impairment had been measured, participants completed the anticipation testing. Participants then had 10 minutes to conduct a warmup including sprints and changes of direction as outlined in Runswick et al. (Citation2021). This warm-up also allowed 10 minutes of wearing the simulation glasses before completing technical performance testing. Participants then completed their three attempts at the VIFS with the two minutes of rest between each attempt as stipulated by Runswick et al. (Citation2022). Simulation glasses were not removed or moved at any point during testing. If another level of simulation needed to be completed, participants had five minutes of full rest before putting on the next set of simulations glasses and completing vision testing. Testing took 1.5–2 hours per visit.
Data analysis
Normalised performance
All performance ratings were normalised on a participant level according to their score in the control condition (i.e., control score = 100%). For each visual condition, the normalised time was expressed as a percentage of the score in the control condition. Performance naturally varies from trial to trial. The original development of the VIFS suggests 95% limits of agreement to be approximately five seconds when taking the average of the best two attempts (Runswick et al., Citation2022). Five seconds represents 15% of the average time taken to complete the VIFS test in the control condition by participants in this study, which means a change of 15% can be considered a meaningful change in technical performance (i.e., performance dropping below 85% can be seen as a meaningful decrease). The development of the anticipation tests (see supplementary material) suggests 95% limits of agreement to be approximately 25% when presented on the iMac retina screen, which means a change of 25% can be considered a meaningful change in anticipation performance (i.e., performance dropping below 75% of normalised performance can be seen as a meaningful decrease). This approach is based on studies conducted in VI shooting by Allen et al. (Citation2018) and VI judo by Krabben et al. (Citation2021).
Effects of simulated impairments
Three individual repeated measures ANOVAs were conducted to examine the difference in VA, CSmars and CSapp across simulation conditions. Two more repeated measures ANOVAs were performed to examine the difference in the normalised performance between the simulation levels for technical and anticipation performance. A Bonferroni adjustment was employed when multiple comparisons were made (McLaughlin & Sainani, Citation2014). Partial eta squared (ηp2) was used as a measure of effect size for all analyses. Magnitudes of partial eta squared needed to be interpreted based on the context of the task but can generally be considered as; small = 0.01, medium = 0.06, large = 0.14 (Miles & Shevlin, Citation2001). The alpha level (p) for statistical significance was set at 0.05. Analysis was conducted using JASP version 0.17.3 (JASP Team, Citation2023).
Receiver operator characteristics (ROC) curves
To establish what level of (simulated) vision impairment would reduce performance, we constructed Receiver Operator Characteristics (ROC) curves in Excel for VA and CS and technical and anticipation performance. Due to the volume of zero scores produced by CSmars, only CSapp was used for this analysis. This allowed us to determine how well performance could be classified as either “expected” or “below expected” by defining meaningful change while accounting for the limits of agreement of the VIFS test (Runswick et al., Citation2022) and the anticipation test (Supplement). Ideally, classification ensures both good sensitivity and specificity. A cut-off with good sensitivity will include as many players as possible who are performing worse than would be expected (i.e., assumed to have genuine impairment). A cut-off with good specificity will exclude players who are not performing worse than would be expected (i.e., assumed to have no significant impairment). Therefore, a cut-off is required that balances sensitivity and specificity. Generally, setting the MIC at a more severe degree of impairment will increase the specificity of classification but at the cost of reduced sensitivity, and vice versa. Youden’s J is a measure which expresses the balance between sensitivity and specificity and is calculated as Youden’s J = sensitivity + specificity −1. This statistic was used to select the MIC that optimises the number of correctly classified athletes.
Decision tree analysis
To identify the MIC based on a combination of VA and CS (ROC curves use one at a time) we used a tree-based classification model (“tree” package in R) (Zhang, Citation2016). Due to the volume of zero scores produced by CSmars only CSapp was used for this analysis. This decision tree analysis uses the same approach as Allen et al. (Citation2018) who investigated the MIC in shooting using VA and CS. This method uses recursive binary splitting, where the best split in the performance data is continuously made using criteria for both VA and CS. The best split leads to two nodes that optimally separate “expected” or “below expected” performances. After the first split, the same process was continued until the stopping criterion was met, requiring at least five data points in each node. The decision tree was then pruned by determining the optimal level of complexity of the tree using cross-validation. The tree was built and pruned using the data from each level of simulated impairment as the training data set.
Results
Simulation of vision impairment
shows the six levels of simulation, plus clear and no glasses controls, how they were produced, and the mean levels of VA and CSmars they produced in this study.
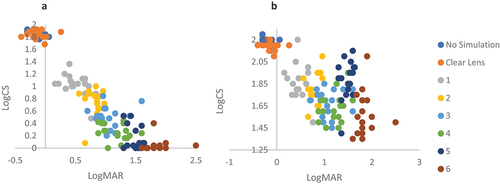
plots the VA vs CS with each level of simulation. Simulation Level 3 represents the closest level to the current MIC for VI football (VA = 1.000 logMAR). There was a significant effect of simulation level on VA (F7, 126 = 335.49, p < 0.001, ηp2 = 0.949). Post hoc comparisons showed a significant difference (all p < 0.001) between all levels of simulation except for the control and clear lens (p = 1.000) and simulation levels 3 and 4 (p = 0.650). There was also a significant effect of simulation level on CSmars (F7, 126 = 522.29, p < 0.001, ηp2 = 0.970). Post hoc comparisons showed a significant difference (all p < 0.001) between all levels of simulation except for the control and clear lens (p = 1.000) and simulation levels 4 and 5 (p = 0.970) and 5 and 6 (p = 0.308). At level 6 logCS was almost at zero for many participants. The CSapp presented scores that differed to the MARS. There was still a significant effect of simulation level on CSapp (F7, 126 = 61.85, p < 0.001, ηp2 = 0.775). Post hoc comparisons showed a significant difference (all p < 0.01) between all levels of simulation except for the control and clear lens (p = 1.000), simulation levels 1 and 2 (p = 1.000), 1 and 5 (p = 1.000), 2 and 5 (p = 0.809), 2 and 3 (p = 0.933), 3 and 4 (p = 0.605), 3 and 6 (p = 0.237), and 4 and 6 (p = 1.000).
Figure 2. The level of impairment experienced across each simulation (levels 1–6, control and clear) for visual acuity (LogMAR) and contrast sensitivity (LogCS). Plots show either MARS chart (a) or app (b) used to measure contrast sensitivity.
Effects of simulated impairment on performance
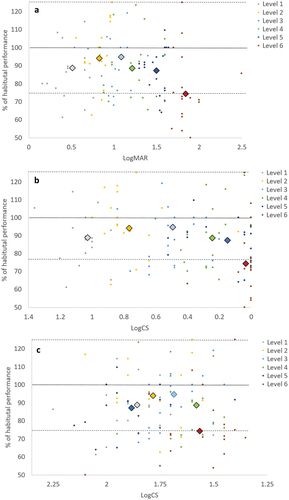
There was a significant effect of simulation level on technical performance (F7, 126 = 8.52, p < 0.001, ηp2 = 0.321). Post hoc comparisons showed no significant differences between the control condition, the clear condition, and simulation levels 1, 2 and 3. Simulation levels 4 (p = 0.008), 5 (p = 0.010) and 6 (p < 0.001) showed a significant decrease in technical performance compared to control. There was also a significant effect of simulation level on anticipation performance (F7, 126 = 8.42, p < 0.001, ηp2 = 0.319). No significant difference between the control, clear condition, and simulation levels 1, 2, 3 and 4 (all p > 0.050). Simulation levels 5 (p = 0.040) and 6 (p < 0.001) showed significant decreases in anticipation performance compared to control. and show individual performance against visual function for all simulation conditions across the technical () and anticipation () performance tests, where 100% (the dotted line) is the expected level of technical and anticipation performance with habitual vision.
Figure 3. Mean (diamond) and individual (small circle) percentages of habitual technical performance at each level of impairment (1–6) for visual acuity (a), contrast sensitivity measured using a MARS chart (b) and contrast sensitivity measured using the app (c). The solid lines show habitual performance, the dotted lines show the boundaries of expected performance.
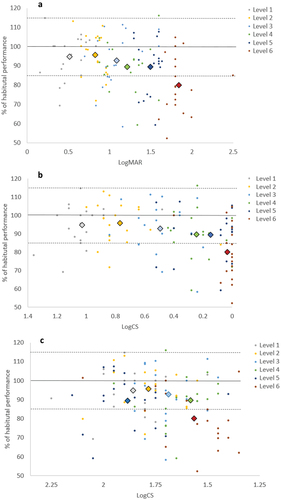
Figure 4. Mean (diamond) and individual (small circle) percentages of habitual anticipation performance at each level of impairment (1–6) for visual acuity (a), contrast sensitivity measured using a MARS chart (b) and contrast sensitivity measured using the app (c). The solid lines show habitual performance, the dotted lines show the boundaries of expected performance.
Receiver operator characteristics curves
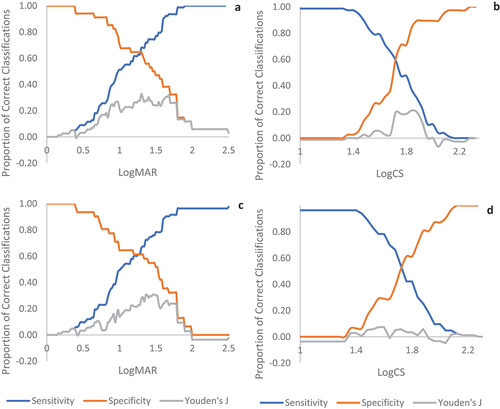
shows the sensitivity and specificity for different possible cut-off points for VA and CS for technical and anticipation performance. For VA the Youden’s J finds that sensitivity and specificity are optimised for technical performance when the cut-off is 1.3 logMAR where it peaks at 0.33 and for anticipation performance at 1.46 logMAR where it peaks at 0.31. CS measured using the app ( panels B and D) displays lower levels of Youden’s J. It suggests that CS is a poor predictor of anticipation performance (panel D) at all levels of simulated impairment and is a less strong predictor of technical performance than VA where it peaks at 0.21 at a LogCS of 1.84.
Figure 5. The sensitivity and specificity for different possible MICs for visual acuity for technical (a) and anticipation performance (c) and contrast sensitivity for technical (b) and anticipation performance (d).
Decision tree analysis
Technical performance
The first binary split in the VIFS decision tree model () showed that players with a VA of less than 0.99 logMAR performed above expected and more than 0.99 logMAR below expected. This is close to the current MIC and to the first peak of the Youden’s J (0.26; sensitivity = 0.5, specificity = 0.76). This point is what is required for establishing the MIC. However, further splits occurred when VA was <1.62 logMAR,), close to the third peak of the Youden’s J (0.29; sensitivity = 0.91, specificity = 0.38). CS scores were relevant to observations where classes would be determined after the VA split at 1.62 logMAR. The decision tree stopping criterion was met with five nodes and this represented the optimum number after cross validation and pruning.
Figure 6. Unconstrained decision tree model for technical performance (a) the full decision tree prior to pruning. (b) the pruned decision tree. In this case, the optimum number of nodes was equal to the original five.
Anticipation performance
The first binary split in the anticipation decision tree model () showed that players with a VA of less than 0.97 logMAR performed above expected and more than 0.97 logMAR below expected. As with technical performance this is close to a small first peak of the Youden’s J (0.19; sensitivity = 0.48, specificity = 0.71). This point is what is required for establishing the MIC. However, further splits occurred when CS was <1.525 logMAR, (Youden’s J = 0.01; sensitivity = 0.83, specificity = 0.18) and at CS < 1.825 close to the peak of the Youden’s J for CS (0.21; sensitivity = 0.37, specificity = 0.84). The decision tree stopping criterion was met with six nodes, however cross validation suggested that the optimum is five ().
Figure 7. Unconstrained decision tree model for anticipation performance. (a) the full decision tree prior to pruning. (b) the pruned decision tree.
Discussion
We aimed to establish the level of impairment to VA and CS that would affect performance in VI football. Participants took part in the VIFS test and an anticipation test under six different levels of simulated impairment. ANOVA results offer initial evidence that a decrease in performance compared to control was not evident until a VA of at least 1.21 logMAR. ROC curves suggested that a MIC with the optimum specificity and sensitivity for VA would be 1.3 logMAR. Decision tree analysis suggested a first split at a VA 0.97 logMAR. Our findings have implications for classification in VI football and support a range of previous findings in cricket (Mann et al., Citation2010), judo (Krabben et al., Citation2022), and shooting (Allen et al., Citation2018) that have suggested sports performance is relatively robust to increases in visual blur.
The methods used to simulate impairments were successfully able to generate gradual decreases in VA. This allowed testing of impairment levels either side of the current MIC of a VA logMAR 1.0. VA and CS are generally highly correlated but the approach to apply two different measures established two quite different sets of values for CS. Both measures were imperfect. The MARS more clearly differentiated the simulation levels than use of the app. However, the MARS resulted in many participants presenting zero CS (unable to see the next figures on the test) but while still being able to complete both technical and anticipation testing, meaning they must have some ability to see contrast. This suggests the absolute zero level of the measure of CS may not be representative of zero visual functioning.
The successful simulation of vision impairment combined with the use of robust technical and anticipation performance measures (Runswick et al., Citation2021) allows for initial insights into the relationship between vision impairment and technical and anticipation performance in VI football. All participants were able to complete (i.e., score above zero) performance tests at all levels of impairment, suggesting the levels of simulation applied here were not severe enough for players to be prevented entirely from completing the task, this is despite measures of contrast reaching zero for most participants. The data in and show that progressively larger proportions of participants performed poorer than normal as the level of impairment increased and also captures the significant variability in performance data for a task as complex as football. While all participants did perform worse than the control condition with simulated impairment at some level, some athletes were still able to perform at their habitual levels even up to a logMAR VA of around 1.8–1.9 (remembering that the existing minimum impairment for B3 is 1.0 logMAR). Simulation level 3 represented an approximate match to the current MIC for VA. Our results showed that performance did not significantly differ from habitual performance (control) until at least simulation level 4 where the average VA was 1.21 logMAR. The receiver operator characteristic curve analysis supported this. Youden’s J found that sensitivity and specificity were optimised for technical performance when the cut-off was 1.3 logMAR and for anticipation performance at 1.46 logMAR. However, it should be noted that this curve was relatively flat and had multiple peaks between logMAR 1.0 and 1.75. Decision tree analysis suggested a first split of a VA of 0.97 logMAR for anticipation performance and 0.99 logMAR for technical performance. These values are very close to the current MIC of VA of 1.00 logMAR. Findings support the opinions of the expert panel in Runswick et al. (Citation2021) who suggested some players currently eligible do not have impairments that affect performance. The panel also agreed that VA was most likely to impact football performance, and that elements of ball control, dribbling, passing, and spatial awareness would be impacted by lower levels of impairment than anticipation, as was shown in the ANOVA and ROC data here.
Findings have several implications for classification in football for athletes with vision impairment. The MIC for a Para sport should be set at the lowest level of vision impairment that impacts performance in the unadapted form of that sport (Tweedy & Vanlandewijck, Citation2011). This suggests that, despite a more severe level of impairment being required before anticipation performance was affected, if accounting for technical performance only, the MIC could still be set at a more severe level of impairment than is currently used. CS measured using the MARS or app method was not a strong predictor of performance in this sport and, based on the evidence presented here that players can perform the test when contrast measures show a zero, should not be included as a criterion for establishing the MIC during para-athlete classification. However, decision tree analysis suggests that CS may become a relevant measure when developing classes after the MIC is reached using VA.
Findings on CS differ to that for other self-paced sports such as shooting where CS has been found to influence performance relevant to the MIC (Allen et al., Citation2018). However, our findings are almost identical to those found in judo (Krabben et al., Citation2021) where a VA of 1.3 logMAR was suggested as an appropriate MIC, and CS seemed to be a poorer predictor of grip fighting in the Para sport. While there is a need for sport specificity in classification, this suggests that evidence from sports where athletes with vision impairments must compete directly against an opponent (e.g., VI football and para judo) may have common underpinning needs for visual function. These may differ from self-paced Para sports such as Para shooting.
The MIC should ensure that all footballers are able to compete if their impairment genuinely has a negative impact on performance. Conversely, the MIC should minimise the chance that a player would qualify to compete if they do not have an impairment that impacts their performance. However, our findings here support the previous work in other sports such as shooting (Allen et al., Citation2018) and judo (Krabben et al., Citation2022) that have shown this is unlikely to be completely possible. For some participants, performance was below what was expected at a VA much less severe than logMAR 1.3. In contrast, other participants were able to maintain their performance despite far more severe levels of impairment. The suggested MIC between 0.99 from decision tree analysis and 1.3 logMAR from Youden’s J provides a mathematically optimal balance between the sensitivity and specificity of classification of technical performance, for this sample of participants, and under the assumption that false positives and false negatives are weighted equally. If a sport considers sensitivity or specificity to be more or less important, then they may wish to move the MIC to a more or less severe level than what was evidenced in this study. For example, in Runswick et al. (Citation2021) Delphi study, qualitative comments outlined issues with numbers of players for participation in VI football. Moving the MIC from a VA of logMAR 1.0 to 1.3 would likely reduce the number of players who play the Para sport.
The results presented in this study offer a number of directions for future research that can continue to build a sport-specific evidence base for classification in VI football. First, this study simulated a broad range of vision impairment that stretched either side of the current MIC. As suggested by Krabben et al. (Citation2022), having identified the likely level of VA that impacts performance in football, this now places us in a better position to repeat the approach but using a more fine-grained approach that can focus on testing finer increments of impairment over a smaller range around that level of impairment identified by the data presented here. Second, we tested the effects of VA and CS due to their ease of simulation, ability to measure using standardised methods, and VA’s current use in classification. However, the expert panel in Runswick et al. (Citation2021) suggested that visual field, dynamic visual acuity, motion perception, and light sensitivity may also be relevant measures of visual function. Some of these measures of visual function strongly correlate with VA and CS or do not have established methods for measurement. However, visual field is currently included in classification procedures and needs to be addressed.
While there is no standardised method to simulate visual field, previous work in less dynamic tasks such as driving simulation (Lee et al., Citation2016; Udagawa et al., Citation2018), has applied this method. In sports this has been successfully executed in skiing (Stalin & Dalton, Citation2021). While out of the scope of this paper, future work should focus on developing evidence for the effects of reductions in visual field on performance through methods such as simulations, virtual reality, and gaze contingent paradigms. The VIFS and anticipation tests included all the elements of football performance that Runswick et al. (Citation2022) panel agreed were important for performance, except for set plays. However, other elements of play, such as shooting towards goal, came close to agreement in Runswick et al. (Citation2022) Delphi study, and consequently warrant further investigation. Simulation studies focusing on free kicks or penalty kicks would allow for the investigation of both missing elements. The anticipation tests employed here were tested for reliability on performance measures and presented low levels of bias but did show wide limits of agreement (see Supplement). These levels of variability are accounted for in ROC analysis but do mean large reductions in performance are needed before we can consider this to be meaningful.
The use of “simulation studies” that systematically impair the vision of able-sighted athletes allows individuals to be compared across repeated measures, controls for the level to which athletes have adjusted to their impairments and is a suggested and accepted method of developing research evidence in this field (Krabben et al., Citation2022; Mann & Ravensbergen, Citation2018). However, it must be acknowledged that these methods do not include the population for which recommendations are intended for, and athletes with vision impairments are likely to have large variability in the nature of their impairments and time they have been acquired. The current study was designed to provide evidence for new MIC for men’s and women’s VI football. However, while under the current structure, women then compete under the same adaptations with eyeshade, it does not provide evidence for whether male athletes who meet these criteria can compete fairly against each other in blind or partially sighted football or how classes should be distributed. A significant body of work that incorporates data from existing players is required to continue to develop evidence for the best class structure for athletes who meet this MIC. This is particularly important in a Para sport such as VI football where eligible athletes currently play different forms of the game.
In conclusion, this study adds to research evidence from other Para sports to show that technical performance in futsal was resilient to visual blur. Specifically for classification in vision impaired football, VA offers a better predictor of performance than CS and the minimum impairment criteria may need to be made more severe.
CRediT author contributions: OR
Conceptualisation, Methodology, Formal Analysis, Investigation, Data Curation, Writing – Original Draft, Writing – Review & Editing, Visualization, Supervision. Funding Acquisition AR: Project Administration, Investigation, Data Curation, Resources, Writing – Review & Editing. PA and DM: Conceptualisation, Methodology, Writing – Review & Editing, Supervision, Funding Acquisition. BS, PB, CP, ND: Methodology, Investigation, Resources, Writing – Review & Editing. RB: Formal Analysis, Visualisation, Writing – Review & Editing.
Supplemental Material
Download MS Word (3.2 MB)Supplemental Material
Download MS Word (3.2 MB)Disclosure statement
This project has been carried out with the support of a Classification Research Grant from the International Paralympic Committee. OR, DM, and PA receive funding from the International Paralympic Committee and International Blind Sports Federation.
Data availability statement
Data associated with this submission is available at: https://osf.io/7udzq/?view_only=72cd96a4b30f4f05b02b9d2f89f2053f
Supplementary material
Supplemental data for this article can be accessed online https://doi.org/10.1080/02640414.2023.2273093
Additional information
Funding
References
- Ali, A., Williams, C., Hulse, M., Strudwick, A., Reddin, J., Howarth, L., Eldred, J., Hirst, M., & McGregor, S. (2007). Reliability and validity of two tests of soccer skill. Journal of Sports Sciences, 25(13), 1461–1470. https://doi.org/10.1080/02640410601150470
- Allen, P. M., Dolan, R., Croxall, H., Ravensbergen, R. H., Brooks, A., Zenk, F., & Mann, D. L. (2020). Evidence-based classification in track athletics for athletes with a vision impairment: A Delphi study. Optometry and Vision Science, 97(11), 984–994. https://doi.org/10.1097/OPX.0000000000001600
- Allen, P. M., Latham, K., Mann, D. L., Ravensbergen, R. H. J. C., & Myint, J. (2016). The level of vision necessary for competitive performance in rifle shooting: Setting the standards for paralympic shooting with vision impairment. Frontiers in Psychology, 7. https://doi.org/10.3389/fpsyg.2016.01731
- Allen, P. M., Latham, K., Ravensbergen, R. H. J. C., Myint, J., & Mann, D. L. (2019). Rifle shooting for athletes with vision impairment: Does one class fit all? Frontiers in Psychology, 10. https://doi.org/10.3389/fpsyg.2019.01727
- Allen, P. M., Mann, D. L., van der Linde, I., & Beukes, E. W. (2021). Perspectives of a new sport-specific para shooting classification system for athletes with vision impairment. Journal of Sports Sciences, 39(S1), 198–208. https://doi.org/10.1080/02640414.2020.1851923
- Allen, P. M., Ravensbergen, R. H. J. C., Latham, K., Rose, A., Myint, J., & Mann, D. L. (2018). Contrast sensitivity is a significant predictor of performance in rifle shooting for athletes with vision impairment. Frontiers in Psychology, 9. https://doi.org/10.3389/fpsyg.2018.00950
- Bailey, I. L., Jackson, A. J., Minto, H., Greer, R. B., & Chu, M. A. (2012). The Berkeley rudimentary vision test. Optometry and Vision Science, 89(9), 1257–1264. https://doi.org/10.1097/OPX.0b013e318264e85a
- Beckman, E. M., Newcombe, P., Vanlandewijck, Y., Connick, M. J., & Tweedy, S. M. (2014). Novel strength test battery to permit evidence-based paralympic classification. Medicine (United States), 93(4), 93(4), e31. https://doi.org/10.1097/MD.0000000000000031
- British Standards Institution. (2009). BS EN ISO 8596:2009. Ophthalmic optics. Visual acuity testing. Standard optotype and its presentation.
- Campitelli, G. (2019). Retiring statistical significance from psychology and expertise research. Journal of Expertise, 2(4), 217–223.
- Chun, R., Massof, R. W., Bradley, C., Allen, P., Ravensbergen, R., & Mann, D. (2019). Effects of visual acuity loss on running performance among visually impaired Paralympic athletes. Investigative Ophthalmology & Visual Science, 60(9), 1043–1043.
- Farhani, F., Rajabi, H., Negaresh, R., Ali, A., Amani Shalamzari, S., & Baker, J. S. (2019). Reliability and validity of a novel futsal special performance test designed to measure skills and anaerobic performance. International Journal of Sports Physiology and Performance, 14(8), 1096–1102. https://doi.org/10.1123/ijspp.2018-0850
- Fortin-Guichard, D., Ravensbergen, H. J. C., Krabben, K., Allen, P. M., & Mann, D. L. (2022). The relationship between visual function and performance in para swimming. Sports Medicine-Open, 8(1), 1–18. https://doi.org/10.1186/s40798-022-00412-3
- Goodman-Deane, J., Waller, S., Collins, A. C., & Clarkson, J. (2013). Simulating vision loss: What levels of impairment are actually represented? In Contemporary Ergonomics and Human Factors 2013: Proceedings of the international conference on Ergonomics & Human Factors 2013, Cambridge, UK, 15-18 April 2013 (p. 347). CRC Press.
- Harris, D., Arthur, T., Broadbent, D., Wilson, M., Vine, S. J., & Runswick, O. (2022). An active inference account of skilled anticipation in sport. Sports Medicine, 52(9), 2023–2038. https://doi.org/10.1007/s40279-022-01689-w
- IBSA Football.(2023, August 19). Rules and Downloads. https://blindfootball.sport/about-football/rules-and-downloads/
- International Paralympic Committee. (2015). IPC Athlete Classification Code: Rules, Policies and Procedures for Athlete Classification. https://www.paralympic.org/sites/default/files/document/150813212311788_Classification+Code_1.pdf
- International Paralympic Committee. (2016). International Standard for Athlete Evaluation. https://www.paralympic.org/sites/default/files/document/161004135918977_2016_10_04_International_Standard_for_Athlete_Evaluation.pdf
- JASP Team. (2023). JASP (version 0.17.3) [Computer software].
- Krabben, K., Mann, D., Lojanica, M., Mueller, D., Dominici, N., van der Kamp, J., & Savelsbergh, G. (2022). How wide should you view to fight? Establishing the size of the visual field necessary for grip fighting in judo. Journal of Sports Sciences, 40(2), 236–247. https://doi.org/10.1080/02640414.2021.1987721
- Krabben, K., Mann, D. L., van Helden, A., Kalisvaart, Y., Fortin-Guichard, D., van der Kamp, J., & Savelsbergh, G. J. (2021). Getting a grip on the resilience to blur: The impact of simulated vision loss on a visually guided combat sports interaction. Psychology of Sport and Exercise, 55, 101941. https://doi.org/10.1016/j.psychsport.2021.101941
- Krabben, K. J., Ravensbergen, R. H. J. C., Nakamoto, H., & Mann, D. L. (2019). The development of evidence-based classification of vision impairment in judo: A Delphi study. Frontiers in Psychology, 10, 98. https://doi.org/10.3389/fpsyg.2019.00098
- Krabben, K. J., van der Kamp, J., & Mann, D. L. (2018). Fight without sight: The contribution of vision to judo performance. Psychology of Sport and Exercise, 37, 157–163. https://doi.org/10.1016/j.psychsport.2017.08.004
- Lakens, D. (2022). Sample size justification. Collabra: Psychology, 8(1), 33267. https://doi.org/10.1525/collabra.33267
- Lee, J., Itoh, M., & Inagaki, T. (2016, September). Effectiveness of driver compensation to avoid vehicle collision under visual field contraction. Proceedings of the Human Factors and Ergonomics Society Annual Meeting, 60(1), 1911–1915. https://doi.org/10.1177/1541931213601436
- Mann, D. L., Abernethy, B., & Farrow, D. (2010). The resilience of natural interceptive actions to refractive blur. Human Movement Science, 29(3), 386–400. https://doi.org/10.1016/j.humov.2010.02.007
- Mann, D. L., & Ravensbergen, H. J. C. (2018). International Paralympic Committee (IPC) and International blind sports Federation (IBSA) joint position stand on the sport-specific classification of athletes with vision impairment. Sports Medicine, 48(9), 2011–2023. https://doi.org/10.1007/s40279-018-0949-6
- Mann, D. L., & Savelsbergh, G. J. P. (2015). Issues in the measurement of anticipation. In J. Baker & D. Farrow (Eds.), Routledge Handbook of sport expertise (pp. 166–175). Routledge .
- Martin, A. M., Ryu, D., Jackson, R. C., & Mann, D. L. (2023). Expert views on evidence-based classification for goalball: A Delphi study. Adapted Physical Activity Quarterly, 40(2), 257–279. https://doi.org/10.1123/apaq.2022-0051
- McLaughlin, M. J., & Sainani, K. L. (2014). Bonferroni, holm, and hochberg corrections: Fun names, serious changes to P values. PM&R, 6(6), 544–546. https://doi.org/10.1016/j.pmrj.2014.04.006
- Miles, J., & Shevlin, M. (2001). Applying regression and correlation: A guide for students and researchers. Sage.
- Myint, J., Latham, K., Mann, D., Gomersall, P., Wilkins, A. J., & Allen, P. M. (2016). The relationship between visual function and performance in rifle shooting for athletes with vision impairment. BMJ Open Sport and Exercise Medicine, 2(1), e000080. https://doi.org/10.1136/bmjsem-2015-000080
- Pastor, D., Campayo-Piernas, M., Pastor, J. T., & Reina, R. (2019). A mathematical model for decision-making in the classification of para-footballers with different severity of coordination impairments. Journal of Sports Sciences, 37(12), 1403–1410. https://doi.org/10.1080/02640414.2018.1560617
- Ravensbergen, H. J. C., Genee, A. D., & Mann, D. L. (2018). Expert consensus to guide the classification of Paralympic Swimmers with vision impairment: A Delphi study. Frontiers in Psychology, 9, 1756. https://doi.org/10.3389/fpsyg.2018.01756
- Ravensbergen, H. J. C., Mann, D. L., & Kamper, S. J. (2016). Expert consensus statement to guide the evidence-based classification of Paralympic athletes with vision impairment: A Delphi study. British Journal of Sports Medicine, 50(7), 386–391. https://doi.org/10.1136/bjsports-2015-095434
- Reilly, T., & Gilbourne, D. (2003). Science and football: A review of applied research in the football codes. Journal of Sports Sciences, 21(9), 693–705. https://doi.org/10.1080/0264041031000102105
- Reina, R., Iturricastillo, A., Castillo, D., Urbán, T., & Yanci, J. (2020). Activity limitation and match load in para‐footballers with cerebral palsy: An approach for evidence‐based classification. Scandinavian Journal of Medicine & Science in Sports, 30(3), 496–504. https://doi.org/10.1111/sms.13583
- Roca, A., Ford, P. R., McRobert, A. P., & Mark Williams, A. (2011). Identifying the processes underpinning anticipation and decision-making in a dynamic time-constrained task. Cognitive Processing, 12(3), 301–310. https://doi.org/10.1007/s10339-011-0392-1
- Runswick, O. R., Green, R., & North, J. S. (2020). The effects of skill-level and playing-position on the anticipation of ball-bounce in rugby union. Human Movement Science, 69, 102544. https://doi.org/10.1016/j.humov.2019.102544
- Runswick, O. R., Ravensbergen, R. H., Allen, P. M., & Mann, D. L. (2021). Expert opinion on classification for footballers with vision impairment: Towards evidence-based minimum impairment criteria. Journal of Sports Sciences, 39(sup1), 30–39. https://doi.org/10.1080/02640414.2021.1881301
- Runswick, O. R., Rawlinson, A., Datson, N., & Allen, P. M. (2022). A valid and reliable test of technical skill in vision impaired football. Science and Medicine in Football, 6(1), 89–97. https://doi.org/10.1080/24733938.2021.1885725
- Runswick, O. R., Roca, A., Williams, A. M., McRobert, A., & North, J. S. (2019). Why do bad balls get wickets? The role of congruent and incongruent information in anticipation. Journal of Sports Sciences, 37(5), 537–543. https://doi.org/10.1080/02640414.2018.1514165
- Runswick, O. R., Roca, A., Williams, A. M., & North, J. S. (2020). Model of information use during anticipation in striking sports (MIDASS). Journal of Expertise, 4(3), 197–211.
- Stalin, A., Creese, M., & Dalton, K. N. (2021). Do impairments in visual functions affect skiing performance? Frontiers in Neuroscience, 15, 648648. https://doi.org/10.3389/fnins.2021.648648
- Stalin, A., & Dalton, K. (2021). Exploration of the minimum visual disability criteria for para nordic and para alpine skiing using simulated vision impairments. Journal of Sports Sciences, 39(sup1), 167–187. https://doi.org/10.1080/02640414.2021.1903685
- Stalin, A., & Dalton, K. (2023). Classification in para skiing: Do better performing skiers have better visual functions? Frontiers in Sports and Active Living, 5, 1046318. https://doi.org/10.3389/fspor.2023.1046318
- Tweedy, S. M., Beckman, E. M., & Connick, M. J. (2014). Paralympic classification: Conceptual basis, current methods, and research update. PM and R, 6(S8). https://doi.org/10.1016/j.pmrj.2014.04.013
- Tweedy, S. M., & Vanlandewijck, Y. C. (2011). International Paralympic Committee position stand-background and scientific principles of classification in Paralympic sport. British Journal of Sports Medicine, 45(4), 259–269. https://doi.org/10.1136/bjsm.2009.065060
- Udagawa, S, Ohkubo, S, Iwase, A, Susuki, Y, Kunimatsu-Sanuki, S, Fukuchi, T, Matsumoto, C, Ohno, Y, Ono, H, Sugiyama, K, & Araie, M. (2018). The effect of concentric constriction of the visual field to 10 and 15 degrees on simulated motor vehicle accidents. PLoS One, 13(3), e0193767. https://doi.org/10.1371/journal.pone.0193767
- Vanlandewijck, Y. C., Verellen, J., Beckman, E., Connick, M., & Tweedy, S. M. (2011). Trunk strength effect on track wheelchair start: Implications for classification. Medicine and Science in Sports and Exercise, 43(12), 2344–2351. https://doi.org/10.1249/MSS.0b013e318223af14
- World Health Organisation. (2004). International statistical classification of disease and related Health problems. https://www.who.int/standards/classifications/classification-of-diseases
- Zhang, Z. (2016). Variable selection with stepwise and best subset approaches. Annals of Translational Medicine, 4(7), 136. https://doi.org/10.21037/atm.2016.03.35