
ABSTRACT
Purpose
The short-term scaling exponent alpha1 of detrended fluctuation analysis (DFA-a1) of heart rate variability (HRV) has shown potential to delineate the first ventilatory threshold (VT1). The aims of this study were to investigate the accuracy of this method for VT1 determination in runners using a consumer grade chest belt and to explore the effects of acute fatigue.
Methods
We compared oxygen uptake (V̇O2) and heart rate (HR) at gas exchange VT1 to V̇O2 and HR at a DFA-a1 value of 0.75. Gas exchange and HRV data were obtained from 14 individuals during a treadmill run involving two incremental ramps. Agreement was assessed using Bland-Altman analysis and linear regression.
Results
Bland-Altman analysis between gas exchange and HRV V̇O2 and HR at VT1 during the first ramp showed a mean (95% limits of agreement) bias of −0.5 (−6.8 to 5.8) ml∙kg−1∙min−1, and −0.9 (−12.2 to 10.5) beats∙min−1, with R2 of 0.83 and 0.56, respectively. During the second ramp, the differences were −7.3 (−18.1 to 3.5) ml∙kg−1∙min−1 and −12.3 (−30.4 to 5.9) beats∙min−1, with R2 of 0.62 and 0.43, respectively.
Conclusion
A chest-belt derived DFA-a1 of 0.75 is closely related to gas exchange VT1, with the variability in accuracy at an individual level being similar to gas exchange methods. This suggests this to be a useful method for exercise intensity demarcation. The altered relationship during the second ramp indicates that DFA-a1 is only able to accurately demarcate exercise intensity thresholds in a non-fatigued state, but also opens opportunities for fatigue-based training prescription.
Highlights
The first ventilatory threshold determined with a nonlinear method (DFA-a1) to analyse heart rate variability derived from a chest-belt shows close agreement to the gas exchange first ventilatory threshold, with the variability in accuracy at an individual level being similar to gas exchange methods. This suggests this to be a useful method for exercise intensity demarcation.
The altered relationship during fatigue indicates that DFA-a1 is only able to accurately demarcate exercise intensity thresholds in a non-fatigued state, but this also opens opportunities for fatigue-based training prescription.
1. Introduction
Accurate determination of training intensity is important to optimise performance, minimise maladaptive effects related to overtraining, and prevent dropout in both athletic and clinical populations (Anselmi et al., Citation2021; Jamnick et al., Citation2020; Pallares et al., Citation2016). To this purpose, training intensity is often classified into three training zones (Gronwald et al., Citation2020; Haugen et al., Citation2022; Seiler, Citation2010) based on physiological “thresholds”. In this 3-zone model, the upper limit of the lowest intensity zone (zone 1) is often delineated by the first ventilatory threshold (VT1), which is also referred to as the aerobic threshold or gas exchange threshold. The highest intensity zone (zone 3) encompasses exercise intensities above the second ventilatory threshold (VT2, upper limit of zone 2, respiratory compensation point) and is also referred to as anaerobic threshold. Identification of these physiological thresholds is important as training higher than the desired target for prolonged periods could lead to undesirable effects such as glycogen depletion (Beneke et al., Citation2011), prolonged cardiac parasympathetic recovery (Stanley et al., Citation2013), and/or higher overall central and muscular fatigue (Brownstein et al., Citation2022), all of which may adversely affect recovery and (subsequent) performance. In-field assessment and real-time feedback on training intensity could therefore be beneficial for individuals seeking to optimise performance and minimise risk of overtraining. Moreover, monitoring the changes in thresholds over time can also provide objective information about the effectiveness of training programs.
While respiratory gas analysis is considered the gold standard method to obtain ventilatory thresholds (VTs) (Rogers et al., Citation2021), this method is expensive, requires special equipment, trained operators, and is limited to specialised centres, making it difficult to regularly assess VTs. In contrast, heart rate (HR) variability (HRV) thresholds obtained using wearable technology such as a chest belt device may be more feasible as an indicator of training intensity zone demarcation (Gronwald et al., Citation2020). However, most existing HRV-based methods require a maximal incremental exercise test to demonstrate the HRV index reaching a nadir value corresponding to VT1 (Cottin et al., Citation2007). This therefore renders these methods unsuitable for wide use as some individuals (e.g., with cardiovascular disease (Levett et al., Citation2018)) cannot always perform maximal exercise tests, while frequent maximal exercise tests are also not desired among athletes due to their influence on the intensity distribution in their daily training schedule. In addition, some HRV-methods do not show consistent breakpoints among individuals (Cottin et al., Citation2007), or may be already suppressed at low exercise intensities (Blasco-Lafarga et al., Citation2017), thereby not allowing zone demarcation across the full range of exercise intensities. Recently, a non-linear HRV index based on fractal correlation properties, termed alpha1 (short-term scaling exponent) of detrended fluctuation analysis (DFA-a1), has been proposed as a simple, easily accessed, and valid method to define VT-associated breakpoints based on observations of a continuous drop with increasing exercise intensity (Gronwald et al., Citation2020; Rogers et al., Citation2021). This index represents the correlation properties of cardiac beat-to-beat intervals and initiates from strongly correlated patterns (value at around 1.5) at low-intensity exercise, transitions to less strongly correlated fractal patterns (value at around 1.0) at moderate exercise intensities, and continues to drop to uncorrelated and anticorrelated patterns at the highest intensities (values <0.5) (Gronwald et al., Citation2020). Prior studies have shown that a DFA-a1 value of 0.75 corresponds closely to the VT1 (termed as heart rate variability threshold, HRVT), while a DFA-a1 of 0.5 corresponds closely to the VT2 (Gronwald et al., Citation2020; Mateo-March et al., Citation2023; Naranjo-Orellana et al., Citation2021; Rogers et al., Citation2021, Citation2021, Citation2021a, Citation2022; Schaffarczyk et al., Citation2023), suggesting this method may be a useful tool to determine training zones and thus guide training intensity. Importantly, this method does not require a maximal exercise test, and data can be derived from a belt around the chest, which therefore allows in-field use and also opens opportunities to provide real-time feedback on exercise intensity (Rogers & Gronwald, Citation2022). Indeed, a former Olympic triathlete reported that real-time feedback on the training intensity as determined using DFA-a1 could help him train at an appropriate intensity (Gronwald et al., Citation2021).
Although this method is promising, only few studies have assessed the accuracy of VTs derived from DFA-a1 behaviour for intensity distribution. Moreover, cycling was used as the exercise type in four studies (Mateo-March et al., Citation2023; Rogers et al., Citation2021, Citation2022; Schaffarczyk et al., Citation2023). During running, the effects of footstrike impact and missed beats due to partial chest belt contact may alter the electrocardiogram (ECG) waveform and R-R interval period (Astrom et al., Citation2003; Rogers & Gronwald, Citation2022; Rogers et al., Citation2021b), thereby affecting the accuracy of this method as compared to cycling. While one study has investigated the accuracy of DFA-a1 derived thresholds during running, HRV was measured using a research-grade ECG. Chest belt-derived HRV may be less precise as compared to an ECG (Rogers & Gronwald, Citation2022; Rogers et al., Citation2021b, Citation2022) and thereby also affect the accuracy of this approach, with consequences for in-field use.
In addition to its usage as a means of assessing exercise intensity, DFA-a1 has also been shown to have utility as a marker of fatigue (Gronwald et al., Citation2019, Citation2021; Rogers & Gronwald, Citation2022; Rogers et al., Citation2021). In this context, the usual relationship between the fractal correlation properties of HR time series and exercise intensity is shifted, with less correlated patterns (lower DFA-a1 values) occurring at a given exercise intensity. While this makes DFA-a1 less suitable to demarcate training zones and hence determine relative training intensity during fatigue conditions, the change in the DFA-a1 to oxygen uptake (VO2)/power/speed ratio can be viewed as a measure of systemic fatigue (as reflected by changes in autonomic balance), providing opportunities for training guidance. For example, a relatively low DFAa-1 value during a standardised warm-up (indicating autonomic fatigue) prior to a planned interval session may be used to modify the training intensity of the session (Schaffarczyk et al., Citation2022; Van Hooren et al., Citation2023). Further, the change in the DFA-a1 to the VO2/power/speed ratio during exercise could help assess “durability”, previously defined as “the time of onset and magnitude of deterioration in physiological-profiling characteristics over time during prolonged exercise” (Maunder et al., Citation2021). In support of these concepts, a previous study showed that the DFA-a1 value was significantly lower after a 6-h simulated ultramarathon when running at a speed close to VT1 when compared to the pre-ultramarathon value (Rogers et al., Citation2021). Similarly, during a marathon race, DFA-a1 decreased from 0.54 to 0.37 despite significant increases in km split time, with ~ 80% of the race being performed with a DFA-a1 value < 0.5 (Gronwald et al., Citation2021). DFA-a1 behaviour has however not been explored after a relatively brief, but high-intensity interval (i.e., intensity above VT2). This modality may induce a different magnitude of fatigue compared to a marathon and therefore differentially affect DFA-a1 behaviour. It is also unknown whether the relationship between DFA-a1 and VTs is still present after an acute bout of intense exercise. Hence, having a group of participants perform a second incremental exercise ramp shortly after an initial similar ramp to failure could be helpful in exploring shifts in DFA-a1 patterns indicative of autonomic fatigue.
Therefore, the aim of the present study was twofold: 1) to validate the HRVT concept by assessing the VT1 to DFA-a1 agreement in healthy males and females during non-fatigued running using a consumer chest belt device; 2) to explore whether the initial HRVT relationship was altered by acute fatigue as induced by a preceding incremental exercise ramp to failure.
2. Methods
2.1. Experimental approach
This cross-over study involved two experimental sessions separated by approximately one week and was part of a larger project that aimed to investigate the effects of verbal encouragement on the achieved peak VO2 (VO2peak) during exercise (Van Hooren et al., Citation2023). During each session, each participant completed two incremental exercise tests while HRV and respiratory gas exchange data were simultaneously collected. Participants were instructed to avoid strenuous activity for 36 h, alcohol for 24 h, caffeine for 6 h, and a heavy meal 2 h before the session. The two sessions were performed at approximately the same time of the day for each participant. When entering the lab, anthropometric measurements were taken using standardised procedures and the participants completed a questionnaire about their weekly training volume, running experience, and seasonal best times. The study was approved by the local ethics committee (reference FHML-REC/2021/078), and all participants were informed about the study’s context, voluntary nature, procedures, benefits and potential risks, and signed an informed consent form prior to the measurements.
2.2. Participants and sample size determination
Twenty-nine participants (24 males, 5 females; mean ± SD age 24.7 ± 5.6 years; body mass 75.1 ± 11.2 kg; body height 178.1 ± 7.9 cm), that were free of any moderate (for previous 3 months) or minor (for previous 1 month) musculoskeletal injuries, were not taking any medication that could influence running performance, were aged 18–45 years, comfortable with treadmill running, and had a body mass index (BMI) <30 kg/m2 volunteered to participate in this study. A physical activity readiness questionnaire (PAR-Q), was filled out by the participants to check contraindications for maximal exercise testing. Mean ± SD weekly training time was 216 ± 382 min (range 0–440 min), and self-rated training experience was 42% novice runners and 58% experienced runners. The sample size was based on the primary project that aimed to investigate the effects of verbal encouragement on VO2peak (Van Hooren et al., Citation2023).
2.3. Exercise protocol
Participants reported twice to the lab for exercise testing to run with or without verbal encouragement as part of a the larger study project (Van Hooren et al., Citation2023). In the encouragement condition of this study, the frequency and volume of encouragement increased incrementally as the respiratory exchange ratio increased, with encouragement being provided only once every 60 s with RER values < 1.05. As we anticipated this low frequency and volume (~50 dB) to have minimal influence on HR, or HRV, we used data from either the test with or without encouragement depending on which test exhibited the best data quality (lowest HRV artefact). During each test, two incremental exercise protocols were performed on a treadmill (Technogym, Excite 700, Cesena, Italy) to elicit a maximal effort, one without pre-test fatigue (ramp 1) and another near maximal effort with pre-test fatigue (ramp 2). The first incremental protocol started with 5 minutes of running at 7–9 km∙h−1 depending on whether the HR was < 35–45% of the HR reserve (calculated by subtracting the resting HR from the estimated maximum HR [using the Tanaka equation (Tanaka et al., Citation2001)], multiplying the result with 0.4 and then adding this to the resting HR). The ramp protocol consisted of increments of 0.5 km∙h−1 every 30 sec until a speed of 20 km∙h−1 was reached. Thereafter, treadmill incline was increased by 1 degree every 30 seconds. The first ramp ended when the participant reached volitional exhaustion (i.e., signalled that he/she could not continue the test). The participant then rested for 5 minutes, of which the first 2 min were passive rest (standing), and the other 3 min involved slow walking on the treadmill. After the 5-min rest period, a second incremental protocol started at the same speed as the first ramp for 5 min, followed by a similar ramp protocol to assess if residual fatigue from the first ramp altered the agreement between respiratory gas analysis-based VT1 and DFA-a1. The second ramp test ended when the participant attained a respiratory exchange ratio (RER) ≥0.99 and the DFA a1 value was ≤ 0.50 as we were only interested in validating a DFA-a1 of 0.75 and thus did not require a second ramp until exhaustion. A fan was placed 1 m in front of the treadmill to maintain a cool body temperature and mimic air flow to maximise transfer to outdoor conditions (Gronwald et al., Citation2020).
2.4. Equipment
Participants wore a face mark (Hans Rudolph Inc, Shawnee, KS, USA) over the nose and mouth without detectable leakage to collect respiratory gasses. The mask was connected to a T-piece that was placed in a free airstream (200 L∙min−1). Respiratory gases were measured continuously and computed at 5-s intervals using an indirect calorimeter (Omnical v6, Maastricht Instruments, Maastricht, The Netherlands). The system was calibrated automatically every 15–30 min using room air and a gas mixture of known composition and has been shown to have acceptable accuracy with an overall absolute error of ~ 5.5% (Van Hooren et al., Citation2023).
HR and HRV were recorded using a chest belt (Polar H10, Polar Electro Oy, Kempele, Finland) with a sampling rate of 1000 Hz that was tightly secured by the researchers. RR-interval data was sent to an open-source mobile application (FatMaxxer, https://github.com/IanPeake/FatMaxxer) via Bluetooth where it was monitored in real-time and saved for further analyses. RR recordings and ECG tracings (automatically taken during detected artefact) of the incremental test were visually inspected to ensure proper quality, by checking for missed beat artefact, and/or noise and arrhythmia during each measurement.
2.5. Data processing
Gold-standard respiratory gas exchange data was imported into Microsoft Excel 365 for analysis. For the determination of VT1, we used the excess carbon dioxide (CO2) method () (Gaskill et al., Citation2001) as previous research identified this method as producing optimal quality for gas exchange VT1 determination (Rogers et al., Citation2021). Three evaluators (BR, BM, BB) independently evaluated the graphs for each participant’s data prior to the HRV analysis to prevent bias in the gas exchange thresholds. The threshold values were compared and differences were discussed until consensus. VO2 and HR at the VT1 were defined as the mean value centred at a 2-min time span (60 s pre and post the time of VT1; ).
Figure 1. Exemplary course of the excess CO2 and DFA-a1 data during the double ramp of one 23-year-old female participant (VO2peak of 49 ml∙kg−1∙min−1). The method of determining VT1 by excess CO2 (blue dots) and HRVT at DFA-a1 value of 0.75 is shown. DFA-a1 (red dots) is displayed over time with areas of linear regression in grey dots. Abbreviations: CO2, carbon dioxide; DFA-a1, alpha1 of detrended fluctuation analysis; HRVT, heart rate variability threshold; VT1, first ventilatory threshold.
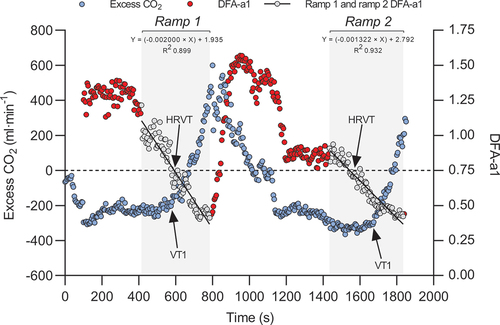
RR data were exported as a text file for analysis in Kubios HRV Premium Software Version 3.5. Preprocess settings were at the default values and RR detrending method was at “Smoothness priors” (Lambda = 500). RR-interval series were corrected by the Kubios “automatic threshold”. DFA-a1 window width was defined to 4 ≤ n ≤ 16 beats. Before analysis, all tachograms were inspected to distinguish and correct artefacts. To minimise DFA-a1 bias, the acceptable limit of participant-related artefact was kept ≤ 3% (Rogers et al., Citation2021b). Based on previous studies (Rogers et al., Citation2021, Citation2021), a DFA-a1 value of 0.75 was selected for HRVT detection. The following method was employed to determine the VO2 and HR at the HRVT: The Kubios HRV data output (HR and DFA-a1) was first time-aligned with the Omnical-based gas exchange data (VO2). A plot of HR vs DFA-a1 and HR vs VO2 for each ramp section of near linear decline of DFA-a1 was subsequently constructed in line with previous research (Rogers et al., Citation2021). The VO2 or HR at which DFA-a1 crossed the 0.75 value based on linear regression was set as the HRVT VO2 or HRVT HR respectively ( and S1). Finally, the VO2 and HR at HRVT were compared to the VO2 and HR at the respiratory gas analysis-derived VT1. Furthermore, the VO2 and HR at the respiratory gas analysis-derived VT1 and HRVT of the first ramp was compared to the VO2 and HR at the respiratory gas analysis-derived VT1 and HRVT of the second ramp to investigate the influence of fatigue.
VO2peak was also determined as a proxy of cardiorespiratory fitness and calculated as the highest moving average VO2 value obtained over 30 consecutive seconds in any of the two ramps.
2.6. Statistical analyses
All statistical analyses were performed using open-source statistical software (JASP version 0.16.2, Amsterdam, The Netherlands). Continuous data were presented as mean and standard deviations. After confirming normality using Shapiro-Wilk tests and distribution plots, differences in physiological outcomes between the two ramps were assessed using paired samples t-tests. Statistical significance was set at p < 0.05 and Bonferroni corrections were applied for multiple comparisons. Pearson correlations were used to determine the relationship between gas exchange VT1 and HRVT, and the relationship between the change in VO2 at HRVT and both VO2peak and weekly training time. Correlations were considered as < 0.01 trivial; 0.10–0.29 small; 0.30–0.49 moderate; 0.50–0.69 large; 0.70–0.89 very large; 0.90–0.99 nearly perfect (Hopkins, Citation2002). The standard error of estimate (SEE) and coefficient of determination (R2) are also reported.
Bland-Altman analyses with 95% limits of agreement were used to assess the absolute agreement between the gas exchange VT1 and HRVT, with linear regression being used to assess proportional bias. Mean absolute percent errors (MAPE) and the corresponding 95% limits of agreement were also calculated to provide an indication of overall error. MAPE were calculated as the absolute difference between the HRVT and the gas exchange VT1 divided by the gas exchange VT1 value, multiplied by 100. This is a more conservative estimate of error that takes into account both overestimation and underestimation because the absolute error value is used in the calculation.
3. Results
A total of 14 individuals (48%) were excluded from data analysis due to > 3% artefacts in the HRV data (n = 8, 28%), no dynamic range of DFA-a1 throughout the run (n = 1, 3%), missing data/test interruption (e.g., gaps in the HR data; n = 3, 10%), early cessation of the second ramp (n = 1, 3%), and low maximal HR and thus not a valid effort (n = 1, 3%). The final dataset therefore consisted of 15 individuals (12 males, 3 females; mean ± SD age 23.7 ± 4.4 years; body mass 74.5 ± 10.8 kg; body height 178.8 ± 8.5 cm).
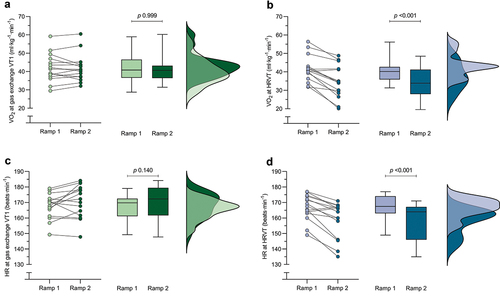
Table S1 reports the gas exchange and HRV outcomes during both ramps. Briefly, both VO2 and HR at gas exchange VT1 did not significantly differ between the two ramps, while VO2 at HRVT and HR at HRVT were significantly lower during the second ramp. also depicts the change in VO2 and HR at gas exchange and HRVT for both ramps. The change in VO2 at HRVT between the first and second ramp showed a trivial correlation with the VO2peak (r = 0.02) or weekly training time (r = 0.08).
Figure 2. Change in VO2 and HR at gas exchange VT1 (a & c) and HRVT (b & d) for both ramps. Dots represent individual data points, box and whiskers depict the median and interquartile range, and distribution plots represent the distribution of the datapoints. Abbreviations: HR, heart rate; HRVT, heart rate variability threshold; VO2, rate of oxygen uptake; VT1, first ventilatory threshold.
shows the Bland-Altman plots for the agreement between the VO2 and HR at gas exchange VT1 and HRVT, respectively. further reports the mean and standard deviation difference between gas exchange VT1 and HRVT methods, and the corresponding MAPE. There was no proportional bias or heteroscedasticity with increasing VO2 or HR values and regression lines are therefore not depicted. Supplementary Figure S2 shows the scatterplots for the agreement between VO2 and HR at gas exchange VT1 and HRVT during both ramps.
Figure 3. Bland-Altman plots depicting the agreement between VO2 at gas exchange VT1 and HRVT during the first (a) and second (b) ramp, and HR at gas exchange VT1 and HRVT during the first (c) and second (d) ramp. Black dots represent individual data points, black dashed lines represent the 95% limits of agreement. Abbreviations: HRVT, heart rate variability threshold; VO2, rate of oxygen uptake; VT1, first ventilatory threshold.
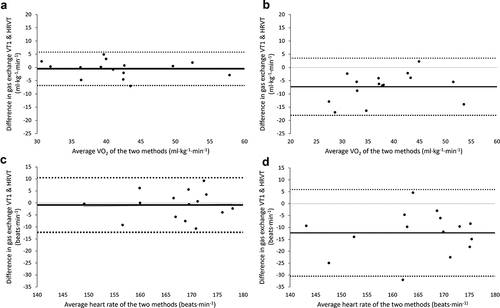
Table 1. Mean ± standard deviation difference and 95% limits of agreement between the gas exchange and HRVT during both ramps.
4. Discussion
This study aimed to investigate 1) the agreement between gas exchange VT1 and chest belt-based DFA-a1 HRVT during non-fatigued and fatigued running in males and females, and 2) to explore if the initial HRVT relationship was altered by a preceding incremental exercise ramp to failure. With regard to our first aim, we show strong agreement between the VO2 and HR at gas exchange VT1 and the HRVT. This relationship was however shifted after the first exercise ramp to exhaustion, in support of the concept of DFA-a1 behaviour as a potential marker of autonomic fatigue.
4.1. Agreement during non-fatigued conditions
The mean difference and 95% limits of agreement between VO2 and HR at gas exchange VT1 and HRVT during the first ramp were −0.5 (−6.8 to 5.8) ml∙kg−1∙min−1 and −0.9 (−12.2 to 10.5) beats∙min−1, respectively (). This indicates there is only a very small difference and hence strong agreement on a group level between both VO2 and HR at gas exchange VT1 and HRVT during the first (non-fatigued) ramp, with the 95% limits of agreement reflecting variable but generally still reasonable agreement at an individual level. Interestingly, the differences and limits of agreement in our study are smaller than reported in most previous studies, despite previous research typically using an ECG device or cycling for validation (Mateo-March et al., Citation2023; Rogers et al., Citation2021, Citation2021, Citation2022; Schaffarczyk et al., Citation2023). A previous study in recreational runners for example showed the mean difference for HR at VT1 was −1.9 beats∙min−1 with limits of agreement from −12 to 8 beats∙min−1 (Rogers et al., Citation2021). This study determined HRV using a research grade ECG with a mean artefact rate below 1%. During a cycling protocol, the mean difference between the first lactate threshold (LT1) and the HRVT was −1.7 beats∙min−1 with limits of agreement from −16.7 to 13.3 beats∙min−1 in elite triathletes (Rogers et al., Citation2022), or 3 beats∙min−1 with limits of agreement from −24 to 26 beats∙min−1 in professional cyclists when compared to the VT1 (Mateo-March et al., Citation2023). Importantly, HRV was also measured using a Polar H10 HR chest belt in both studies. Methodological differences related to the data analysis (Kubios settings) or data collection (e.g., use of a fan) may explain these differences. Nevertheless, our findings add to a growing body of literature showing that HRVT determination is generally accurate to assess the first ventilatory threshold in non-fatigued conditions across various populations and exercise conditions.
4.2. Agreement during fatigued conditions
Analogous with previous findings seen after ultramarathon-related fatigue (Gronwald et al., Citation2019, Citation2021; Rogers et al., Citation2021), the present data show that an acute fatiguing event (ramp 1) led to a reduction in DFA-a1 values at an equivalent running speed (Figure S1), with no significant alterations to VO2 or HR at the VT1 in the second ramp (). As a result, the agreement between HRVT and VT1 was substantially reduced in fatigued conditions. For example, the HR at HRVT was 12 beats∙min−1 lower in the second ramp, with 95% limits of agreement ranging from −30.4 to 5.9 beats∙min−1. This suggests that both real-time and retrospective assessments of endurance exercise thresholds may be altered in a fatigued state and indicates that the DFA-a1 value is best able to determine exercise intensity thresholds in a non-fatigued state.
The sensitivity of DFA-a1 to fatigue, however, also opens up other opportunities. For example, the DFA-a1 value may be useful as a proxy of total body fatigue/overall systemic internal load and organismic demand (Rogers & Gronwald, Citation2022; Rogers et al., Citation2021) potentially guiding the prescription of exercise and training, and recovery processes. For instance, a relatively low DFA-a1 value during a low-intensity warm-up (compared to other sessions with a similar warm-up intensity) may indicate the need to modify the exercise intensity of the upcoming session. Similarly, the recovery of DFA-a1 may be used to guide autonomic restoration between interval bouts, or the total number of intervals performed (e.g., Supplemental Figure S1). This concept of individualised adjustment of training has previously been done based on resting HRV, with this approach showing some benefits in submaximal physiological adaptations as compared to predefined training (Duking et al., Citation2021; Figueiredo et al., Citation2023; Nuuttila et al., Citation2022). For those unable to use resting HRV, DFA-a1 tracking during a standardised warm-up portion of an exercise session may substitute for equivalent or potentially even better information on autonomic status. To facilitate this application, DFA-a1 has been incorporated into commercial software applications such as AIEndurance to estimate “readiness to train”. Moreover, between-day reliability of DFA-a1 has recently been shown to be acceptable to good (Van Hooren et al., Citation2023). Further, DFA-a1 values may be more sensitive to fatigue than for example HR or VO2 (Rogers et al., Citation2021), which is also supported by our findings as VO2 or HR at VT1 did not significantly differ between the ramps (Supplemental table S1, ). Note however that a more fatiguing protocol can lead to alterations in VO2 during the second ramp (Berry et al., Citation2016).
An interesting observation was the large variability in DFA-a1 values at VT1 in the second ramp between participants. Our initial assumption was that individuals with higher baseline cardiorespiratory fitness (VO2peak) would exhibit less suppression (i.e., fatigue effects) in DFA-a1 behaviour during ramp two due to a superior capability of the autonomic nervous system to recover between the ramps. However, the magnitude of DFA-a1 reduction at VT1 in the second ramp showed only trivial correlations with VO2peak or weekly training hours. The observation that DFA-a1 behaviour during fatigue is not directly associated with conventional fitness markers such as VO2peak, could suggest that this outcome provides additional information that may be helpful to predict athletic performance or recovery ability (Maunder et al., Citation2021). However, it is important to note that the ramp protocol may have led to differences in the magnitude of fatigue between individuals for example due differences in the time to exhaustion once VO2peak was achieved, which may also have impacted these correlations.
4.3. Mechanistic explanation for DFA-a1 behavior
The underlying mechanism for DFA-a1 behaviour during exercise has been attributed to the antagonistic behaviour of the sympathetic and parasympathetic branches of the autonomic nervous system on the sinoatrial node and non-neural factors as well (Gronwald et al., Citation2020; Rogers & Gronwald, Citation2022; White & Raven, Citation2014). Specifically, with an increase in exercise intensity the parasympathetic component withdraws and the sympathetic component increases, resulting in a net decline of DFA-a1 values (Rogers & Gronwald, Citation2022). The suppressed DFA-a1 value during fatigue may relate to alterations of the sympathetic and parasympathetic balance (White & Raven, Citation2014). This process is also consistent with the “Network physiology” concept of organismic regulation during exercise (Balague et al., Citation2020) encompassing multiple neuromuscular, biochemical, peripheral, and central nervous system inputs leading to an overall effect on “organismic demand” that is reflected in correlation properties of HRV and therefore in the response of DFA-a1.
4.4. Limitations
There are several considerations that should be kept in mind when interpreting the current findings. First, gas exchange-based analysis can differ depending on both automatic (Ekkekakis et al., Citation2008) and visual (Meyer et al., Citation1996) methods for VT determination, thus leading to inaccurate delineation of zone boundaries (Hopker et al., Citation2011; Pallares et al., Citation2016). However, three assessors independently evaluated the thresholds and reached consensus to minimise bias. Moreover, gas exchange data was analysed prior to the HRV data to reduce potential bias in the determined gas exchange threshold. Overall, the error in VT1 determination is therefore likely small. Another related consideration is the degree of agreement between chest belt devices and ECG lead derived DFA-a1 values. Recent data indicate that these are closely related, but not identical. Whether this translates to deviation of the HRVT is unclear but a prior study looking at the Polar H7 and lab grade ECG did show a small downward bias in the HRVT (Rogers et al., Citation2021b). Therefore, different HR monitors and variations in belt or ECG lead placement can also introduce variations in the DFA-a1 value between and within individuals (Rogers & Gronwald, Citation2022; Rogers et al., Citation2022) and hereby affect the accuracy of this method for determining exercise intensity. In this study, we used the latest generation of the Polar chest belt (Polar H10), which is considered (one of the) most accurate wearable devices to determine HRV in field application and deemed superior to the H7 (Rogers & Gronwald, Citation2022).
A second consideration is related to artefact occurrences. In this study, the RR recording application (mobile application: Fatmaxxer) also recorded a 10-second ECG tracing around areas of suspected artefact for later retrospective analysis. Although many sections of artefact recordings represented simple motion-related noise, others were caused by an underlying baseline of poor ECG waveform amplitude, contributing to the failure of beat-to-beat recognition (see supplement figure S3 and S4 vs S5). This suboptimal signal-to-noise waveform could have been improved by either moving the chest belt or inverting the recording module as per Polar’s own documentation. We strongly recommend pre-test ECG waveform optimisation by using Polar API-related software to record and analyse each individual’s personal waveform. We had to exclude a significant number of individuals due to poor data quality, which may have been avoided by proper belt placement if known in advance. This exclusion of participants partly relates to the limitations in wearable technology for accurately determining non-linear HRV indexes and is in line with previous studies. For example, during a marathon race, data from four out of 15 participants was excluded due to RR interval artefacts (data collected using a Polar s810) (Gronwald et al., Citation2021). Similarly, 6 out of 17 participants were excluded due to the presence of artefacts in either the ECG or Polar H7 recording during treadmill running (Rogers et al., Citation2021b). In the present data, we also observed inappropriate suppression of HRV correlation properties in one of the individuals losing dynamic range of DFA-a1 despite good ECG waveform and little artefact. In this case, the DFA-a1 value was already markedly suppressed at the commencement of running (DFA-a1 < 0.5) and stayed suppressed until the walking transition. The reason for this behaviour is unclear, but possible causes include oscillation of the cardiac axis (and therefore the precision of the RR measurement) due to foot strike-related impact. Overall, these findings highlight that further improvements in technology may be helpful to ensure robust functioning of this method for usage during in-field applications. A third consideration is that we used data from either the test with or without encouragement depending on which test exhibited the best data quality (lowest artefact), yet to the authors’ knowledge it is unknown if verbal encouragement influences HRV or gas exchange VT1. However, we expect any influence of verbal encouragement to be minimal due to the infrequent nature and low volume at submaximal intensities used for the present study. The fourth and final limitation is that we increased running speed by 0.5 km∙h−1 every 30 s during the ramp protocol, and it could be argued that this did not allow for sufficient time to achieve a steady state to identify the VT1 or HR at VT1. However, we do expect any bias from this to be minimal as ~2 min of time are typically required to reach a steady-state after initiating exercise after complete rest, suggesting 30 s of time for only a small increase in speed would be sufficient to reach a new steady-state. Moreover, a recent study showed that the steepness of the ramp did not impact the HRVT (Fleitas‐Paniagua et al., Citation2023).
4.4.1. Practical implications
The degree of agreement between the gold-standard VT1 assessment and HRVT on an individual level is important to consider when implementing this method into practice. Yet, previous studies typically discussed the agreement only at group level. While this is useful for studies that aim to investigate group responses, it is less useful for determining the applicability to individual athletes. The limits of agreement for the difference in VO2 and HR at VT1 in our study ranged from −6.8 to 5.8 ml∙kg−1∙min−1, and −12.2 to 10.5 beats∙min−1, respectively, during the first ramp. This indicates that on an individual level there can still be a potentially relevant difference in the exercise intensity estimated with DFA-a1, with an estimated zone 1 training session actually being a zone 2 training session and vice versa. It is, however, important to compare this variability in agreement to the accuracy of other methods for determining the aerobic threshold, and to the accuracy of other methods for prescribing exercise and training intensity in general. For example, the limits of agreement for VO2 at VT1 are only slightly larger than the variability present in gas exchange VT1 determination between different assessors (Franssen et al., Citation2022). Similarly, the first lactate threshold (LT1) has shown Pearson’s correlation coefficient values of 0.7 with gas exchange VT1 determination (Pallares et al., Citation2016). These findings therefore highlight that methods that are considered the gold-standard for exercise intensity demarcation have a comparable variability in their precision at an individual level. Similarly, other methods for prescribing exercise and training intensity such as fixed percentages of a maximal HR, VO2peak or metabolic equivalents can (also) introduce substantial errors in exercise intensity prescription at an individual level (Iannetta et al., Citation2020; Meyler et al., Citation2023), and this error is further increased when using estimates of the maximum HR or VO2peak (e.g (Düking et al., Citation2022)). While there is therefore a potentially relevant error at the individual level with the HRV approach in our study, its magnitude is in line with most existing methodologies, thus demonstrating the usefulness of this approach for determining exercise intensity in non-fatigued conditions with the potential of real-time monitoring threshold alteration in fatigued conditions.
5. Conclusion
Our findings show that a DFA-a1 of 0.75 during an incremental exercise ramp was closely related to the gas exchange VT1, with the accuracy at an individual level being comparable to the accuracy of other methods for VT1 determination. These findings therefore add further validation to the concept of using HRVT for exercise intensity demarcation. An important novelty to previous studies that typically used ECG or cycling, is that we used a commercial HR (variability) chest belt during a treadmill run, which better reflects in-field conditions for runners. We also observed a shift in agreement between the VO2 and HR at HRVT during a second ramp, indicating that the DFA-a1 derived correlation properties of HRV are sensitive to fatigue, which may therefore be used to guide exercise and training prescription. Nevertheless, further (hardware) improvements are required to ensure robust functioning of this method across all individuals.
Author contributions
Devising research (BVH, BB, TG, BR), data collection (BM, BVH), data analysis (BVH, BR, BM, BB), manuscript writing (BVH, BR), editing the manuscript (all authors). All authors provided suggestions, revisions and edits to the manuscript and approved the final version.
Supplemental Material
Download Zip (759.8 KB)Acknowledgments
The authors would like to thank Nicolas Heemskerk and Pleun van der Lee for their assistance with data collection.
Disclosure statement
No potential conflict of interest was reported by the author(s).
Data availability statement
All data used in analyses are provided as a supplementary file.
Supplementary material
Supplemental data for this article can be accessed online https://doi.org/10.1080/02640414.2023.2277034
Additional information
Funding
References
- Anselmi, F., Cavigli, L., Pagliaro, A., Valente, S., Valentini, F., Cameli, M., Focardi, M., Mochi, N., Dendale, P., Hansen, D., Bonifazi, M., Halle, M., & D’Ascenzi, F. (2021). The importance of ventilatory thresholds to define aerobic exercise intensity in cardiac patients and healthy subjects. Scandinavian Journal of Medicine & Science in Sports, 31(9), 1796–1808. https://doi.org/10.1111/sms.14007
- Astrom, M., Garcia, J., Laguna, P., Pahlm, O., & Sornmo, L. (2003). Detection of body position changes using the surface electrocardiogram. Medical & Biological Engineering & Computing, 41(2), 164–171. https://doi.org/10.1007/BF02344884
- Balague, N., Hristovski, R., Almarcha, M., Garcia-Retortillo, S., & Ivanov, P. C. (2020). Network Physiology of exercise: Vision and perspectives. Frontiers in Physiology, 11, 611550. https://doi.org/10.3389/fphys.2020.611550
- Beneke, R., Leithauser, R. M., & Ochentel, O. (2011). Blood lactate diagnostics in exercise testing and training. International Journal of Sports Physiology & Performance, 6(1), 8–24. https://doi.org/10.1123/ijspp.6.1.8
- Berry, N. T., Wideman, L., Shields, E. W., & Battaglini, C. L. (2016). The effects of a duathlon simulation on ventilatory threshold and running economy. Journal of Sports Science & Medicine, 15(2), 247–253.
- Blasco-Lafarga, C., Camarena, B., & Mateo-March, M. (2017). Cardiovascular and Autonomic Responses to a Maximal Exercise Test in Elite Youngsters. International Journal of Sports Medicine, 38(9), 666–674. https://doi.org/10.1055/s-0043-110680
- Brownstein, C. G., Pastor, F. S., Mira, J., Murias, J. M., & Millet, G. Y. (2022). Power output manipulation from below to above the gas exchange threshold Results in exacerbated performance fatigability. Medicine & Science in Sports and Exercise, 54(11), 1947–1960. https://doi.org/10.1249/MSS.0000000000002976
- Cottin, F., Medigue, C., Lopes, P., Lepretre, P. M., Heubert, R., & Billat, V. (2007). Ventilatory thresholds assessment from heart rate variability during an incremental exhaustive running test. International Journal of Sports Medicine, 28(4), 287–294. https://doi.org/10.1055/s-2006-924355
- Düking, P., Van Hooren, B., & Sperlich, B. (2022). Assessment of peak oxygen uptake with a smartwatch and its usefulness for training of runners. International Journal of Sports Medicine, 43(7), 642–647. https://doi.org/10.1055/a-1686-9068
- Duking, P., Zinner, C., Trabelsi, K., Reed, J. L., Holmberg, H. C., Kunz, P., & Sperlich, B. (2021). Monitoring and adapting endurance training on the basis of heart rate variability monitored by wearable technologies: A systematic review with meta-analysis. Journal of Science & Medicine in Sport / Sports Medicine Australia, 24(11), 1180–1192. https://doi.org/10.1016/j.jsams.2021.04.012
- Ekkekakis, P., Lind, E., Hall, E. E., & Petruzzello, S. J. (2008). Do regression-based computer algorithms for determining the ventilatory threshold agree? Journal of Sports Sciences, 26(9), 967–976. https://doi.org/10.1080/02640410801910269
- Figueiredo, D. H., Figueiredo, D. H., Bellenger, C., & Machado, F. A. (2023). Individually guided training prescription by heart rate variability and self-reported measure of stress tolerance in recreational runners: Effects on endurance performance. Journal of Sports Sciences, 40(24) , 2732–2740. https://doi.org/10.1080/02640414.2023.2191082
- Fleitas‐Paniagua, P. R., de Almeida Azevedo, R., Trpcic, M., Murias, J. M., & Rogers, B. (2023). Effect of ramp slope on intensity thresholds based on correlation properties of heart rate variability during cycling. Physiological Reports, 11(15), e15782. https://doi.org/10.14814/phy2.15782
- Franssen, R. F. W., Eversdijk, A. J. J., Kuikhoven, M., Klaase, J. M., Vogelaar, F. J., Janssen-Heijnen, M. L. G., & Bongers, B. C. (2022). Inter-observer agreement of preoperative cardiopulmonary exercise test interpretation in major abdominal surgery. BMC Anesthesiology, 22(1), 131. https://doi.org/10.1186/s12871-022-01680-y
- Gaskill, S. E., Ruby, B. C., Walker, A. J., Sanchez, O. A., Serfass, R. C., & Leon, A. S. (2001). Validity and reliability of combining three methods to determine ventilatory threshold. Medicine & Science in Sports and Exercise, 33(11), 1841–1848. https://doi.org/10.1097/00005768-200111000-00007
- Gronwald, T., Berk, S., Altini, M., Mourot, L., Hoos, O., & Rogers, B. (2021). Real-time estimation of aerobic threshold and exercise intensity distribution using fractal correlation properties of heart rate variability: A single-case field application in a former olympic triathlete. Frontiers in Sports and Active Living, 3, 148. https://doi.org/10.3389/fspor.2021.668812
- Gronwald, T., Hoos, O., & Hottenrott, K. (2019). Effects of a short-term cycling interval session and active recovery on non-linear dynamics of cardiac autonomic activity in endurance trained cyclists. Journal of Clinical Medicine, 8(2), 194. https://doi.org/10.3390/jcm8020194
- Gronwald, T., Rogers, B., & Hoos, O. (2020). Fractal correlation properties of heart rate variability: A New biomarker for intensity distribution in endurance exercise and training prescription? Frontiers in Physiology, 11, 550572. https://doi.org/10.3389/fphys.2020.550572
- Gronwald, T., Rogers, B., Hottenrott, L., Hoos, O., & Hottenrott, K. (2021). Correlation properties of heart rate variability during a marathon race in recreational runners: Potential biomarker of complex regulation during endurance exercise. Journal of Sports Science & Medicine, 20(4), 557–563. https://doi.org/10.52082/jssm.2021.557
- Haugen, T., Sandbakk, O., Seiler, S., & Tonnessen, E. (2022). The training characteristics of world-class distance runners: An integration of scientific literature and Results-proven practice. Sports Medicine - Open, 8(1), 46. https://doi.org/10.1186/s40798-022-00438-7
- Hopker, J. G., Jobson, S. A., & Pandit, J. J. (2011). Controversies in the physiological basis of the ‘anaerobic threshold’ and their implications for clinical cardiopulmonary exercise testing. Anaesthesia, 66(2), 111–123. https://doi.org/10.1111/j.1365-2044.2010.06604.x
- Hopkins, W. G. A scale of magnitudes for effect statistics. 2002. newstats.org/effectmag.html. Accessed 1-3 15.
- Iannetta, D., Inglis, E. C., Mattu, A. T., Fontana, F. Y., Pogliaghi, S., Keir, D. A., & MURIAS, J. M. (2020). A critical evaluation of Current methods for exercise prescription in women and men. Medicine & Science in Sports and Exercise, 52(2), 466–473. https://doi.org/10.1249/MSS.0000000000002147
- Jamnick, N. A., Pettitt, R. W., Granata, C., Pyne, D. B., & Bishop, D. J. (2020). An examination and critique of Current methods to determine exercise intensity. Sports Medicine, 50(10), 1729–1756. https://doi.org/10.1007/s40279-020-01322-8
- Levett, D. Z. H., Jack, S., Swart, M., Carlisle, J., Wilson, J., Snowden, C., Riley, M., Danjoux, G., Ward, S. A., Older, P., & Grocott, M. P. W. (2018). Perioperative cardiopulmonary exercise testing (CPET): Consensus clinical guidelines on indications, organization, conduct, and physiological interpretation. British Journal of Anaesthesia, 120(3), 484–500. https://doi.org/10.1016/j.bja.2017.10.020
- Mateo-March, M., Moya-Ramon, M., Javaloyes, A., Sanchez-Munoz, C., & Clemente-Suarez, V. J. (2023). Validity of detrended fluctuation analysis of heart rate variability to determine intensity thresholds in elite cyclists. European Journal of Sport Science, 23(4), 580–587. https://doi.org/10.1080/17461391.2022.2047228
- Maunder, E., Seiler, S., Mildenhall, M. J., Kilding, A. E., & Plews, D. J. (2021). The importance of ‘durability’ in the physiological profiling of endurance athletes. Sports Medicine, 51(8), 1619–1628. https://doi.org/10.1007/s40279-021-01459-0
- Meyer, K., Hajric, R., Westbrook, S., Samek, L., Lehmann, M., Schwaibold, M., Betz, P., & Roskamm, H. (1996). Ventilatory and lactate threshold determinations in healthy normals and cardiac patients: Methodological problems. European Journal of Applied Physiology and Occupational Physiology, 72-72(5–6), 387–393. https://doi.org/10.1007/BF00242266
- Meyler, S., Bottoms, L., Wellsted, D., & Muniz-Pumares, D. (2023). Variability in exercise tolerance and physiological responses to exercise prescribed relative to physiological thresholds and to maximum oxygen uptake. Experimental Physiology, 108(4), 581–594. https://doi.org/10.1113/EP090878
- Naranjo-Orellana, J., Nieto-Jiménez, C., & Ruso-Álvarez, J. (2021). Non-linear heart rate dynamics during and after three controlled exercise intensities in healthy men. Physiology International, 107(4), 501–512. https://doi.org/10.1556/2060.2020.00039
- Nuuttila, O. P., Nummela, A., Korhonen, E., Hakkinen, K., & Kyrolainen, H. (2022). Individualized endurance training based on recovery and training status in recreational runners. Medicine & Science in Sports and Exercise, 54(10), 1690–1701. https://doi.org/10.1249/MSS.0000000000002968
- Pallares, J. G., Moran-Navarro, R., Ortega, J. F., Fernandez-Elias, V. E., Mora-Rodriguez, R., & Sandbakk, Ø. (2016). Validity and reliability of ventilatory and blood lactate thresholds in well-trained cyclists. PLoS One, 11(9), e0163389. https://doi.org/10.1371/journal.pone.0163389
- Rogers, B., Berk, S., & Gronwald, T. (2022). An index of non-linear HRV as a proxy of the aerobic threshold based on blood lactate concentration in elite triathletes. Sports, 10(2), 25. https://doi.org/10.3390/sports10020025
- Rogers, B., Giles, D., Draper, N., Hoos, O., & Gronwald, T. (2021). A New Detection method defining the aerobic threshold for endurance exercise and training prescription based on fractal correlation properties of heart rate variability. Frontiers in Physiology, 11(1806), 596567. https://doi.org/10.3389/fphys.2020.596567
- Rogers, B., Giles, D., Draper, N., Mourot, L., & Gronwald, T. (2021a). Detection of the anaerobic threshold in endurance sports: Validation of a new method using correlation properties of heart rate variability. Journal of Functional Morphology and Kinesiology, 6(2), 38. https://doi.org/10.3390/jfmk6020038
- Rogers, B., Giles, D., Draper, N., Mourot, L., & Gronwald, T. (2021b). Influence of artefact correction and recording device type on the practical application of a non-linear heart rate variability biomarker for aerobic threshold determination. Sensors-Basel, 21(3), 821. https://doi.org/10.3390/s21030821
- Rogers, B., & Gronwald, T. (2022). Fractal correlation properties of heart rate variability as a biomarker for intensity distribution and training prescription in endurance exercise: An update. Frontiers in Physiology, 13, 879071–. https://doi.org/10.3389/fphys.2022.879071
- Rogers, B., Mourot, L., Doucende, G., & Gronwald, T. (2021). Fractal correlation properties of heart rate variability as a biomarker of endurance exercise fatigue in ultramarathon runners. Physiological Reports, 9(14), e14956. https://doi.org/10.14814/phy2.14956
- Rogers, B., Mourot, L., & Gronwald, T. (2021). Aerobic threshold identification in a cardiac disease population based on correlation properties of heart rate variability. Journal of Clinical Medicine, 10(18), 4075. https://doi.org/10.3390/jcm10184075
- Rogers, B., Schaffarczyk, M., Clauß, M., Mourot, L., & Gronwald, T. (2022). The movesense Medical sensor chest belt device as single channel ECG for RR interval Detection and HRV analysis during resting state and incremental exercise: A cross-sectional validation study. Sensors, 22(5), 2032. https://doi.org/10.3390/s22052032
- Schaffarczyk, M., Rogers, B., Reer, R., & Gronwald, T. (2022). Fractal correlation properties of HRV as a noninvasive biomarker to assess the physiological status of triathletes during simulated warm-up sessions at low exercise intensity: A pilot study. BMC Sports Science, Medicine and Rehabilitation, 14(1). https://doi.org/10.1186/s13102-022-00596-x
- Schaffarczyk, M., Rogers, B., Reer, R., & Gronwald, T. (2023). Validation of a non-linear index of heart rate variability to determine aerobic and anaerobic thresholds during incremental cycling exercise in women. European Journal of Applied Physiology, 123(2), 299–309. https://doi.org/10.1007/s00421-022-05050-x
- Seiler, S. (2010). What is best practice for training intensity and duration distribution in endurance athletes? International Journal of Sports Physiology & Performance, 5(3), 276–291. https://doi.org/10.1123/ijspp.5.3.276
- Stanley, J., Peake, J. M., & Buchheit, M. (2013). Cardiac parasympathetic reactivation following exercise: Implications for training prescription. Sports Medicine, 43(12), 1259–1277. https://doi.org/10.1007/s40279-013-0083-4
- Tanaka, H., Monahan, K. D., & Seals, D. R. (2001). Age-predicted maximal heart rate revisited. Journal of the American College of Cardiology, 37(1), 153–156. https://doi.org/10.1016/s0735-1097(00)01054-8
- Van Hooren, B., Bongers, B. C., Rogers, B., & Gronwald, T. (2023). The between-day reliability of correlation properties of heart rate variability during running. Applied Psychophysiology and Biofeedback, 48(4), 453–460. https://doi.org/10.1007/s1084-023-09599-x
- Van Hooren, B., Souren, T., & Bongers, B. C. (2023). Accuracy of gas-exchange parameters and substrate use of fifteen CPET systems during simulated and human testing. Medicine & Science in Sport and Exercise. https://doi.org/10.1111/sms.14490
- Van Hooren, B., van der Lee, P., Plasqui, G., & Bongers, B. C. (2023). The effect of a standardized verbal encouragement protocol on peak oxygen uptake during treadmill running in healthy individuals: A randomized cross-over trial. European Journal of Sport Science Accepted.
- White, D. W., & Raven, P. B. (2014). Autonomic neural control of heart rate during dynamic exercise: Revisited. The Journal of Physiology, 592(12), 2491–2500. https://doi.org/10.1113/jphysiol.2014.271858