
ABSTRACT
Player interactions in Netball are critical during attacking phases of play to ensure possession is maintained and scoring opportunities are created. This study aims to analyse the characteristics of the passing networks of elite Netball teams and their association with performance outcomes (i.e., win/loss and final margin). Five network metrics used to represent the characteristics of teamwork were calculated for all team performances (n = 112) from one season of professional Netball in Australia. A two-way ANOVA and multiple linear modelling were used to compare characteristics between teams and match outcomes and to predict score margin, respectively. Pass density (F = 65.09, df = 102, p < .001) and pass centrality (F = 7.61, df = 102, p < .01) differed (were higher) in wins/losses. They were also statistically significant contributors (p ≤ .005) to the linear model that predicted a score margin (R2 = .731). Key player centrality and mutual connectedness were different between teams but did not differ by match outcome. The results suggest that, ideally, Netball teams should maximise the number of connections between player pairings, while also relying on a subset of players to be heavily involved in passing sequences. Team cohesion (via passing) therefore appears to be an important measure of team success in elite Netball.
Introduction
Team invasion sports require players to work collectively (e.g., passing the ball between one another to move into scoring positions) to achieve success (Grund, Citation2012). Netball is a court-based team invasion sport with the objective of moving the ball down the court into the goal circle to score (International Netball Federation, Citation2020). Netball has a unique set of rules compared to other team invasion sports, including (i) players are restricted from moving whilst in possession of the ball; (ii) playing positions are limited to specific areas of the court; iii) passes cannot go over one-third of the court (e.g., GS and GK cannot pass to each other) and (iv) only two playing positions can score goals (International Netball Federation, Citation2020). Interactions between players are therefore critical during attacking phases of play to ensure possession is maintained and scoring opportunities are created.
Research in netball has primarily used notational analysis methods to characterise successful and unsuccessful performance, while investigating isolated performance indicators at individual (e.g., passes from the centre position) and team levels (e.g., passes, goals, turnovers) (Bruce et al., Citation2018; Croft et al., Citation2017; O’Donoghue et al., Citation2008; Pulling et al., Citation2016). O’Donoghue et al. (Citation2008) found successful teams (i.e., higher final ladder position) generated more scoring opportunities, specifically from centre pass restarts and turnovers than unsuccessful teams. Whilst these findings highlight the characteristics of successful teams, there are a number of practical limitations. Determining how attacking phases of play are coordinated between players, whose playing positions were more prominent during the plays, and their overall relation to match success are currently difficult to ascertain. Thus, notational analysis is restricted when providing insight about the multi-dimensional interactions that teams execute during matches to score and succeed (Aquino et al., Citation2019; Croft et al., Citation2017; Gama et al., Citation2016).
One approach that has been posited to address the multi-dimensional interactions that occur in team sport is network analysis (Lusher et al., Citation2010). Network analysis is a method of analysing interactions, based on graph theory (Barnes & Harary, Citation1983). Within a sporting context, a pass between two players represents an interaction. The relationships between players in a team can be examined by analysing these interactions. Network analysis may be utilised to investigate the functionality and efficiency of a team (Kothari et al., Citation2014), identifying the characteristics of teamwork and the relationship with team performance outcomes. Network analysis may be used to provide coaches with actionable insights that assist with performance evaluation and match preparation through exploring player interactions and attacking mechanisms (Browne et al., Citation2019; Korte & Lames, Citation2019). By using passing and event-level data to construct a “network” of connections between players, network analysis can examine player interactions and reveal important features surrounding the involvement of players in attacking play (Wiig et al., Citation2019; Young et al., Citation2019a). This is achieved by investigating passing characteristics (i.e., passes completed, passes received, number of players involved in passing sequences, positions involved) to generate network metrics that quantify interconnectivity between players and describe levels of player involvement in chains of possession (Ramos et al., Citation2018; Wiig et al., Citation2019). Network analyses examining a range of network metrics have been conducted in soccer (Clemente et al., Citation2016, Citation2016; McLean et al., Citation2018), Australian rules football (Sheehan et al., Citation2019; Young et al., Citation2019a), handball (Korte & Lames, Citation2019) and basketball (Fewell et al., Citation2012) to effectively understand player interactions within teams. Associating network characteristics to match outcomes (i.e., winning versus losing and final score margin) can also reveal specific aspects of a team’s attacking play that may lead to success (Young et al., Citation2019a). Moreover, an area that has been thoroughly investigated in several sports (Croft et al., Citation2017; Lago-Peñas et al., Citation2017) is the identification of distinct characteristics/styles that separate teams (i.e., differences between teams). This has primarily used measures of technical performance (Young et al., Citation2019a). Within Netball, research has explored the characteristics of team playing styles using measures of technical performance (Croft et al., Citation2017), yet there is minimal investigation of other parameters that differ between teams and how these might relate to success.
The use of network analysis in Netball, unlike other team invasion sports, is limited. Only one study has analysed network characteristics in Netball. Browne et al. (Citation2019) used a network-based approach to investigate the order of passing sequences from centre passing plays in elite Netball. This research established the most prevalent passing sequence from centre pass restarts involved the goal attack, wing attack and goal shooter players in this order. This study is not without limitation, as a potential relationship between passing sequence order and match-related outcomes (i.e., goals and turnovers) was not investigated, and only a small portion of attacking match play (i.e., centre pass sequences) was examined (Browne et al., Citation2019). This approach omits plays that start from turnovers, or interrupted possession chains. Further research is warranted in Netball to quantify the importance of playing positions within a team and how this relates to performance and enhance our understanding of the relationship between teamwork characteristics and overall team performance outcomes. Moreover, utilising network-based approaches allows for a greater understanding of how teams execute attacking tactics through complex interactions between team members to achieve success (Young et al., Citation2019b). Therefore, there are two aims of this study, the first was to use network analysis to determine whether passing network characteristics differ between elite netball teams. The second aim was to assess whether passing network characteristics are associated with match-related outcomes and which of these are important and might provide a tactical advantage for teams.
Methods
An exemption from ethics review was granted by the University Human Research Ethics Committee for this study. Under this ethics agreement, team names were required to be de-identified and therefore this contextual information is not available in subsequent results. This project involved secondary data analysis, using pre-coded data collected via the NetballStats application (“app”) (Perana Sports, Australia). This data was collected via notational analysis from broadcast vision. Inter- and intra-rater reliability of the collected data has been reported previously (Bruce et al., Citation2022), with strong correlations (r > .80) identified for the frequency of game events (i.e., inter-rater reliability) and repeat analysis (i.e., intra-rater reliability). All 56 (112 team performances) regular season matches from the 2018 Suncorp Super Netball (SSN) competition were used in this study.
NetballStats enables users to code every pass and pass location inclusive of playing position and contextual information (e.g., centre pass receive, goal circle entry and goal attempt). The resultant output can generate multiple reports (including, for example, centre pass receivers and turnovers) as well as allow the raw data to be exported as a .csv file. In all passing events (n = 50,513) (i.e., when a player makes a pass, transferring possession of the ball to a teammate), this includes the centre pass restart, any passes in general play or passes from a throw-in and circle feeds, playing position and team for each possession were extracted from the data. Each pass equates to an event. Within the dataset, there were five “null” events where the type of event (pass type) was unknown and not coded for. Null events were subsequently excluded from the dataset and not accounted for in the analysis. There were 514 (1.01% of the total sample) passes included in the analysis, where the playing position of the player was not known at the moment of the pass. These passes were important to retain for the calculation of team-level network characteristics and this data did not create any distortion in the results as the network measures derived in this study were calculated at the team-level and therefore playing position information was not required. Possessions that did not result in a pass between teammates (e.g., thrown out of court, goal attempt, intercepted ball), were not included in the data set, therefore the data only represents complete passes.
All data analysis was conducted in R, using R-studio statistical computing software (“R”) (v 1.1.463, RStudio, Inc., Boston, MA). The {tidyverse} (Wickham et al., Citation2019) and {igraph} (Csardi and Nepusz, Citation2006) packages were used for data processing and analysis. All games and events provided 51,893 interactions (i.e., passes between players) from all 56 regular season games in the 2018 Suncorp Super Netball competition. Within R, one row of data represented each coded “possession” from the “NetballStats app”.
Several network metrics were derived for both teams in each match, using the possession data and match results (i.e., win/loss and score margin) appended to each match. Previous sport-specific definitions were developed by Young et al. (Citation2019a), which have been adapted to be representative of the netball context within the current study (see ). These measures were generated and their appropriateness for netball assessed. Three additional variables were considered, those being average path length, diameter and transitivity. These variables were removed prior to statistical analysis as they provided a limited range of values due to the inherent structure of netball (i.e., the limited number of players on the court and the limitations on which court positions can pass to one another). Henceforth, the common names of the network variables (see ) will be used to represent teamwork characteristics within this study.
Table 1. Sport specific network metric definitions.
Statistical analysis
Effective passes were removed from all statistical analyses as they were directly correlated (R2 = 1) with pass density (presented as a value instead of a proportion). The distribution and homogeneity of variance of each network metric was assessed using a Shapiro–Wilk test of normality, inspection of quantile–quantile plots, and Levene’s test (p < .05 indicative of non-normal distribution of residuals and violation of homogeneity of variance respectively).
To assess the presence of main effects or interactions for team and/or match outcome for each teamwork characteristic, a two-way analysis of variance (ANOVA) was used. Effect sizes were computed using the generalised eta squared and the magnitude of the effect interpreted as 0.02 (small effect), 0.13 (moderate effect) and 0.26 (large effect) (Cohen, Citation1992). To determine the relationship among network metrics and score margin, multiple linear modelling was utilised, where all data were expressed in relative form (i.e., the network variable value relative to the opposition in the same game).
Results
illustrate teamwork characteristics by match outcome, for each team (plus overall league median value). Across each team, a winning match outcome is represented by a higher pass density and pass centrality, compared to when they lose (see for statistical comparisons). The association for the remaining teamwork characteristics is less clear with many displaying team differences (pass centrality, key player centrality, pass density and mutual connectedness; see ).
Figure 1. Boxplot of pass density for each team in the SSN competition grouped by match outcome. The horizontal line represents the median, the box represents the interquartile range and the whiskers, the range.
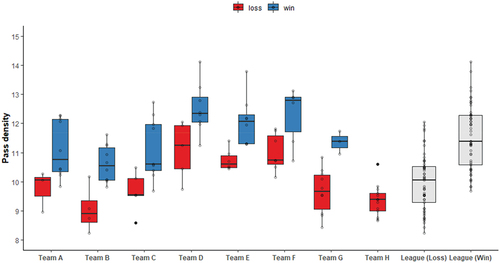
Figure 2. Boxplot of link centrality for each team in the SSN competition grouped by match outcome. The horizontal line represents the median, the box represents the interquartile range and the whiskers, the range.
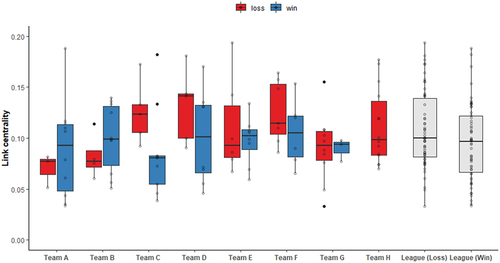
Figure 3. Boxplot of pass centrality for each team in the SSN competition grouped by match outcome. The horizontal line represents the median, the box represents the interquartile range and the whiskers, the range.
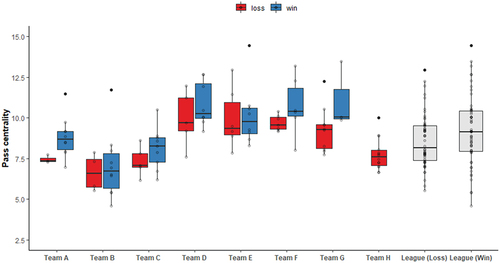
Figure 4. Boxplot of key player centrality for each team in the SSN competition grouped by match outcome. The horizontal line represents the median, the box represents the interquartile range and the whiskers, the range.
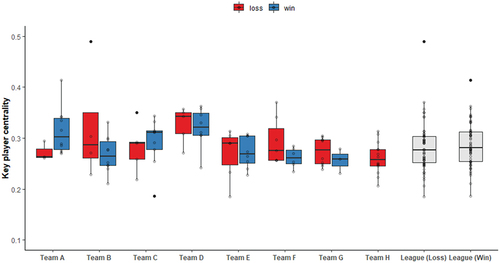
Figure 5. Boxplot of mutual connectedness for each team in the SSN competition grouped by match outcome. The horizontal line represents the median, the box represents the interquartile range and the whiskers, the range.
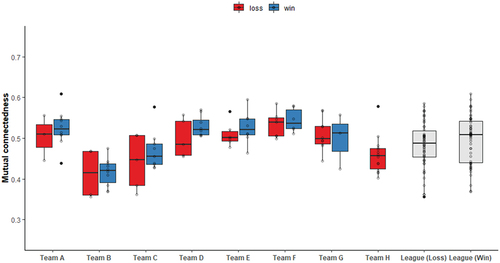
Table 2. Summary table of main effects and interactions for each teamwork characteristic. *Two-way ANOVA results. The effect size is based on the generalised eta squared; 0.02 (small), 0.13 (moderate), 0.26 (large).
Statistically significant main effects for team and match outcome were found for pass density () and pass centrality (; ). There was a significant main effect of the team on mutual connectedness () and key player centrality (; ). There were no significant interactions between the team and the match outcome.
The linear model quantifying the relationships between teamwork characteristics and score margin included all network variables and achieved a strong correlation with score margin (, adjusted R2 = 0.731). Pass centrality, pass density, key-player centrality and mutual connectedness had statistically significant contributions. Of these, the most important predictors of score margin (based on standardised beta coefficients) were pass density, mutual connectedness and pass centrality.
Table 3. Multiple linear model for all teamwork characteristics. The estimates include 95% confidence interval within parentheses. *=p < .05, **=p < .01, ***=p < .001. Std = standardised.
Discussion
This study examined whether teamwork characteristics varied between teams and were linked with match outcome in elite Netball. Teamwork characteristics were derived from the passing networks of individual teams. There was a main effect of pass centrality and pass density on match outcome, with higher values observed for wins. There was also a main effect of team on pass centrality, key player centrality, pass density and mutual connectedness, indicating that these characteristics vary between teams. This analytical approach reflects aspects of tactical performance that link to match outcomes and reveals the way teams collaborate to share possession of the ball varies.
The teamwork characteristic that had the strongest association with match outcome was pass density (see .). The pass density variable is a measure of the degree to which all passes made by the players utilise all possible pairs of players that can pass to one another. Higher pass density was associated with winning a match and with achieving a higher positive score margin. In a practical sense, pass density can be considered as a measure of team cohesion within attacking phases of play (Korte & Lames, Citation2019). This finding aligns with previous investigations in Australian Football (Young et al., Citation2019b), where higher passing density was also linked with success. This suggests that winning requires a “team effort”, where all possible passes between pairs of players are utilised by the team. This teamwork characteristic might reflect a deliberate tactic to exploit all possible passing pathways within the team, to avoid risky passes and to create shots at goal from locations that have a high likelihood of success. Whilst higher pass density is interpreted as a team passing to each other more frequently, creating many different passing options, more passes do not necessarily provide more opportunities to score, as teams can pass the ball around more but do not create more scoring opportunities. Conversely, teams can have fewer possessions and passes than their opposition but move the ball more efficiently towards scoring opportunities. Regardless, a lower value for the pass density is undesirable as it reflects a team whose passes involve a relatively small proportion (e.g., <10) of the possible pairings and can also reflect very infrequent passing between some pairs of players.
Mutual connectedness is partially linked to pass density as it relates to the degree to which a team exploits all possible opportunities to pass in both directions, between all pairs of players. However, its link with performance was less clear. There is no difference in mutual connectedness between win/loss outcomes, and though its role in the model that predicts score margin is statistically significant, its importance in the model is relatively small (one-third of the importance of pass density). Future research should further investigate the potential role that mutual connectedness has in relation to match outcomes. It is unclear whether mutual connectedness is important in netball in the current study. includes the playing position, abbreviation of position and the court restrictions placed on each position.
Table 4. Playing positions in netball and their court restrictions.
Three measures of the evenness (i.e., centrality) of the distribution of passes across all players in a team were used. Of these, only pass centrality discriminated between teams that won and lost (small-moderate effect), which had a statistically significant association with score margin. However, like mutual connectedness, it made a very small contribution to the prediction of score margin. High pass centrality represents a team in which a small proportion of players are involved in a high proportion of total passes, compared with all other players. The apparent advantage of high pass centrality in Netball is in contrast with previous findings in other sports (Clemente et al., Citation2015; Grund, Citation2012; Young et al., Citation2020). This difference might be explained by Netball’s unique rules, where players cannot pass “over a third” (i.e., from the defensive third to the attacking third). As a result, certain playing positions are unable to pass to each other, due to restrictions placed on the area of the court playing positions are allowed to move (e.g., GK and GS). However, because all teams play within the same constraints, differences in this characteristic between teams may represent an important determinant of match outcome. Pass centrality was also different between teams, indicating that teams might use different passing tactics, which may have an impact on team performance.
It is important to acknowledge the two measures of the evenness of the distribution of passes (i.e., key-player centrality and link centrality) are not clearly linked with performance. Although these measures represent characteristics of teamwork, they did not provide any advantage to team performance in the current study, despite one of them (key player centrality) differing between teams. These teamwork characteristics relate to the existence of frequently used passing sequences that rely on a consistent sub-group of players (high link centrality), and a sub-group of players that make and receive passes to a higher proportion of teammates (high key player centrality). These teamwork characteristics are related to performance in a football code (Young et al., Citation2019b). However, they may be less important in Netball given the relatively small team size and the rules that limit the opportunity for some playing positions to pass to each other. In Netball, they may merely represent an aspect of the playing style where one style is not “better” than another. Bruce et al. (Citation2018) drew a similar conclusion, whereby teams may have different playing styles, but successful teams are able to better execute their style relative to the opposition. Therefore, the existing evenness of the distribution of passing in Netball (or lack thereof) may not require consideration by coaches as it does not represent an opportunity to increase the likelihood of winning. However, coaches would still need to figure out what “style” and key players work best for them based on the construction of their playing group.
The analysis of tactical performance is possibly more difficult than that of physical or technical performance, given that tactics relate to interactions and collaboration between players within a team. Network analysis provides an opportunity to quantify team tactical performance from the perspective of ball passing, although the definitions of the network metric can be difficult to grasp. The visualisation of a passing network can help to explain these definitions. In addition, the comparison of network graphs that represent two teams in a match can clearly communicate how passing network characteristics (i.e., teamwork) can differ between teams and how they might affect match outcome. A case study example of the passing networks of two teams, in a match with a large (20+ points, 1.4 standard deviations above the league average score margin of 9.3) score margin is shown in . Players on the winning team are more densely connected (represented by thicker lines between players) and the spatial closeness between them. Conversely, the losing team has weaker connections with a greater distribution of passing. These subjective judgements can be supported with quantitative comparisons (see ) for each network measure. The values for each network measured from this case study align with the trends for win/loss present in the group data.
Figure 6. A case study example of the passing networks of two teams in a match. the nodes represent players, labelled by playing position and their size provide an indication of the number of passes a player has been involved in. The location in which the players are placed in the graph represents how central a player is to a team’s passing network. The thickness of the lines between the nodes represents the relative number of passes between the players. GK = goal keeper, GD = goal Defence, WD = Wing Defence, C = centre, WA = Wing attack, GA = goal attack, GS = goal Shooter.
Table 5. Network metrics for the teams that appear in . See for the definitions of the network metrics.
The winners had greater pass density, pass centrality and key player centrality values, and lower link centrality and mutual connectedness. These are the most common characteristics that separate teams that win and lose in the current study. The winners had relatively stronger and closer connections between their main attacking players (GS, GA, WA, and C). This suggests these four players were able to work together to provide scoring opportunities for their team. Whilst both C’s play a key role within their team (as evidenced by their location in the network graph and the size), the winning C has a relatively stronger connection with the defensive players (GK, GD and WD). This suggests the link between the winning team’s attack and defensive players was through their C. Being able to visualise a team’s passing network, may provide opportunities to strengthen a team’s own strategy or identify opportunities to combat opposition team strategies (e.g., denying the winning team’s C connections between the defence and attack phases). The intended practical application of this case study was to help analysts and coaches understand how passing network characteristics can be “seen” in a network diagram. Seeing the differences might help coaches understand the definitions of the network variables. Additionally, the visual representation of a passing network represents a way in which analysts can report and analyse tactical performance for the benefit of coaches and players. Furthermore, this approach to interpreting teamwork could be applied to any sport that involves passing between players.
There are several limitations of the current research that should be considered. While the sample size represents a very large number of passes, the comparisons are only across 56 matches between eight teams in one season. A wider number of seasons or leagues may reveal new differences in teamwork between teams. This study did not assess passing accuracy, even though incomplete passes may have an indirect effect on the value of some network metrics. A related study (Duch et al., Citation2010) demonstrated the complimentary value of including passing accuracy with network analysis. The measures of centrality used in this study may not be a pure reflection of ideal team tactics. Coaches sometimes tailor their tactics based on the skills of players in key positions. The quality of the player may influence the degree to which the team utilises them centrally within their passing network.
Future research should continue to explore whether there are differences in teamwork, using network analysis, using data from other leagues and teams. A prominent measure of passing performance in Netball is the number of turnovers (Ofoghi et al., Citation2021). A future study of passing networks in Netball could include a node for “turnover” as a way of understanding its role in team passing performance. Further research could examine whether high key player centrality and mutual connectedness relate to specific playing positions or whether they vary from team to team. The match outcome classification model performed well (R2 = 0.731); however, future work may be able to improve upon this. Finally, this study identified that higher passing centrality (i.e., reliance on key players/positions) was linked with successful outcomes. Future research could uncover if this was dependent on team personnel or playing positions that were typically more central (i.e., more important), which may have tactical implications.
In conclusion, ideal teamwork in Netball is characterised by teams that maximise passing between all possible pairs of players (i.e., high pass density) and also utilise a small proportion of players that are involved a high proportion of total passes (i.e., high pass centrality). There were differences in these characteristics between teams, which implies that they are also characteristics of playing style and that they may be associated with success. Care should be taken when interpreting these results, as high pass density does not simply mean more passes. Nor does it necessitate more opportunities to score. The playing style of each team may dictate passing characteristics and efficiency of ball movement. In addition, high pass centrality reflects a subset of players that collaborate effectively to move possession of the ball to those scoring opportunities. It is not clear if mutual connectedness is an important teamwork characteristic.
Acknowledgments
The authors would like to thank those who collected the data via the Netball Stats App.
Disclosure statement
No potential conflict of interest was reported by the author(s).
Additional information
Funding
References
- Aquino, R., Machado, J. C., Clemente, F. M., Praca, G. M., Goncalves, L. G. C., Melli-Nato, B., Ferrari, J. V. S., Vieira, L. H. P., Puggina, E. F., & Carling, C. (2019). Comparisons of ball possession, match running performance, player prominence and team network properties according to match outcome and playing formation during the 2018 FIFA World Cup. International Journal of Performance Analysis in Sport, 19(6), 1026–1037. https://doi.org/10.1080/24748668.2019.1689753
- Barnes, J. A., & Harary, F. (1983). Graph theory in network analysis. Social Networks, 5(2), 235–244.
- Browne, P., Morgan, S., Bahnisch, J., & Robertson, S. (2019). Discovering patterns of play in netball with network motifs and association rules. International Journal of Computer Science in Sport, 18(1), 64–79. https://doi.org/10.2478/ijcss-2019-0004
- Bruce, L., Brooks, E. R., & Woods, C. T. (2018). Team and seasonal performance indicator evolution in the ANZ Championship netball league. Journal of Sports Sciences, 36(24), 2771–2777. https://doi.org/10.1080/02640414.2018.1473099
- Bruce, L., Dwyer, D., Fox, A., & Cè, E. (2022). Reliability of live and video-based coding in netball using the NetballStats application. PLoS One, 17(6), e0269330. https://doi.org/10.1371/journal.pone.0269330
- Clemente, F. M., Jose, F., Oliveira, N., Martins, F. M. L., Mendes, R. S., Figueiredo, A. J., Wong, D. P., & Kalamaras, D. (2016). Network structure and centralization tendencies in professional football teams from Spanish La Liga and English Premier leagues. Journal of Human Sport & Exercise, 11(3), 376–389. https://doi.org/10.14198/jhse.2016.113.06
- Clemente, F. M., Martins, F. M. L., Kalamaras, D., & Mendes, R. S. (2015). Network analysis in basketball: Inspecting the prominent players using centrality metrics. Journal of Physical Education and Sport, 15(2), 212. https://doi.org/10.1080/24748668.2015.11868825
- Clemente, F. M., Martins, F. M. L., & Mendes, R. S. (2016). Analysis of scored and conceded goals by a football team throughout a season: A network analysis. Kinesiology, 48(1), 103–114. https://doi.org/10.26582/k.48.1.5
- Cohen, J. (1992). A power primer. Psychological Bulletin, 112(1), 155.
- Croft, H., Willcox, B., & Lamb, P. (2017). Using performance data to identify styles of play in netball: An alternative to performance indicators. International Journal of Performance Analysis in Sport, 17(6), 1034–1043. https://doi.org/10.1080/24748668.2017.1419408
- Csardi, G., & Nepusz, T. (2006). The igraph software package for complex network research. InterJournal, Complex Systems, 1695(5), 1–9.
- Duch, J., Waitzman, J. S., Amaral, L. A. N., & Scalas, E. (2010). Quantifying the performance of individual players in a team activity. PloS One, 5(6), e10937. https://doi.org/10.1371/journal.pone.0010937
- Fewell, J. H., Armbruster, D., Ingraham, J., Petersen, A., Waters, J. S., & Boccaletti, S. (2012). Basketball teams as strategic networks. PLoS ONE, 7(11), e47445. https://doi.org/10.1371/journal.pone.0047445
- Fullagar, H. H. K., McCall, A., Impellizzeri, F. M., Favero, T., & Coutts, A. J. (2019). The translation of Sport Science research to the field: A Current opinion and overview on the Perceptions of Practitioners, researchers and coaches. Sports Medicine, 49(12), 1817–1824. https://doi.org/10.1007/s40279-019-01139-0
- Gama, J., Dias, G., Couceiro, M., Belli, R., Vaz, V., Ribeiro, J., & Figueiredo, A. (2016). Network and centroid metrics for understanding football. South African Journal for Research in Sport, Physical Education and Recreation, 38(2), 75–90.
- Grund, T. U. (2012). Network structure and team performance: The case of English Premier league soccer teams. Social Networks, 34(4), 682–690. https://doi.org/10.1016/j.socnet.2012.08.004
- International Netball Federation. (2020). Rules of Netball. https://netball.com.au/sites/default/files/2020-01/INF_NETBALL%20RULE%20BOOK%20MANUAL%202020.pdf
- Korte, F., & Lames, M. (2019). Passing network analysis of positional attack formations in handball. Journal of Human Kinetics, 70, 209–221. https://doi.org/10.2478/hukin-2019-0044
- Kothari, A., Hamel, N., MacDonald, J. A., Meyer, M., Cohen, B., & Bonnenfant, D. (2014). Exploring community collaborations: Social network analysis as a reflective tool for public health. Systemic Practice and Action Research, 27, 123–137.
- Lago-Peñas, C., Gómez-Ruano, M., & Yang, G. (2017). Styles of play in professional soccer: An approach of the Chinese soccer Super league. International Journal of Performance Analysis in Sport, 17(6), 1073–1084. https://doi.org/10.1080/24748668.2018.1431857
- Lusher, D., Robins, G., & Kremer, P. (2010). The application of social network analysis to team sports. Measurement in Physical Education and Exercise Science, 14(4), 211–224.
- Mclean, S., Hulme, A., Mooney, M., Read, G. J. M., Bedford, A., & Salmon, P. M. (2019). A systems approach to performance analysis in women’s netball: Using work domain analysis to model elite netball performance. Frontiers in Psychology, 10, 201–214. https://doi.org/10.3389/fpsyg.2019.00201
- McLean, S., Salmon, P. M., Gorman, A. D., Stevens, N. J., & Solomon, C. (2018). A social network analysis of the goal scoring passing networks of the 2016 European football Championships. Human Movement Science, 57, 400–408. https://doi.org/10.1016/j.humov.2017.10.001
- O’Donoghue, P., Mayes, A., Edwards, K. M., & Garland, J. (2008). Performance norms of British National Super league netball. International Journal of Sports Science & Coaching, 3(4), 501–511. https://doi.org/10.1260/174795408787186486
- Ofoghi, B., Chenaghlou, M., Mooney, M., Dwyer, D. B., & Bruce, L. (2021). Team technical performance characteristics and their association with match outcome in elite netball. International Journal of Performance Analysis in Sport, 21(5), 700–712. https://doi.org/10.1080/24748668.2021.1938424
- Pulling, C., Eldridge, D., & Lomax, J. (2016). Centre passes in the UK Netball super league. International Journal of Performance Analysis in Sport, 16(1), 389–400. https://doi.org/10.1080/24748668.2016.11868894
- Ramos, J., Lopes, R. J., & Araujo, D. (2018). What’s next in complex networks? Capturing the concept of attacking play in invasive team sports. Sports Medicine, 48, 17–28. https://doi.org/10.1007/s40279-017-0786-z
- Sheehan, W. B., Tribolet, R., Watsford, M. L., Novak, A. R., Rennie, M. J., & Fransen, J. (2019). Using cooperative networks to analyse behaviour in professional Australian football. Journal of Science and Medicine in Sport, 23(3), 291–296. https://doi.org/10.1016/j.jsams.2019.09.012
- Wasserman, S., & Faust, K. (1994). Social network analysis. Cambridge University Press.
- Wickham, H., Averick, M., Bryan, J., Chang, W., McGowan, L., François, R., Grolemund, G., Hayes, A., Henry, L., Hester, J., Kuhn, M., Pedersen, T., Miller, E., Bache, S., Müller, K., Ooms, J., Robinson, D., Seidel, D., Spinu, V., & Yutani, H. (2019). Welcome to the tidyverse. Journal of Open Source Software, 4(43), 1686.
- Wiig, A. S., Haland, E. M., Stalhane, M., & Hvattum, L. M. (2019). Analyzing passing networks in association football based on the difficulty, risk, and potential of passes. International Journal of Computer Science in Sport, 18(3), 44–68. https://doi.org/10.2478/ijcss-2019-0017
- Young, C. M., Luo, W., Gastin, P. B., & Dwyer, D. B. (2020). Understanding the relative contribution of technical and tactical performance to match outcome in Australian football. Journal of Sports Sciences, 38(6), 676–681. https://doi.org/10.1080/02640414.2020.1724044
- Young, C. M., Luo, W., Gastin, P., Lai, J., & Dwyer, D. B. (2019a). Understanding effective tactics in Australian football using network analysis. International Journal of Performance Analysis in Sport, 19(3), 331–341. https://doi.org/10.1080/24748668.2019.1605562
- Young, C. M., Luo, W., Gastin, P., Tran, J., & Dwyer, D. B. (2019b). The relationship between match performance indicators and outcome in Australian football. Journal of Science and Medicine in Sport, 22(4), 467–471. https://doi.org/10.1016/j.jsams.2018.09.235