
ABSTRACT
Differences in workload exist between netball playing positions and competition levels, but no research has compared workloads experienced by the same elite players during national and international competitions. This study collected internal (heart rate) and external (PlayerLoad·min−1) workload data per match quarter from 44 players during a national competition and 12 players during an international competition. Nine players played in both competitions. Linear mixed models compared percentage of match quarter in each heart rate zone and PlayerLoad·min−1 between competitions for each playing position. Workloads against low- and high-ranked international opponents were also compared. Internal workloads were greater in national compared to international competition for GD and WD positions. PlayerLoad·min−1 was significantly higher by 8–13% in the national competition for positions WD and C, and by 5–8% in the international competition for GD and GA. Positional differences may indicate a role of the team’s tactical style of play. Workloads were generally greater against higher- rather than lower-ranked international opponents. These results indicate that tactical factors in combination with playing position and opposition characteristics should be considered when preparing physically for matches.
Introduction
Netball is an intermittent invasion ball game, played by two teams of seven players. Matches consist of four 15-minute quarters. The rectangular court (15.25 × 30.5 m) is divided into different areas, and each playing position is restricted to play in a specific area(s) (International Netball Federation, Citation2020). The positions are: Goal Keeper (GK); Goal Defence (GD); Wing Defence (WD); Centre (C); Wing Attack (WA); Goal Attack (GA); and Goal Shooter (GS). Netballers use varied high-intensity efforts, including short sprints, running, jumping, landing, and frequent changes of direction (Fox et al., Citation2013). In between the high-intensity efforts, movements of active and passive recovery or rest include shuffling, walking, standing, shooting, passing, rebounding, defending a player who is in possession of the ball, and guarding (Fox et al., Citation2013).
Workload can be measured in training and matches (Wehbe et al., Citation2014); effectively managing the workloads can help improve match performance and reduce the risk of overtraining (Brewer et al., Citation2010). Video footage has been frequently used in netball to quantify work:rest ratios, distances covered, and activity frequencies (Davidson & Trewartha, Citation2008; Fox et al., Citation2013; Loughran & O’Donoghue, Citation1999; Mackay et al., Citation2023; Otago, Citation1983; Steele & Chad, Citation1991). A Global Navigation Satellite System (GNSS) can be used to measure distances and speeds outdoors (Van Gogh et al., Citation2020), whereas a local positioning system set up around the court is necessary for the indoor sport of netball (Brooks et al., Citation2020). This may not always be feasible given costs and practicality, especially at away fixtures or competitions at neutral venues. Accelerometers within GNSS units have become increasingly popular for determining PlayerLoad (Bailey et al., Citation2017; Brooks et al., Citation2020; Chandler et al., Citation2014; Cormack et al., Citation2013; Van Gogh et al., Citation2020; Young et al., Citation2016) and have demonstrated high reliability in team sports (Boyd et al., Citation2011). PlayerLoad is the sum of instantaneous jerk across the three axes, divided by a scaling factor of 100 and measured in arbitrary units (au) (Boyd et al., Citation2011). Additionally, heart rate monitors have been frequently used for monitoring cardiovascular load during team sports performance (Fox et al., Citation2018; Schneider et al., Citation2018).
By quantifying physical workload, significant differences have been reported between netball playing positions. The C position has been found to spend more time in high-intensity activity (work:rest = 1:1.9 ± 0.4) than the GS (1:4.6 ± 0.8) and GK (1:3.0 ± 0.4) (Davidson & Trewartha, Citation2008), and also cover a greater total distance than the other positions (Brooks et al., Citation2020; Davidson & Trewartha, Citation2008; Van Gogh et al., Citation2020). Centre-court positions (WD, C, WA) also have a greater PlayerLoad·min−1 than attacking (GA, GS) or defending (GK, GD) positions (Bailey et al., Citation2017; Brooks et al., Citation2020; Chandler et al., Citation2014; Shaw et al., Citation2020; Young et al., Citation2016). In the Australian national netball league, for example, PlayerLoad·min1 has been reported as 7.31 ± 0.56 for GK, 10.29 ± 0.37 for GD, 9.36 ± 0.82 for WD, 12.09 ± 0.90 for C, 10.11 ± 0.51 for WA, 9.57 ± 0.30 for GA, and 6.38 ± 0.34 for GS (Brooks et al., Citation2020). Understanding these differing workloads is important for coaches and practitioners seeking to enhance athlete preparation and conditioning (Hughes & Franks, Citation2007). Additionally, it is important that training programmes are specific to the competition level that players are being prepared for (King et al., Citation2020).
Workloads in team sports tend to increase as the competition level increases (Beard et al., Citation2019; Cormack et al., Citation2013; Ferioli et al., Citation2020; Simpson et al., Citation2019). For example, state league netball players accumulated a greater workload during a match compared to recreational players (Cormack et al., Citation2013), and higher-level basketball players spend more time performing high-intensity activity compared to lower-level players (Ferioli et al., Citation2020). At the elite level, Spencer et al. (Citation2020) reported that workloads of netball umpires were greatest at higher levels of national competition. However, these differences were more technical (e.g., chosen movement type) than physical (e.g., distance covered) or physiological (e.g., heart rate) and it is unclear how the workloads of umpires reflect those of on-court players.
It remains unclear if differences in internal physiological (heart rate) and external biomechanical (PlayerLoad·min−1) workloads exist between national and international netball competitions. This is of particular importance to players, coaches, and practitioners who are preparing for both types of competition throughout their periodised season. Even though both national and international competitions may be considered elite, workloads in international competitions are greater than national competitions for men’s rugby (Beard et al., Citation2019) and women’s soccer (Andersson et al., Citation2010). Koyama et al. (Citation2024) found that players from one collegiate basketball team had greater external workloads in matches against professional teams compared to matches against other collegiate teams, indicating that the level of opponent also influences external workload in team sport matches. Other studies have also shown differing workloads within a competition depending on the ability of the opponent (Castillo et al., Citation2020; Rampinini et al., Citation2007). This may be particularly true in international netball, where scores in matches between high- and low-ranked nations are often uneven. Contributing factors may include resource disparities between countries, domestic popularity of the sport, and the relative strength of national competitions and pathways. The fact that all Netball World Cups since the inaugural competition in 1963 have been won by either Australia or New Zealand (except for one tied competition with an additional nation), and the presence of well-established elite national leagues in those countries, further suggests that the difference in workloads of national and international netball may be unclear for players from dominant higher ranked nations. It may be additionally informative to compare national league workloads between those selected and those not selected for the international squad, highlighting whether the workloads of the selective group are representative of the wider sample within that competition and whether workloads may be a limiting factor in squad selection.
The primary aim of this study was to compare the internal and external workloads of players competing in national and international netball, and examine if these differences vary by player position. It was hypothesised that workloads would be greater during international competition. Secondary aims were to compare national competition workloads between players selected or not selected for the international squad, and to compare international competition workloads between matches against high- or low-ranked opponents. No a priori hypotheses were made for these exploratory secondary aims.
Methods
Participants
Participants included 41 female players from five teams in the same elite national league and 12 players from one top-five ranked nation who participated in the 2015 World Cup (see for a breakdown by playing position). The national competition consisted of weekly matches over a season, whereas the international competition involved eight matches in 10 days. Nine participants played in both competitions, resulting in a total of 44 participants in the study (32 national only, three international only, and nine both competitions). Of the 32 national league only participants, six were from a nation other than the one which was monitored at the World Cup, three of which also competed in the international competition but for different nations. Data for these six players were only included when assessing national league workloads for all players, and were not included when comparing selected (n = 9) and non-selected (n = 26) players. Ethical approval was granted via the Auckland University of Technology Ethics Committee (15/321) and consent for the procedures was given by the participants.
Table 1. Number of quarters (from number of players) in which data were collected for each position and competition/group.
Data collection
The maximum heart rate (HRmax) for each participant was determined during a Yo-Yo Intermittent Recovery Test Level 1 within the usual high-performance training environment before the start of each competition, conducted in line with common guidelines (Wood, Citation2018). Heart rate on completion of the test can provide a valid estimation of a maximal physiological capacity (Bangsbo et al., Citation2008). Heart rate and PlayerLoad·min−1 data were collected during 10 national matches (data from 286 player-quarters; see for breakdown by playing position and number of players) and eight international matches against five high ranked (5th or higher) and three low ranked (9th or lower) opponents (215 player-quarters; for further details). An additional 23 player-quarters were recorded but not included within the analysis due to players not playing the full 15-minute quarter or data not recording successfully. The international team played in all stages of the competition, up to and including the final. Players wore Polar Team2 Pro Heart Rate system (Polar Electro © OY, Finland [Polar Precision Performance SW Version 4.02 software package]) straps to measure heart rate. Catapult MinimaxX Team 2.5 units were used to measure accelerometer data at 100 Hz, housed in a custom made harness between the scapulae to limit unwanted movement. Catapult MinimaxX units include an accelerometer, which is a reliable tool for measuring physical activity in team sports via the PlayerLoad metric (Boyd et al., Citation2011). The technologies and associated metrics used were the automated default options provided by the software used within the high-performance system at the time and remain commonly used within the sport. Individual players wore the same units throughout the international competition, but this could not be guaranteed for the national competition.
Data processing
Data from during the matches were saved per 15-minute quarter. Heart rate metrics were used to measure cardiovascular workload, including the percentage of each match quarter within each of five heart rate zones (Sylta et al., Citation2014): Zone 1 ≤ 60% HRmax; 60% < Zone 2 ≤ 75%; 75% < Zone 3 ≤ 85%; 85% < Zone 4 ≤ 96%; Zone 5 > 96% HRmax. Zones 4 and 5 were considered high-intensity heart rate zones (Polar, Citation2020). Raw accelerometer data were downloaded after each match, using Catapult Sprint software, and converted into PlayerLoad·min−1 as not all participants played in all quarters. To study the effect of international opponent ranking, the top five ranked nations at the time of the competition were categorised as high-ranked teams based on historical dominance and the nations ranked ninth or lower were listed as low-ranked teams.
Statistical analysis
To compare the internal and external loads of players competing in national and international netball and examine if these differences varied by player position (primary aim), a series of linear mixed models were used (α = 0.05). Percentage of each quarter in each heart rate zone and PlayerLoad·min−1 were treated as the dependant variables (separately), while competition level (national, international), and position (GK, GD, WD, C, WA, GA, GS) were specified as fixed effects (with an interaction). Participant was specified as the random effect to account for each player’s repeated measures. Match quarter was treated as a categorical variable and added as an additional fixed effect. This modelling strategy was repeated for the secondary aims, but selection status (selected, non-selected), and international opponent ranking (high, low) were included as fixed effects. For all models, estimated means and pairwise contrasts were computed for each competition, position, selection status, and opponent ranking, with multiple comparisons adjusted using the Bonferroni correction. For each contrast, the mean difference was expressed as a Cohen’s d-like standardised effect size, dr. This was computed by dividing the mean difference by the residual standard deviation of the random effect. The comparisons between competition levels (national vs international) were performed with data from all players, and again for the nine players who were recorded in both competitions. All analyses were conducted in R version 4.3.0; the lmerTest package was used to fit the mixed models, while the emmeans package was used to perform the contrasts.
Results
Heart rate zones
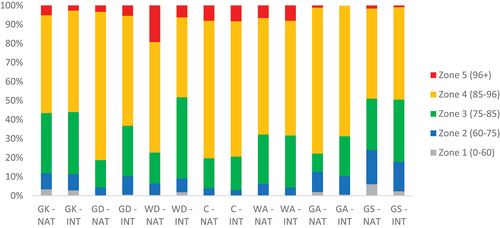
With all positions combined for the total group, players in the national competition spent a significantly lower percentage of each match quarter in heart rate zone 3 compared with players in the international competition (national 20.2%, international 28.9%, p = 0.002). No significant differences between competitions were reported for the other heart rate zones (0.079 ≤ p ≤ 0.828). Within the selected group of players that played in both competitions (n = 9), the percentage of match quarter spent in heart rate zone 3 was again significantly lower (p = 0.036) in the national competition (18.6 [95% CI 1.5, 35.7]%) compared to the international competition (25.4 [8.7, 42.1]%). In this group, the percentage of match quarter spent in heart rate zone 4 was significantly greater (p = 0.031) in the national (75.6 [52.9, 98.3]%) compared to the international competition (66.9 [5.5, 44.6]%). No significant differences were reported for heart rate zones 1, 2, or 5 (0.392 ≤ p ≤ 0.544).
Position-specific comparisons for the total group () revealed significant differences between national and international competitions at GD and WD. For these positions, the internal workloads were higher in national compared to international competition. Players at GD spent significantly (p = 0.021, dr = 0.6) more time in zone 4 in the national (78.9 [63.0, 94.9]%) compared to the international competition (57.7 [40.6, 74.8]%). Players at WD spent significantly less time in zone 3 (p = 0.005, dr 0.9) during national (16.8 [2.4, 31.2]%) compared to international competition (42.7 [29.2, 56.2]%) and significantly more time in zone 5 (p = 0.012, dr = 0.9) in the national competition (19.9 [10.5, 29.3]% vs 6.3 [−2.0, 14.6]%). Internal workloads at GK, C, WA, GA, and GS did not differ significantly between the national and international competitions (0.068 ≤ p ≤0.995). Position-specific heart rate data for the nine players who were recorded in both competitions showed no significant differences between national and international competitions (0.060 ≤ p ≤0.980).
Figure 1. Percentage of match quarter spent in each heart rate (HR) zone for the total group in national (NAT) and international (INT) competitions.
PlayerLoad·min−1
With all positions combined for the total group, PlayerLoad·min−1 did not differ significantly between the national and international competition (p = 0.219, ). However, significant differences in PlayerLoad·min−1 were reported between competitions for the GD, WD, C, and GA positions (). At WD and C, the PlayerLoad·min−1 was greater in the national competition, whereas it was greater in the international competition for GD and GA. For the other positions (GK, WA, GS) the PlayerLoad·min−1 did not differ significantly between the national and international competition. However, it should be noted that international data for GK were only recorded in matches against low-ranked teams.
Table 2. Estimated mean [95% confidence interval] PlayerLoad·min−1 (au) for each position and competition in the total group (all players included).
For the players who were recorded in both national and international competitions (n = 9), there was overall significantly greater PlayerLoad·min−1 in national compared to international competition (p = 0.001, ). For specific positions, significant differences in PlayerLoad·min−1 were reported between competitions for GD, C, and GA (). At GD and GA the PlayerLoad·min−1 was greater in the international competition, whereas for the C position it was greater in the national competition. No data were collected from selection group WD players in the national competition, so no comparison was made with the international competition.
Table 3. Estimated mean [95% confidence interval] PlayerLoad·min−1 (au) data for each position and competition in the selection group (those players recorded in both national and international competitions).
No significant overall (p = 0.364) or position-specific differences in PlayerLoad·min−1 were reported between the selected and non-selected players during the national competition (). In the international competition, the average score margin in five matches against high-ranked opponents was 6 ± 5 goals, whereas the three matches against low-ranked opponents were won by an average margin of 41 ± 4 goals. PlayerLoad·min−1 was significantly lower when playing against low- rather than high-ranked international opponents overall (p < 0.001) as well as for the GD, WD, WA, and GS positions (). No significant differences were reported at GA or C, and no analysis was possible at GK due to a lack of data against high-ranked opponents.
Table 4. Estimated mean [95% confidence interval] PlayerLoad·min−1 (au) data within the national competition for each position and selection status (selected for the international team or not).
Table 5. Estimated mean [95% confidence interval] PlayerLoad·min−1 (au) data for each position and opponent ranking (low = 9th or lower; high = 5th or higher) in the international matches.
Discussion
This study was the first to compare the internal and external workloads of elite national and international netball competitions and provides insight into potential requirements and necessary preparation for both. Internal physiological workload (heart rate) was generally similar in both competitions, except for the GD and WD positions where internal workloads were greater in the national competition. External biomechanical workload (PlayerLoad·min−1) was similar in both competitions for GK, WA and GS positions. External workload was greater in the national competition for WD and C positions but in the international competition for GD and GA positions. These findings were somewhat contrary to the hypothesis, based on previous research, of greater workloads during the international competition. Note that these measured workloads do not necessarily constitute requirements for the level of competition; i.e., the work performed by players wasn’t necessarily a required demand imposed on them. Likewise, the data are also limited to players from one national team and a limited pool of players in one national league. Caution should be advised in generalising beyond the present sample.
Positional differences in the effect of competition level may be explained by the match score, the role of each position, and/or the tactics employed by each team. The relative attacking and defensive responsibilities will vary with the roles of specific playing positions, and the relative attacking and defensive requirements/workloads are likely to vary in accordance with the ability of the opponent. Whereas national competition data were collected from multiple teams, international data were collected from a single team and so may therefore reflect the relative abilities and tactical requirements of that particular team rather than mean workloads of the competition. More evenly contested matches may result in more “end-to-end” rather than attack-dominant (in big winning margins) or defence-dominant (in big losing margins) workloads for centre-court players. This may explain the increase in time spent at high workloads for WD and C during the (more evenly balanced) national compared to international competitions. The greater workloads experienced by GD and GA during international matches perhaps implies a difference in the way these positions are used. For example, it’s common for the GS to play a relatively static “holding” role taking the greater proportion of shots, whilst the GA plays an important assisting role. However, some teams use a more dynamic “rotating” goal circle, with both GS and GA taking a more even share of shots. Although just an n = 1 example, this difference in playing styles and associated workload is highlighted by the World Cup final match in which one team saw 83% of their goals scored by GS and the other (the team included in this study) saw 69% scored by the GA. It is possible that the difference between national and international workloads for the shooting and corresponding defensive positions may therefore reflect a tactical difference, although it must also be considered that these are individual differences related to the specific individuals. Coaches and practitioners should be aware of the possible need to prepare players for the workloads associated with a particular tactical decision or game plan, but further research is required to investigate the effect of player and/or team tactics on associated workloads.
The results from the total group differ from those of Cormack et al. (Citation2013), who found that higher standard players experienced greater PlayerLoad·min−1 than lower standard players albeit in relatively lower competition levels of state league and recreational competitions. The national competition involved weekly matches spread over a season, whereas the international competition involved eight matches in 10 days. Internal and/or external workloads in the international competition may therefore have been negatively affected by incomplete recovery between matches, as shown previously (Andersson et al., Citation2008; Birdsey et al., Citation2019). The results from the total group provide a general comparison between national and international competitions, although the use of different players in each competition prevents a direct comparison of workloads. To do so, it is necessary to compare data from the selection group only.
Among the selection group (n = 9) who played in both competitions, there was an overall difference indicating higher external workloads during the national competition. Players in the GD and GA positions experienced greater PlayerLoad·min−1 during the international competition, whereas C experienced greater PlayerLoad·min−1 during the national competition. Scores in national competition matches were much closer on average than in the international competition. As in the whole group, closer matches may require a more “end-to-end” and hence greater overall workload from the C position in national competitions. This somewhat contradicts not only the a priori hypothesis but also previous results reporting greater workloads at higher competition levels across multiple team sports (Cormack et al., Citation2013; Ferioli et al., Citation2020; Simpson et al., Citation2019), including when comparing national and international competitions within the same group of players (Andersson et al., Citation2010; Beard et al., Citation2019). The present results should, of course, be interpreted in relation to the relatively small sample of players (and corresponding match quarters). Findings are specific to those individuals and their individual or team playing style, which may limit generalisability. Nonetheless, it is possible that these differences relate to opponent ability and therefore the relative balance of attacking and defensive responsibilities.
Data from the national competition were collected from a relatively well-matched five winning, five losing, and two drawing teams, whereas the international team won seven out of eight matches. The average score margin in five international matches against high-ranked opponents was 6 ± 5 goals, whereas the three international matches against low-ranked opponents were won by an average margin of 41 ± 4 goals. PlayerLoad·min−1 for four of the six assessed positions (GD, WD, WA, GS; insufficient data to assess GK for this comparison) was significantly lower when playing against low- rather than high-ranked opponents, in agreement with previous research (Castillo et al., Citation2020). It seems that the relatively high workloads of C and GA positions may be somewhat independent of opposition characteristics. Coaches should consider the opposition ability when determining training workloads before and after matches. Further research with a greater number of teams is required to determine any consistent trends in positional differences and the effect of opposition ability level. Recognising the observed variations in PlayerLoad·min−1 between matches against low- and high-ranked international opponents, a comparative analysis of the workloads during national competition and those during international matches against high-ranked opponents could offer valuable insights and a more comprehensive understanding of workloads in elite netball.
The results of this study can help coaches and practitioners to prepare athletes for the workloads of a particular competition (King et al., Citation2020) and playing position, particularly within a periodised training programme. The finding that external workloads in the national competition were similar for both selected and non-selected players suggests match workloads are unlikely to be a limiting factor affecting selection. Technical, tactical (Fox et al., Citation2014) and psychological factors (Richards et al., Citation2012) are likely more important. The coach-intended playing style should also be considered in preparation (King et al., Citation2020), such as the intended roles and partnership between GA and GS (own team and opposition). Technical player/match statistics may also provide an increased understanding of these workloads and differences between the competitions in future research.
It is important to consider that the data are from a previous high-performance cycle. The core principles of workload management and athlete preparation remain relevant but given the ever-evolving nature of sports science and slightly evolved rules and/or tactics, it is advisable to interpret the results within the context of that specific period. Subsequent research can assess hypotheses generated from the present findings to provide a more comprehensive understanding of the relationships between workloads, player performance, and tactical strategies in elite netball competitions alongside analysis of additional training load constructs, metrics, and specific movements within matches.
In summary, this study showed that the internal physiological workload, measured by heart rate, remained largely consistent across both competitions in contrast to hypothesised differences. Positional differences emerged, revealing significant variations in external biomechanical workload (PlayerLoad·min−1) between national and international matches for specific playing positions. The hypothesis of greater workloads during international competitions was contradicted by these findings. The unique workloads of closely contested national matches and the potentially different tactical utilisation of players in international encounters could explain some of these disparities. Within the international competition, workloads were greater when playing against higher- rather than lower-ranked opponents. The results give insight into the workload during different elite netball competition levels, and indicate that tactical factors in combination with playing position and opposition characteristics should be considered when preparing for matches. Nonetheless, caution should be advised when generalising the findings beyond the player(s) and team(s) in the present study, and further adequately powered research is necessary to test any resulting hypotheses.
Acknowledgments
We would like to thank Netball New Zealand for their assistance in the data acquisition for this research.
Disclosure statement
No potential conflict of interest was reported by the author(s).
Additional information
Funding
References
- Andersson, H., Raastad, T., Nilsson, J., Pausen, G., Garthe, I., & Kadi, F. (2008). Neuromuscular fatigue and recovery in elite female soccer: Effects of active recovery. Medicine & Science in Sports & Exercise, 40(2), 372–380. https://doi.org/10.1249/mss.0b013e31815b8497
- Andersson, H. A., Randers, M. B., Heiner-Møller, A., Krustrup, P., & Mohr, M. (2010). Elite female soccer players perform more high-intensity running when playing in international games compared with domestic league games. Journal of Strength and Conditioning Research, 24(4), 912–919. https://doi.org/10.1519/JSC.0b013e3181d09f21
- Bailey, J. A., Gastin, P. B., Mackey, L., & Dwyer, D. B. (2017). The player load associated with typical activities in elite netball. International Journal of Sports Physiology and Performance, 12(9), 1218–1223. https://doi.org/10.1123/ijspp.2016-0378
- Bangsbo, J., Iaia, F., & Krustrup, P. (2008). The Yo-Yo intermittent recovery Test: A useful tool for evaluation of physical performance in intermittent sports. Sports Medicine, 38(1), 37–51. https://doi.org/10.2165/00007256-200838010-00004
- Beard, A., Chambers, R., Millet, G. P., & Brocherie, F. (2019). Comparison of game movement positional profiles between professional club and senior international rugby union players. International Journal of Sports Medicine, 40(6), 385–389. https://doi.org/10.1055/a-0858-9973
- Birdsey, L. P., Russell, M., Weston, M., Johnston, M., Cook, C. J., & Kilduff, L. P. (2019). Neuromuscular, physiological and perceptual responses to an elite netball tournament. Journal of Sport Sciences, 37(19), 2169–2174. https://doi.org/10.1080/02640414.2019.1625613
- Boyd, L. J., Ball, K. A., & Aughey, R. J. (2011). The reliability of MinimaxX accelerometers for measuring physical activity in Australian football. International Journal of Sports Physiology and Performance, 6(3), 311–321. https://doi.org/10.1123/ijspp.6.3.311
- Brewer, C., Dawson, B., Heasman, J., Stewart, G., & Cormack, S. (2010). Movement pattern comparisons in elite (AFL) and sub-elite (WAFL) Australian football games using GPS. Journal of Science & Medicine in Sport, 13(6), 618–623. https://doi.org/10.1016/j.jsams.2010.01.005
- Brooks, E. R., Benson, A. C., Fox, A. S., & Bruce, L. M. (2020). Physical movement demands of elite-level netball match-play as measured by an indoor positioning system. Journal of Sports Sciences, 38(13), 1488–1495. https://doi.org/10.1080/02640414.2020.1745504
- Castillo, D., Raya-González, J., Scanlan, A. T., Domínguez-Díez, M., & Madueno, M. C. (2020). Influence of opponent ranking on the physical demands encountered during ultimate frisbee match-play. Sports Biomechanics, 22(7), 822–833. https://doi.org/10.1080/14763141.2020.1766101
- Chandler, P. T., Pinder, S. J., Curran, J. D., & Gabbett, T. J. (2014). Physical demands of training and competition in collegiate netball players. Journal of Strength and Conditioning Research, 28(10), 2732–2737. https://doi.org/10.1519/JSC.0000000000000486
- Cormack, S., Smith, R. L., Mooney, M., Young, W. B., & O’Brien, B. (2013). Accelerometer load as a measure of activity profile in different standards of netball match play. International Journal of Sports Physiology and Performance, 9(2), 283–291. https://doi.org/10.1123/ijspp.2012-0216
- Davidson, A., & Trewartha, G. (2008). Understanding the physiological demands of netball: A time-motion investigation. International Journal of Performance Analysis in Sport, 8(3), 1–17. https://doi.org/10.1080/24748668.2008.11868443
- Ferioli, D., Schelling, X., Bosio, A., La Torre, A., Rucco, D., & Rampinini, E. (2020). Match activities in basketball games: Comparison between different competitive levels. Journal of Strength and Conditioning Research, 34(1), 172–182. https://doi.org/10.1519/JSC.0000000000003039
- Fox, A., Spittle, M., Otago, L., & Saunders, N. (2013). Activity profiles of the Australian female netball team players during international competition: Implications for training practice. Journal of Sports Sciences, 31(14), 1588–1595. https://doi.org/10.1080/02640414.2013.792943
- Fox, A., Spittle, M., Otago, L., & Saunders, N. (2014). Offensive agility techniques performed during international netball competition. International Journal of Sports Science & Coaching, 9(3), 543–552. https://doi.org/10.1260/1747-9541.9.3.543
- Fox, J. L., Stanton, R., Sargent, C., Wintour, S.-A., & Scanlan, A. T. (2018). The association between training load and performance in team sports: A systematic review. Sports Medicine, 48(12), 2743–2774. https://doi.org/10.1007/s40279-018-0982-5
- Hughes, M., & Franks, I. (2007). The essentials of performance analysis: An introduction (1st ed.). Routledge. https://doi.org/10.4324/9780203938065
- International Netball Federation. (2020). Netball Rulebook Manual 2020. Von World Netball: https://drive.google.com/file/d/14E9H2xr69LZA7W0pmYPq48sb5qzhTHqk/viewabgerufen
- King, D. A., Cummins, C., Hume, P. A., & Clark, T. N. (2020). Physical demands of amateur domestic and representative netball in one season in New Zealand assessed using heart rate and movement analysis. Journal of Strength and Conditioning Research, 34(7), 2062–2070. https://doi.org/10.1519/JSC.0000000000002605
- Koyama, T., Nishikawa, J., Yaguchi, K., Irino, T., & Rikukawa, A. (2024). A comparison of the physical demands generated by playing different opponents in basketball friendly matches. Biology of Sport, 41(1), 253–260. https://doi.org/10.5114/biolsport.2024.129474
- Loughran, B., & O’Donoghue, P. (1999). Time-motion analysis of work-rate in club netball. Journal of Human Movement Studies, 36(1), 37–50.
- Mackay, L., Jones, B., van Rensburg, D. C. C. J., Hall, F., Alexander, L., Atkinson, K., Whitehead, S., Bedford, A., Cormack, S., Clarke, J., Croft, H., Denton, K., Fox, A. S., Hadley, P., Handyside, R., Hendricks, S., Kerss, J., Leota, L. & Viljoen, C. T. (2023). Consensus on a netball video analysis framework of descriptors and definitions by the netball video analysis consensus group. British Journal of Sports Medicine, 57(8), 441–449. https://doi.org/10.1136/bjsports-2022-106187
- Otago, L. (1983). A game analysis of the activity patterns of netball players. Sports Coaching: Professionalisation and Practice, 7(1), 24–28.
- Polar. (5. November. 2020). Heart Rate Zones - the Basics. Von Polar: https://www.polar.com/blog/running-heart-rate-zones-basics/abgerufen
- Rampinini, E., Coutts, A., Castagna, C., Sassi, R., & Impellizzeri, F. (2007). Variation in top level soccer match performance. International Journal of Sports Medicine, 28(12), 1018–1024. https://doi.org/10.1055/s-2007-965158
- Richards, P., Collins, D., & Mascarenhas, D. R. (2012). Developing rapid high-pressure team decision-making skills. The integration of slow deliberate reflective learning within the competitive performance environment: A case study of elite netball. Reflective Practice, 13(3), 407–424. https://doi.org/10.1080/14623943.2012.670111
- Schneider, C., Hanakam, F., Wiewelhove, T., Döweling, A., Kellmann, M., Meyer, T., Pfeiffer, M., & Ferrauti, A. (2018). Heart rate monitoring in team sports—A conceptual framework for contextualizing heart rate measures for training and recovery prescription. Frontiers in Physiology, 9, 639. https://doi.org/10.3389/fphys.2018.00639
- Shaw, M. L., Coetzee, F. F., Schall, R., & Kraak, W. J. (2020). Time-motion analysis of elite under-19 female netball players using GPS - research. South African Journal for Research in Sport, Physical Education and Recreation, 42(1), 57–70.
- Simpson, M. J., Jenkins, D. G., Leveritt, M. D., & Kelly, V. G. (2019). Physical profiles of elite, sub-elite, regional and age-group netballers. Journal of Sport Sciences, 37(11), 1212–1219. https://doi.org/10.1080/02640414.2018.1553269
- Spencer, K., Paget, N., Kilding, A., & McErlain-Naylor, S. A. (2020). Physical, physiological, and technical demands of national netball umpires at different competition levels. Journal of Sports Sciences, 38(14), 1660–1665. https://doi.org/10.1080/02640414.2020.1754718
- Steele, J., & Chad, K. (1991). Relationship between movement patterns performed in match play and in training by skilled netball players. Journal of Human Movement Studies, 20(6), 249–278.
- Sylta, O., Tonnessen, E., & Seiler, S. (2014). From heart-rate data to training quantification: A comparison of 3 methods of training-intensity analysis. International Journal of Sports Physiology and Performance, 9(1), 100–107. https://doi.org/10.1123/ijspp.2013-0298
- Van Gogh, M. J., Wallace, L. K., & Coutts, A. J. (2020). Positional demands and physical activity profiles of netball. Journal of Strength and Conditioning Research, 34(5), S. 1422–1430. https://doi.org/10.1519/JSC.0000000000002388
- Wehbe, G., Hartwig, T., & Duncan, C. (2014). Movement analysis of Australian national league soccer players using global positioning system technology. Journal of Strength and Conditioning Research, 28(3), 834–842. https://doi.org/10.1519/JSC.0b013e3182a35dd1
- Wood, R. (2018). The Complete Guide to the Yo-Yo Test”. Von the Complete Guide to the Yo-Yo Test. [Accessed 3-9-2023] abgerufen https://www.theyoyotest.com/
- Young, C. M., Gastin, P. B., Sanders, N., Mackey, L., & Dwyer, D. B. (2016). Player load in elite netball: Match, training, and positional comparisons. International Journal of Sports Physiology and Performance, 11(8), 1074–1079. https://doi.org/10.1123/ijspp.2015-0156