
 ?Mathematical formulae have been encoded as MathML and are displayed in this HTML version using MathJax in order to improve their display. Uncheck the box to turn MathJax off. This feature requires Javascript. Click on a formula to zoom.
ABSTRACT
Rugby sevens is a small-sided variant of rugby union characterised by fast-moving, high-intensity gameplay and is an example of a team invasion sport, where players work together to achieve a shared goal of attacking and defending as a cohesive unit. The dynamics of such sports can be viewed as self-organizing systems, where individual players form collective patterns without a centralized mechanism of control. Inspired by the analysis of collective movement in animals, this novel study investigates the emergent patterns of order and disorder in sub-elite female rugby sevens using order parameters (typically used to analyse particle systems) to characterize the team’s collective state during different phases of play. The findings demonstrate that defensive gameplay is more ordered, with more compact formations, compared to attacking play, and there is a correlation between alignment/order in player motion and group speed. The work further suggests that the collective states formed differ between sequences of play with different levels of ground gained by the attacking team. These observations provide a sound justification for player training with a focus on cohesive defensive movements to resist disruptions from opposing attackers, while employing attacking tactics that disrupt the cohesion and order of opposing teams.
Introduction
Team invasion sports require cooperative behaviour, which occurs when all players collectively aim to achieve the team’s shared goal of defending and attacking together whilst each fulfilling a distinct, independent role (Palmer et al., Citation2023). The aim of these sports is to invade an opponent’s territory to score goals whilst simultaneously attempting to prevent the opposition scoring (Gréhaigne et al., Citation1999). Different types of team invasion sports include those where the ball is thrown into a net/goal (e.g., basketball, netball, handball), struck with the foot or stick into a goal such as soccer, hurling, Australian Football or field hockey, or where the ball is carried across a line such as American Football, rugby league or rugby union (including rugby sevens) (Gréhaigne et al., Citation1999; Lamas et al., Citation2014; Lord et al., Citation2020). The collective movement of players within team invasion sports (such as the coordination of spacing, speed and direction of players) can be a key driver of team performance. Indeed, the movement of such sports can be viewed as dynamical systems composed of individual agents that form collective patterns, within the sets of constraints placed on the system, but without central control (Welch et al., Citation2021). Emergent visual displays resulting from the gameplay represent an impressive spectacle appreciated by fans, sponsors and promoters of the sports.
Many of the collective movement patterns observed in team invasion sports (such as rugby union and football) reflect those that emerge from group movement in other contexts (Duarte et al., Citation2012; Silva et al., Citation2016). These have included studies focusing on schools of fish, flocks of birds and even herds of terrestrial animals (Ballerini et al., Citation2008; Couzin et al., Citation2002; Ginelli et al., Citation2015; Katz et al., Citation2011). The most interesting aspect of these systems (in both human and non-human contexts) is the existence of self-organisation, whereby the group formations and movement trends emerge without a centralised system of control (Reynolds, Citation1987; Vicsek & Zafeiris, Citation2012; Vicsek et al., Citation1995). Simple repulsion, attraction and alignment interaction rules applied by individuals within a group can give rise to a range of emergent patterns when applied with different ranges and strengths (Couzin et al., Citation2002; Herbert-Read et al., Citation2011; Katz et al., Citation2011). These interactions are localised, with individuals only requiring information from a proportion of the group members to guide their motion and decision-making.
The interactions between the individuals within collectively moving groups can drive them to form one of a finite number of stable collective states (Tunstrøm et al., Citation2013). These collective states typically involve periods of organized group movement, where individuals move with consistent speed and alignment (typically described as a polar state) as well as periods of disordered group movement, where individuals strive to remain part of the group but do not align their individual movements or match their speeds with others (typically described as a swarm state). Combinations of these group-level behaviours result in emergent forms such as toroidal formations (typically described as milling) with high local alignment but global rotation, or dynamic formations with varying densities and levels of individual alignment (Couzin et al., Citation2002). Transitions between stable collective states occur when some form of perturbation takes place with enough change to the motion of individuals to move the system into an unstable transitional state. This transitional state typically only lasts a short time before the system re-settles into a new stable collective state (i.e., the re-emergence of homoeostasis) or back into the previous state if this proves to be the most stable configuration (Shimoyama et al., Citation1996).
Teams of individuals participating in invasion sports (including rugby sevens) can be viewed as dynamical systems composed of self-organising agents, much in the same way as flocks, schools and herds of animals are viewed in an ecological context (Correia et al., Citation2011). The key differences between the systems include the objectives, constraints and competitive demands placed on the agents by the physical elements of the sport and the rules that govern the sports as well as movement and behaviour. When multiple agents across opposing teams with opposing objectives interact, complex emergent trends can be observed and evidence has been presented for the existence of self-organising behaviour in team invasion sports (Passos & Araujo, Citation2013; Passos et al., Citation2009; Yamamoto, Citation2009). Self-organising systems are typically composed of multiple complex components with localised, non-linear interactions. Such systems reach a state of self-organised criticality where event sizes/durations exhibit power-law scaling (Bak et al., Citation1987). Variables that describe the structure and dynamics of these complex, self-organising systems typically have heavy-tailed distributions (in the form of a power-law distribution) as an emergent property of the underlying self-organised criticality (Marković & Gros, Citation2014). The presence of power-law distributions in statistics that govern interactions between players in game play have been demonstrated in a number of contexts and provides evidence of localised self-organisation within the interactions that occur in team-based sports. Investigation of 1-versus-1 attacker-defender dyads in rugby union (Passos et al., Citation2009), basketball and football have demonstrated that the distribution of rate of change in relative position of the players and the angle created between a vector between players and a line parallel with the goal line (positioned at the attacker or defender) follow a power-law distribution (Passos & Araujo, Citation2013). Investigation of the longitudinal position of the front line of players and ball in football suggests these are governed by mechanisms that result in power-law behaviour (Kijima et al., Citation2014).
The study of spatial interactions and team-level behaviour in team-based sport has largely focused on distributions of group-level metrics such as inter-team distances, centroid locations, stretch indexes (Bourbousson et al., Citation2010), surface area, length and width (often described as range) (Bourbousson et al., Citation2014; Duarte et al., Citation2013; Folgado et al., Citation2014; Frencken et al., Citation2013; Lames et al., Citation2010; Santos et al., Citation2020). These have been studied with a view to describe the underlying collective dynamics and as performance indicators across phases of play. It has been demonstrated in sports such as soccer and basketball that variables such as centroid and surface area oscillate over the course of game play and are highly correlated between opposing teams (Bourbousson et al., Citation2010; Lames et al., Citation2010). Short-distances between team centroids have been reported as reflective of either high defensive pressure or high attacking pressure, where attackers are attempting to create goal-scoring opportunities. Breaks in defence (where a team was able to score) have been reported to be preceded by a crossing over of the centroid (in the forward-backward direction) and breakdown of the correlated oscillation pattern (Frencken et al., Citation2011). Similarly, variability in inter-team distances has been explored as a predictor for match events, with high-variability and instability linked with defensive actions and re-organisation of the teams between plays (Frencken et al., Citation2012). The study of these group-level variables has been extended to characterise the presence of collective states, describing periods of order and disorder across the different phases of a match in soccer (Welch et al., Citation2021). Order parameters quantifying parallel and rotational movement, typically used to describe particle systems and collective behaviours in biological systems, were used to characterise states of order and disorder within offensive and defensive phases of play. It was demonstrated that defensive play exhibited higher levels of collective order and there was link between team movement speed and collective order (i.e., collective order is likely a requirement for faster team movement).
The research presented in this study examines characteristics of collective states in rugby sevens though a case study of sub-elite female rugby sevens gameplay. Rugby sevens is the small-sided variant of rugby union with teams of 7 players per side (as opposed to 15 players), playing 7-minute halves (as opposed to 40 minutes) on a standard rugby union playing field. These modifications to the game result in high-intensity play with individual players covering a larger proportion of match distances at higher intensities (Ball et al., Citation2019; Clarke et al., Citation2017; Suarez-Arrones et al., Citation2012). The main objective is to gain ground, advancing the position of the ball and team up the field to create scoring opportunities. A main task constraint on players (i.e., using a dynamical systems lens), is the requirement for backwards passing of the ball. This ensures that territorial gain is made in phases of open-play by ball carriers running, passing and recycling the ball on being successfully tackled by the defence (Blackburn, Citation2014). During these sessions of open play, players on both teams must coordinate movements and maintain formations (Correia et al., Citation2011). The attacking team must maintain offensive pressure to gain ground allowing them to create scoring opportunities and breaks in the defensive line (i.e., a “line break”). The defence must maintain defensive coverage to prevent line breaks and apply pressure to the attacking team to minimise the territorial gains. It can be observed during these open-play sessions (i.e., when there are minimal stoppages), that elements of the collective movement patterns (i.e., collective states) characteristic of self-organising groups in nature (i.e., Schools of fish, flocks of birds) emerge.
There has been no comprehensive study in rugby sevens that investigates the existence of collective states across team behaviour. The aim of this study is to identify the key collective states that exist and quantify the collective order that is exhibited by attacking and defending teams within rugby sevens gameplay. To achieve this goal, this study draws inspiration from the analysis of particle systems and collective movement in animals by investigating the nature of the emergent patterns of order/disorder in rugby sevens using order parameters (and related group-level variables) to characterise the team’s collective state across different phases of play, and the stability of these collective states across sequences of play. The analysis examines the collective states that emerge during sequences of play where small or large distance gains occur, along with line-break scenarios to understand the link between group order and movement speed in these sequences.
Methods
Data and processing
This analysis made use of video data from sub-elite female rugby 7s. The videos follow the matches of the home team against several away teams collected across a single tournament. The videos of the entire field of play were captured using a GoPRO™ Hero 6 action camera (GoPro Inc. San Mateo, California U.S.) at 1080 × 1920 resolution (capturing 30 frames per-second) maintained in a fixed position in an elevated (and unobstructed) position around the mid-point on one side of the field. Segments of active gameplay were extracted from when the ball entered play to when play was interrupted by the referee or the ball was turned over to the other team (signalling the start of a new sequence). The movements of players when resetting (when the ball was no longer in play) was not included. Segments of play where it was not possible to reliably identify individual players, or the team to which they belong (e.g., through severe occlusion from other players) were excluded to ensure that all data segments under study contain a complete set of players for both teams. We excluded 7 segments of play, out of 43, totalling 373s. We used the Channel Spatial and Reliability Tracker (CSRT) algorithm (using the OpenCV 4.2.0 implementation (Bradski Citation2000)) to track the player positions within the videos, with an operator initially tagging a target player and making corrections as needed through the sequence (i.e., when occlusion by multiple players causes the tracking algorithm to miss the target player). This tracking process was completed for each individual player across each sequence of play, resulting in a set of pixel-space coordinate tracks. The pixel-space coordinates were converted from the field coordinates by performing a homography transformation. This approach uses markings from the field with known positions and dimensions to create a transform matrix that maps between the pixel and field coordinate spaces. Previous studies have demonstrated that this an effective approach to capture player positions (Manafifard et al., Citation2017; Pettersen et al., Citation2014; Stensland et al., Citation2014). The traces were then smoothed by a Savitzky-Golay filter with a linear kernel to remove noise introduced from the tracking process. The data was then broken down into sequences separated by tackles or the end of the continuous play segment. The resulting dataset contains 84 sequences from 3 games providing 16 minutes of total active gameplay with 9505 time-steps.
For further analysis, the sequences of gameplay were broken into 2 categories based on ground gained, measured by calculating the distance the ball was moved along the x-axis in the sequence with a third category to capture line breaks. This breakdown, provided in , describes the sequences that fall into each category. All data processing and statistical analysis were completed using MATLAB 2019a (The Mathworks, Citation2019). Institutional ethics approval was granted by the University of New England for the study (HE19–252).
Table 1. The breakdown of gameplay sequences across the dataset according to the ground gained.
Collective states
This study adopts the concept of a collective state (typically used to describe the group-level motion in animal movement and particle systems) and applies this to the study of player motion in rugby 7s. Across the different sequences of play (), for both attacking and defending teams we categorised group patterns of movement into 4 collective states: polar, swarm, mill, or transitional, using the method developed in (Tunstrøm et al., Citation2013). This method is based on the calculation of two collective order parameters, the polarisation (Pgroup) and group angular momentum (Mgroup) (Couzin et al., Citation2002; Tunstrøm et al., Citation2013).
Polarisation is a measure of overall alignment in motion on a scale from 0 to 1, with 1 indicating perfect alignment between all group members, and lower values of polarisation indicating less alignment. Polarisation is defined as:
where N is the number of individuals in a group, ui is the unit vector in the direction of the ith player’s travel (estimated from changes in position across consecutive time steps), and is the magnitude of the resultant vector formed from the sum of the vectors, ui.
Angular momentum is a measure of agreement in the sense of rotation of the group about its centre. It is also measured on a scale from 0 to 1, with 1 indicating a strongly ordered annular mill with all individuals rotating in the same sense, and lower values indicating less rotational order. Angular momentum is defined as:
where ri is the unit vector pointing from the group centre to the position of the ith player at a given time.
Both collective order parameters were calculated for all time steps of the data. We examined the relative frequency of paired (Mgroup, Pgroup) values via heat plots. Group movement was classified as polar at a given instant if Pgroup >0.65 and Mgroup <0.35, a swarm if Pgroup <0.35 and Mgroup <0.35, a mill if Pgroup <0.35 and Mgroup >0.65, and transitional otherwise. Additionally, we examined the stability of these group states. Using the time series of the order parameters, we determined the unbroken durations that each state persisted. We created Kaplan-Meier estimates for the survival functions for polar, swarm and transitional behaviour. In general, a survival function, S(t), represents the probability of a process persisting beyond a given duration, t. A Kaplan-Meier estimator is a standard method for constructing an empirical survival function directly from data (Kaplan & Meier, Citation1958). Mill behaviour was excluded due to insufficient occurrences. We compared survival functions using log-rank tests (Kalbfleisch & Prentice, Citation2011), as implemented in (Cardillo, Citation2008).
Descriptive values
In addition to the collective states, we examined other aspects of group structure and behaviour via mean team speed, Nth neighbour distances and Shannon entropy. The mean team speed was calculated for each time step by computing the speed of each player at each time step via the linear distance travelled divided by the time elapsed, then taking the average of these speeds. For each individual and time step, we calculated the distance to all other individuals on the field using the standard distance formula; neighbour ranks were then determined by sorting these distances in ascending order, with the first neighbour being the closest neighbour and the sixth neighbour being the furthest. The distance values were categorised by this neighbour rank and type of sequence they were derived from (outlined in ). The distributions of these distance values were presented using box-plots. Shannon entropy provides a measure of the predictability in the positional changes of the individuals within the team. This calculation follows the process in (Welch et al., Citation2021). We created a grid from −8 to 8 m with 0.5 m width cells. For a window of 20 time-steps we created a vector of the players’ velocity in ms−1 from consecutive time-steps of the data. This configuration provides both sufficient spatial resolution and range to account for the maximum individual stride lengths and sprint speeds identified by (Ball et al., Citation2019) over the time window. This was confirmed through inspection of the velocity vectors distributions to ensure that all vectors fit within the window size. We then incremented the count for the cell that this velocity points to. This gave us a grid of i rows and j columns where each cell contains a count denoted fij. The counts were then transformed to a grid of probabilities (pij) describing the probability of a player’s movement vector falling into a specific cell using (3). These probabilities are then used to calculate the Shannon entropy (Hgroup) using (4) for each time step t.
Results
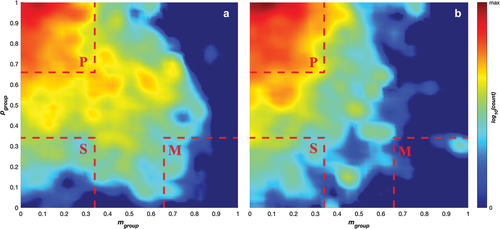
contains density plots for polarisation and rotation order parameters to examine the collective states across the attacking (1a) and defending (1b) game sequences. Both plots demonstrate that the team spends most of its time in the polarised collective state across both the attacking and defending sequences. Teams adopt the swarming and transitional states during both sequences, with the attacking sequences (1a) showing a wider spread of higher density across the transitional state. The attacking sequences extend slightly into the milling state with relatively low densities, whereas the defending sequences only have minor outliers within this state. The lack of milling behaviour and the high proportion of polar behaviour is expected as the game’s motion is highly linear, with teams maintaining attacking or defending lines moving the ball up the field. This pattern of movement provides limited opportunity for rotation about the centroid of the formation akin to the milling patterns adopted by schooling fish (Couzin et al., Citation2002).
Figure 1. log10 counts for the occurrence of pairings of angular momentum, Mgroup, and polarisation, Pgroup, values for teams while a) attacking and b) defending. The colour scale runs from 0 (dark blue) to the maximum log10(count) (darkest red) for each graph. Dashed red lines mark the boundaries of the regions where the team’s motion is identified as parallel (P), as a swarm (S), or a mill (M).
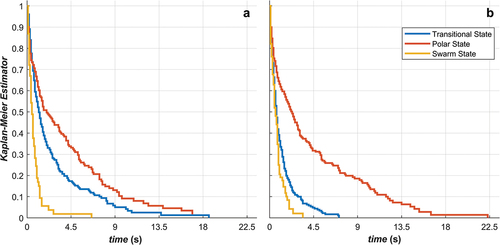
plots the survival curves for the durations of time spent in each of the sequences in the transitional, polar and swarm state for the attacking () and defending game phases (). Across both game phases, the longest sequences are spent in the polar state, followed by the transitional state and finally the swarm state. There is a larger difference between the polar and transitional (χ2 = 9.25, P ≈0, DF = 1)/swarm (χ2 = 7.77, P ≈0, DF = 1) survival curves in the defending phase compared to the attacking phase, indicating that the polar sequences tend to be longer compared to the other states across this game phase. Durations of the transitional state tend to be longer in the attacking game phase, with some transitional sequences having durations over 10 sec (i.e., up to 19 seconds), where the longest transitional sequences are less than 9 seconds in the defending phase (i.e., up to ~7.3 seconds). Swarm state sequences have relatively short durations across both game phases. These likely occur at the start and end of play sequences, when the order of play is breaking down or being established resulting in shorter durations (i.e., due to the end of the sequence or the establishment of a new state as play proceeds).
Figure 2. Kaplan-Meier estimates for the survival functions for the persistence of collective states while a) attacking and b) defending.
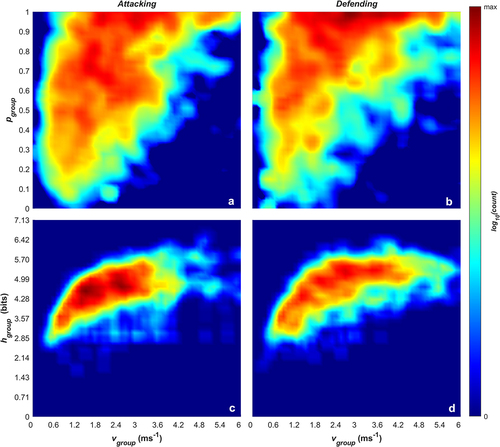
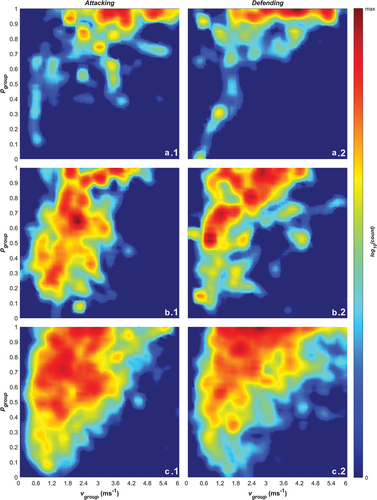
plots the paired densities of group entropy and polarisation against the group mean speed for the attacking phase () and defending phase (). Across both phases, there is a similar distribution of entropy, ranging from approximately 2bits up to 6.5bits. Entropy tends to increase with mean group speed, reaching a maximum at a group speed of around 2 ms−1. This demonstrates that individual player movements tend to be more predictable when the team is moving at a lower speed (recall that the entropy measure captures predictability of player movement considering both speed and direction). This indicates that group speed is a driver for predictability of movement, with higher group speeds driving a larger spread in player trajectories. Interestingly, the plots for polarisation and mean group speed for both game phases () show that at low mean group speeds, polarisation is distributed across the full range, and at higher mean group speeds (>2.0 ms−1) only higher polarisation values are seen.
Figure 3. log10 frequencies of paired group speed (vgroup) and polarisation (pgroup) values (a and b), and paired group speed and Shannon entropy (hgroup) values (c and d) for when the team was attacking (a and c) or defending (b and d).
provide a further breakdown of play across sequences that represent different gains by the attackers, ranging from small category (less than 5 m of ground gained), large category (more than 5 m of ground gained/lost) through to line-breaks that result in the ball being carried all the way to the try line. contains box plots of the metric distance to neighbouring players by their topological rank for each player (i.e., closest player as player 1 to furthest player as player 7) across each time step for the attacking () and defending () game phases grouped by the gain category. This provides insight into the spread of player positions and how they are providing coverage and pressure during the different playing sequences. plots the paired densities of polarisation and rotation order parameters for the attacking phase () and defending phase () for the line break, small gain and large gain categories, respectively. plots the paired densities of polarisation and mean group speed for the attacking phase () and defending phase () for the line break, large gain and small gain categories respectively. show that during line break sequences, in the attacking and defending phases, teams tend to move faster (>2.0 ms−1) and are highly polarised. show that during short gain sequences, both the attacking and defending teams demonstrated lower mean group speeds, with distributions remaining below <4.5 ms−1, while the large gain sequences () have mean group speed distributed across the entire observed range, following the overall trend in .
Figure 4. Distance to Nth neighbour while a) attacking and b) defending. There are 4 boxplots per neighbour rank, representing cases where the attacking team gained less than 5 metres (blue), greater than or equal to 5 metres (red), there was a break through a team’s defence (yellow), and for all these cases combined (purple).
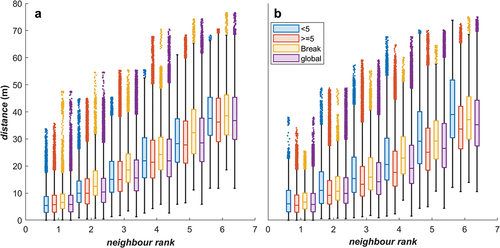
Figure 5. log10 frequencies of pairings of angular momentum, Mgroup, and polarisation, Pgroup, values for teams while 1) attacking and 2) defending broken down by a) breakaway by the attacking team, b) a gain in ground of less than 5 metres, and c) a gain in ground greater than or equal to 5 metres. All other details are the same as for .
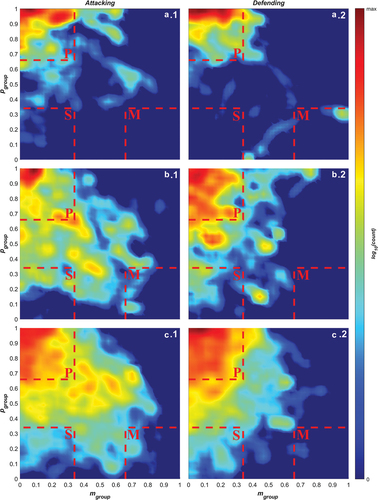
Figure 6. log10 frequencies of paired group speed (vgroup) and polarisation (pgroup) values while 1) attacking and 2) defending broken down by a) breakaway by the attacking team, b) a gain in ground of less than 5 metres, and c) a gain in ground greater than or equal to 5 metres.
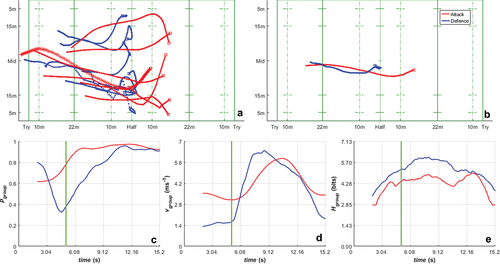
presents a case study for a line break sequence where the attacking team (red traces) scored after breaking through the defence team (blue traces). plots the traces of the trajectory data for all players on the attacking team (red) and the defending team (blue) across the sequence. The ball carrier is denoted with the “+” symbol on the offensive team and there are no passes in this sequence. plots the trajectory data for the team centroids, and plot the polarisation, mean group speed and entropy over time respectively, demonstrating the collective state transitions that occur for the attacking and defending roles through the line-break sequence of play as a function of time.
Figure 7. Top row: a) the individual paths taken by players during a single sequence of play (the ball carrier’s path is marked with + symbols), along with b) the paths of the team centroids (defined by the averages of the x- and y-coordinates of the players within each team). In this particular sequence, the red team is attacking and the blue team is defending. The starting point for each path is marked with a square. Bottom row: c) polarisation, d) group speed and e) Shannon entropy as functions of time during the same sequence of play. The vertical green line (in c, d, e) indicates the time at which the line break occurred.
Discussion
The aim of this study was to characterise the collective states that form through rugby sevens game play and understand the differences in group motion in relation to ground-gained, the movement speed of the group and predictability of player movement. There are a number of key findings that are evident from the results. The study demonstrates (1) that defensive gameplay has more compact coverage and has a higher degree of collective order, (2) group speed is linked with collective order and (3) the collective states that form within the group differ across sequences with different levels of ground gained. The case study of an example sequence of play demonstrates that changes in the collective state occur as the opposing teams respond to the competitive demands within the sequence of play.
Our initial finding (1) from this research is that there is a higher degree of collective order during periods of defensive game play (). It is likely that this trend emerges from the opposing competitive pressures that the teams impose on each other. Attacking teams must create opportunities to break through via deception, evasive side-stepping and higher speeds (Sayers & Washington-King, Citation2005). Previous research has shown that side-stepping manoeuvres with a change in angle between 20° and 60° account for up to 72% in tackle-breaks in some games (Wheeler et al., Citation2010). Attacking players that adopt an oblique running pattern (i.e., advancing on the defensive line, but not directly to the front of a defender) are more likely to successfully break through the defence. This pattern can account for up to two thirds of running sequences for attacking players (Sayers & Washington-King, Citation2005). The changes of direction linked with these offensive movement patterns will lead to a reduction in polarised group movement, giving rise to the wider distribution in the transitional segment in the polarisation-angular momentum space. Defensive play is focused on preventing the occurrence of gaps that can be exploited by attackers while also limiting any ground gained by the attackers. This will typically lead to forward movement of the defending team towards the attackers, with players maintaining defensive coverage in line formation, where individuals maintain a consistent spacing with neighbouring players (Sayers & Washington-King, Citation2005; Wheeler et al., Citation2010), resulting in the more ordered motion exhibited in this study. The emergence of more ordered motion and compact formations in the defensive game play reflects similar observations in association football (Marcelino et al., Citation2020; Welch et al., Citation2021). In football, the application of defensive pressure by closing in on the attacking player in possession of the ball, while maintaining tight defensive coverage leads to emergence of compact ordered motion within the defending team. While the specific goals and constraints vary between the two sports, this indicates a level of commonality in the underlying motion mechanics that may also apply to scenarios in other field sports. Team invasion sports, such as volleyball, basketball and hockey, have made various observations in relation to defending and attacking (Mizawa et al., Citation2022; Ramos-Villagrasa et al., Citation2012; Ramos, Coutinho, Silva, Davids, & Mesquita, Citation2017; Ramos, Coutinho, Silva, Davids, Guimarães, et al., Citation2017). For example, in elite level female volleyball, players have been found to exploit system stability in defensive/set up conditions (e.g., setting conditions and block opposition), but greater unpredictability in zone and the tempo of attack (Ramos, Coutinho, Silva, Davids, & Mesquita, Citation2017). In basketball, team patterns in defence and attack appear deterministic but chaotic and not related to team stability – the aim is for low-dimensional chaotic patterns (Ramos-Villagrasa et al., Citation2012). In sub-elite field hockey, more elite teams had less fluctuation in attack/defence equilibrium states, shown by relative successful pass frequency and superior shooting opportunities (Mizawa et al., Citation2022).
Another key finding (2) from this research was the positive correlation between alignment/order in player motion and group speed. The competitive pressure to maintain formations (either for defensive coverage or offensive passing opportunities) and move at higher speed likely results in the polarised movement patterns where players manage spacing and trajectories to meet the game demands. The randomness emerging at higher group speed is likely to result mostly from changes in speed and creating a greater spread of relative player trajectories, but with trajectories aligned in a similar direction (hence the higher polarisation). Previous studies have demonstrated similar relationships between group speed, entropy and polarisation measures within the movement of soccer teams (Welch et al., Citation2021). This has implications on the training strategies in invasion team sports. That is, higher individual and collective (group) speeds are useful capabilities that can be used to help break the line of defence for attacking players. Other studies on spatial patterns in soccer have highlighted external factors that can affect the link between collective order and speed. It has been demonstrated that the quality of the opposition team can impact regularity of movements through the study of the patterns in ball speed entropy (Gonçalves et al., Citation2019). Higher performing teams showed lower ball speed entropy (e.g., more collective order) than lower performing teams. The study of patterns in the dispersion of players over time (measured through a stretch index) found that stable states evolve across different timescales within play, indicating that the duration of play sequences is a factor in movement order (Ric et al., Citation2016). Outside of a sporting context, studies on pedestrian movement have demonstrated that lane-forming behaviour (where individuals move in a consistent direction in a polarised formation) allows pedestrians to maximise individual movement speeds by avoiding collisions. Individual speed decreases exponentially when either the density increases or traffic moving in the opposite direction is introduced (Teknomo, Citation2006). Similar relationships have been observed in shoaling fish, where polarised formations move at higher speeds (Viscido et al., Citation2004). This provides evidence of an overarching pattern that can emerge within group movement across a range of domains and supports the idea of training players to maintain aligned and predictable movements to allow for higher group speeds (i.e., in situations where group speed is advantageous).
A further key finding (3) of our research was the breakdown of play sequences as ground is gained. The breakdown of play sequences by ground-gain provides insight into the movement dynamics and the level of success achieved in the game. The median inter-player distance varied in a linear trend according to neighbour rank across all gain categories (i.e., < 5 m, > 5 m and break), as outlined in . This observation is consistent with a team that has a relatively static formation where a desired player spacing is maintained through their group movements. As the neighbour rank increases (i.e., examine the 1st through to the 6th closest teammate), the distributions of neighbour distances tend to increase for all categories and remains relatively stable. In the defending phase, the small gain category (i.e., < 5 m gained) has the highest median distances for all neighbour ranks relative to the categories. This indicates that defenders have wider spacing for defensive coverage and are not compelled (or don’t have time) to apply concentrated defensive pressure in one area of the field when small gains are made by the attacker. In attacking game phases, the line break category has the highest median neighbour distance across all categories (excluding the global set). This is expected as attacking players become spread out to create passing opportunities and player(s) involved with the line break make fast gains. These observations are consistent with previous research in rugby union which demonstrated that players co-adapt to maintain functional interpersonal distances and these interpersonal distances are context dependent (Passos et al., Citation2011; Rodrigues & Passos, Citation2013). In this study, the different gain categories represent the different combinations of interactions and result in different patterns on interpersonal spacing.
Further to the links between ground-gained and the breakdown in play sequences, we also found a key relationship between group speed and polarisation (). We identified that group order and positional predictability is linked with fast group movement, with line break plays showing higher group speeds and high polarisation. During the larger gain sequences (i.e., > 5 m), the balance of offensive and defensive pressure implicitly favours the offence and, as a result, greater movement speeds of the defensive and offensive formations are achieved (i.e., the defending team isn’t able to prevent ground being gained). The additional distance covered appears to provide enough movement for both teams to achieve collectively ordered states (with a slightly higher concentration of ordered motion in the defending phase observed in 6c1 vs 6c2)
During line-break sequences in both the attacking and defending phases (), teams spend almost all their time in the polar collective state. This represents a situation where the movements of players in both teams is highly aligned as the ball is moved across the field and likely arises from players on both teams moving to keep up with fast gains while maintaining their formation. During sequences where small gains are made (), teams exhibit a high concentration of polar behaviour with lower densities of transitional and swarm collective behaviour with some milling behaviour in the attacking phase (b1). The distributions demonstrate that when attacking, teams have higher densities across a broader range in the transitional state. A similar trend can be observed for sequences where large gains are made (), with similar concentrations in the polar state.
In our research, we have been able to demonstrate how emergent collective trends evolve through play (). We observed that the defending team adopted a relatively static line, that the attacking team was able to bypass, triggering a change in direction of the defending team as they attempted to chase down the ball carrier. The attacking team started the sequence with a higher mean group speed and lower polarisation than the defending team. This highlighted the role that disorder plays when the attacking team attempts to create and exploit gaps in the defensive line. This parallels observations of flocking animals, where prey animals tend to form ordered/polarised groups to reduce the risk of predation (Ioannou et al., Citation2012; Ruxton et al., Citation2007). In this context, the ball carrier is analogous to a predator attempting to attack a weak point in the defending group that is maintaining collective order to deny the predator a clear weak point to break the line. It could be hypothesised that development of these game tactics appears to mirror the evolution of behaviours in the natural world that favour survival.
The point at which the ball carrier breaks through the defensive line triggers a change in the collective motion of both teams; however, it is the defending team that sees the most radical transition. The polarisation of the defending team drops rapidly (as they re-organise) and their group speed increases sharply as they turn and chase. Over this time, polarisation steadily increases as the chase proceeds. The attacking team exhibits an increase in polarisation (which is maintained until the end of the sequence) and an increase in group speed as they break through to score. These changes in state are not clearly reflected in the entropy time series plot (), which shows a steady increase in entropy for both teams, with the defending team showing a consistently higher entropy. These changes reflect the observations from previous studies in rugby union that show sharp changes in individual player motion in response to game events, which are characteristic of self-organising system going through a sequence of re-organisation to form a new stable state (Passos & Araujo, Citation2013; Passos et al., Citation2009; Yamamoto, Citation2009).
This study quantified the emergent collective states in female sub-elite rugby 7s. Our results provide insight into the effect of different game phases on the group-level collective motion of rugby 7s teams. The results demonstrate the role that collective order plays in enabling higher-speed team-level movements – a trend that likely reflects the team’s imperative to maintain formation/coverage, avoid collisions and achieve movement speeds to meet competitive demands. The results show that collective movement in defensive formations is more ordered with longer durations and higher overall proportions of time spent in the polarised collective state when compared against attacking play. This evidence suggests that ordered group movement is linked with successful defensive play while the attacking play has more fluid, less ordered group patterns to attack defensive coverage and create scoring opportunities. These observations support the idea of training players with a strong focus on cohesive defensive movements that resist disruption from opposing attacking players, and attacking tactics that disrupt the cohesion of opposing teams.
Disclosure statement
No potential conflict of interest was reported by the authors.
Data availability statement
The participants of this study did not give written consent for their data to be shared publicly, so due to the sensitive nature of the research, supporting data is not available.
Additional information
Funding
References
- Bak, P., Tang, C., & Wiesenfeld, K. (1987). Self-organized criticality: An explanation of the 1/f noise. Physical Review Letters, 59(4), 381. https://doi.org/10.1103/PhysRevLett.59.381
- Ballerini, M., Cabibbo, N., Candelier, R., Cavagna, A., Cisbani, E., Giardina, I., Lecomte, V., Orlandi, A., Parisi, G., Procaccini, A., Viale, M., & Zdravkovic, V. (2008). Interaction ruling animal collective behavior depends on topological rather than metric distance: Evidence from a field study. Proceedings of the National Academy of Sciences, 105(4), 1232–1237. https://doi.org/10.1073/pnas.0711437105
- Ball, S., Halaki, M., & Orr, R. (2019). Movement demands of rugby sevens in men and women: A systematic review and meta-analysis. The Journal of Strength & Conditioning Research, 33(12), 3475–3490. https://doi.org/10.1519/JSC.0000000000003197
- Blackburn, M. (2014). Coaching rugby sevens. Bloomsbury Publishing.
- Bourbousson, J., Deschamps, T., & Travassos, B. (2014). From players to teams: Towards a multi-level approach of game constraints in team sports. International Journal of Sports Science & Coaching, 9(6), 1393–1406. https://doi.org/10.1260/1747-9541.9.6.1393
- Bourbousson, J., Sève, C., & McGarry, T. (2010). Space–time coordination dynamics in basketball: Part 2. The interaction between the two teams. Journal of Sports Sciences, 28(3), 349–358. https://doi.org/10.1080/02640410903503640
- Bradski, G. (2000). The OpenCV Library. Dobb’s Journal of Software Tools, 25 (11), 120–125.https://github.com/opencv/opencv/wiki/CiteOpenCV.
- Cardillo, G. LogRank: Comparing Survival Curves of Two Groups Using the Log Rank Test. (2008); Available from: http://www.mathworks.com/matlabcentral/fileexchange/22317.
- Clarke, A. C., Anson, J. M., & Pyne, D. B. (2017). Game movement demands and physical profiles of junior, senior and elite male and female rugby sevens players. Journal of Sports Sciences, 35(8), 727–733. https://doi.org/10.1080/02640414.2016.1186281
- Correia, V., Araújo, D., Davids, K., Fernandes, O., & Fonseca, S. (2011). Territorial gain dynamics regulates success in attacking sub-phases of team sports. Psychology of Sport and Exercise, 12(6), 662–669. https://doi.org/10.1016/j.psychsport.2011.06.001
- Couzin, I. D., KRAUSE, J., JAMES, R., RUXTON, G. D., & FRANKS, N. R. (2002). Collective memory and spatial sorting in animal groups. Journal of Theoretical Biology, 218(1), 1–11. https://doi.org/10.1006/jtbi.2002.3065
- Duarte, R., Araújo, D., Correia, V., & Davids, K. (2012). Sports teams as superorganisms: Implications of sociobiological models of behaviour for research and practice in team sports performance analysis. sports medicine. Sports Medicine, 42(8), 633–642. https://doi.org/10.1007/BF03262285
- Duarte, R., Araújo, D., Folgado, H., Esteves, P., Marques, P., & Davids, K. (2013). Capturing complex, non-linear team behaviours during competitive football performance. Journal of Systems Science and Complexity, 26(1), 62–72. https://doi.org/10.1007/s11424-013-2290-3
- Folgado, H., Lemmink, K. A. P. M., Frencken, W., & Sampaio, J. (2014). Length, width and centroid distance as measures of teams tactical performance in youth football. European Journal of Sport Science, 14(sup1), S487–S492. https://doi.org/10.1080/17461391.2012.730060
- Frencken, W., Lemmink, K., Delleman, N., & Visscher, C. (2011). Oscillations of centroid position and surface area of soccer teams in small-sided games. European Journal of Sport Science, 11(4), 215–223. https://doi.org/10.1080/17461391.2010.499967
- Frencken, W., Poel, H. D., Visscher, C., & Lemmink, K. (2012). Variability of inter-team distances associated with match events in elite-standard soccer. Journal of Sports Sciences, 30(12), 1207–1213. https://doi.org/10.1080/02640414.2012.703783
- Frencken, W., Van Der Plaats, J., Visscher, C., & Lemmink, K. (2013). Size matters: Pitch dimensions constrain interactive team behaviour in soccer. Journal of Systems Science and Complexity, 26(1), 85–93. https://doi.org/10.1007/s11424-013-2284-1
- Ginelli, F., Peruani, F., Pillot, M.-H., Chaté, H., Theraulaz, G., & Bon, R. (2015). Intermittent collective dynamics emerge from conflicting imperatives in sheep herds. Proceedings of the National Academy of Sciences, 112(41), 12729–12734. https://doi.org/10.1073/pnas.1503749112
- Gonçalves, B., Coutinho, D., Exel, J., Travassos, B., Lago, C., & Sampaio, J. (2019). Extracting spatial-temporal features that describe a team match demands when considering the effects of the quality of opposition in elite football. PloS One, 14(8), e0221368. https://doi.org/10.1371/journal.pone.0221368
- Gréhaigne, J.-F., Godbout, P., & Bouthier, D. (1999). The foundations of tactics and strategy in team sports. Journal of Teaching in Physical Education, 18(2), 159–174. https://doi.org/10.1123/jtpe.18.2.159
- Herbert-Read, J. E., Perna, A., Mann, R. P., Schaerf, T. M., Sumpter, D. J. T., & Ward, A. J. W. (2011). Inferring the rules of interaction of shoaling fish. Proceedings of the National Academy of Sciences, 108(46), 18726–18731. https://doi.org/10.1073/pnas.1109355108
- Ioannou, C. C., Guttal, V., & Couzin, I. D. (2012). Predatory fish select for coordinated collective motion in virtual prey. Science, 337(6099), 1212–1215. https://doi.org/10.1126/science.1218919
- Kalbfleisch, J. D., & Prentice, R. L. (2011). The statistical analysis of failure time data (Vol. 360). John Wiley & Sons.
- Kaplan, E. L., & Meier, P. (1958). Nonparametric estimation from incomplete observations. Journal of the American Statistical Association, 53(282), 457–481. https://doi.org/10.1080/01621459.1958.10501452
- Katz, Y., Tunstrøm, K., Ioannou, C. C., Huepe, C., & Couzin, I. D. (2011). Inferring the structure and dynamics of interactions in schooling fish. Proceedings of the National Academy of Sciences, 108(46), 18720–18725. https://doi.org/10.1073/pnas.1107583108
- Kijima, A., Yokoyama, K., Shima, H., & Yamamoto, Y. (2014). Emergence of self-similarity in football dynamics. The European Physical Journal B, 87(2), 41. https://doi.org/10.1140/epjb/e2014-40987-5
- Lamas, L., Barrera, J., Otranto, G., & Ugrinowitsch, C. (2014). Invasion team sports: Strategy and match modeling. International Journal of Performance Analysis in Sport, 14(1), 307–329. https://doi.org/10.1080/24748668.2014.11868723
- Lames, M., Ertmer, J., & Walter, F. (2010). Oscillations in football—order and disorder in spatial interactions between the two teams. International Journal of Sport Psychology, 41(4), 85.
- Lord, F., Pyne, D. B., Welvaert, M., & Mara, J. K. (2020). Methods of performance analysis in team invasion sports: A systematic review. Journal of Sports Sciences, 38(20), 2338–2349. https://doi.org/10.1080/02640414.2020.1785185
- Manafifard, M., Ebadi, H., & Moghaddam, H. A. (2017). A survey on player tracking in soccer videos (Vol. 159). Computer Vision and Image Understanding.
- Marcelino, R., Sampaio, J., Amichay, G., Gonçalves, B., Couzin, I. D., & Nagy, M. (2020). Collective movement analysis reveals coordination tactics of team players in football matches. chaos. Solitons & Fractals, 138, 109831. https://doi.org/10.1016/j.chaos.2020.109831
- Marković, D., & Gros, C. (2014). Power laws and self-organized criticality in theory and nature. Physics Reports, 536(2), 41–74. https://doi.org/10.1016/j.physrep.2013.11.002
- Mizawa, T., Okumura, M., & Kijima, A. (2022). Temporal and spatial structure of collective pass-chaining action performed by Japanese top-level field hockey players. frontiers in sports and active living. Frontiers in Sports and Active Living, 4, 867743. https://doi.org/10.3389/fspor.2022.867743
- Palmer, S., Novak, A. R., Tribolet, R., Watsford, M. L., & Fransen, J. (2023). Cooperative networks in team invasion games: A systematic mapping review. International Journal of Sports Science & Coaching, 18(6), 2347–2359. https://doi.org/10.1177/17479541231177133
- Passos, P., & Araujo, D. (2013). Self-organization processes in Field-Invasion Team Sports (Vol. 43). Sports Med.
- Passos, P., Araújo, D., Davids, K., Milho, J., & Gouveia L. (2009). Power law distributions in pattern dynamics of attacker-defender dyads in the team sport of Rugby Union: Phenomena in a region of self-organized criticality. Emergence: Complexity & Organization, 11(2), 37–45.
- Passos, P., Milho, J., Fonseca, S., Borges, J., Araújo, D., & Davids, K. (2011). Interpersonal distance regulates functional grouping tendencies of agents in team sports. Journal of Motor Behavior, 43(2), 155–163. https://doi.org/10.1080/00222895.2011.552078
- Pettersen, S. A. (2014). Soccer video and player position dataset. in Proceedings of the 5th ACM Multimedia Systems Conference, Association for Computing Machinery, New York, NY, USA.
- Ramos, A., Coutinho, P., Silva, P., Davids, K., Guimarães, E., & Mesquita, I. (2017). Entropy measures reveal collective tactical behaviours in volleyball teams: How variability and regularity in game actions influence competitive rankings and match status. International Journal of Performance Analysis in Sport, 17(6), 848–862. https://doi.org/10.1080/24748668.2017.1405611
- Ramos, A., Coutinho, P., Silva, P., Davids, K., & Mesquita, I. (2017). How players exploit variability and regularity of game actions in female volleyball teams. European Journal of Sport Science, 17(4), 473–481. https://doi.org/10.1080/17461391.2016.1271459
- Ramos-Villagrasa, P. J., Navarro, J., & García-Izquierdo, A. L. (2012). Chaotic dynamics and team effectiveness: Evidence from professional basketball. European Journal of Work and Organizational Psychology, 21(5), 778–802. https://doi.org/10.1080/1359432X.2012.669525
- Reynolds, C. W. (1987). Flocks, herds and schools: A distributed behavioral model. in Proceedings of the 14th annual conference on Computer graphics and interactive techniques, Association for Computing Machinery, New York, NY, USA.
- Ric, A., Torrents, C., Gonçalves, B., Sampaio, J., & Hristovski, R. (2016). Soft-assembled multilevel dynamics of tactical behaviors in soccer. frontiers in psychology. Frontiers in Psychology, 7, 1513. https://doi.org/10.3389/fpsyg.2016.01513
- Rodrigues, M., & Passos, P. (2013). Patterns of interpersonal coordination in rugby union: Analysis of collective behaviours in a match situation. Advances in Physical Education, 3(4), 209. https://doi.org/10.4236/ape.2013.34034
- Ruxton, G. D., Jackson, A. L., & Tosh, C. R. (2007). Confusion of predators does not rely on specialist coordinated behavior. Behavioral Ecology, 18(3), 590–596. https://doi.org/10.1093/beheco/arm009
- Santos, S., Coutinho, D., Gonçalves, B., Abade, E., Pasquarelli, B., & Sampaio, J. (2020). Effects of manipulating ball type on youth footballers’ performance during small-sided games. International Journal of Sports Science & Coaching, 15(2), 170–183. https://doi.org/10.1177/1747954120908003
- Sayers, M., & Washington-King, J. (2005). Characteristics of effective ball carries in super 12 rugby. International Journal of Performance Analysis in Sport, 5(3), 92–106. https://doi.org/10.1080/24748668.2005.11868341
- Shimoyama, N., Sugawara, K., Mizuguchi, T., Hayakawa, Y., & Sano, M. (1996). Collective motion in a system of motile elements. Physical Review Letters, 76(20), 3870. https://doi.org/10.1103/PhysRevLett.76.3870
- Silva, P., Duarte, R., Esteves, P., Travassos, B., & Vilar, L. (2016). Application of entropy measures to analysis of performance in team sports. International Journal of Performance Analysis in Sport, 16(2), 753–768. https://doi.org/10.1080/24748668.2016.11868921
- Stensland, H. K., Gaddam, V. R., Tennøe, M., Helgedagsrud, E., Næss, M., Alstad, H. K., Mortensen, A., Langseth, R., Ljødal, S., Landsverk, Ø., Griwodz, C., Halvorsen, P., Stenhaug, M., & Johansen, D. (2014). Bagadus: An integrated real-time system for soccer analytics. ACM Transactions on Multimedia Computing, Communications, and Applications (TOMM), 10(1s), 1–21. https://doi.org/10.1145/2541011
- Suarez-Arrones, L., Nuñez, F. J., Portillo, J., & Mendez-Villanueva, A. (2012). Match running performance and exercise intensity in elite female rugby sevens. The Journal of Strength & Conditioning Research, 26(7), 1858–1862. https://doi.org/10.1519/JSC.0b013e318238ea3e
- Teknomo, K. (2006). Application of microscopic pedestrian simulation model. transportation research part F. Transportation Research Part F: Traffic Psychology and Behaviour, 9(1), 15–27. https://doi.org/10.1016/j.trf.2005.08.006
- The Mathworks, I. (2019). MATLAB version 9.6.0.1114505 (R2019a). The Mathworks, Inc.
- Tunstrøm, K., Katz, Y., Ioannou, C. C., Huepe, C., Lutz, M. J., & Couzin, I. D. (2013). Collective states, multistability and transitional behavior in schooling fish. PloS Computational Biology, 9(2), 9(2. https://doi.org/10.1371/journal.pcbi.1002915
- Vicsek, T., Czirók, A., Ben-Jacob, E., Cohen, I., & Shochet, O. (1995). Novel type of phase transition in a system of self-driven particles. Physical Review Letters, 75(6), 1226. https://doi.org/10.1103/PhysRevLett.75.1226
- Vicsek, T., & Zafeiris, A. (2012). Collective motion. Physics Reports, 517(3–4), 71–140. https://doi.org/10.1016/j.physrep.2012.03.004
- Viscido, S. V., Parrish, J. K., & Grünbaum, D. (2004). Individual behavior and emergent properties of fish schools: A comparison of observation and theory. Marine Ecology Progress Series, 273, 239–249. https://doi.org/10.3354/meps273239
- Welch, M., Schaerf, T. M., Murphy, A., & Kryven, I. (2021). Collective states and their transitions in football. Plos One, 16(5), e0251970. https://doi.org/10.1371/journal.pone.0251970
- Wheeler, K. W., Askew, C. D., & Sayers, M. G. (2010). Effective attacking strategies in rugby union. European Journal of Sport Science, 10(4), 237–242. https://doi.org/10.1080/17461391.2010.482595
- Yamamoto, Y. (2009). Scale-free property of the passing behaviour in a team sport. International Journal of Sport and Health Science, 7, 86–95. https://doi.org/10.5432/ijshs.IJSHS20090014