
ABSTRACT
This study investigated the effect of an 8-week neuromuscular electrical stimulation (NMES) training programme (3 days/week) on muscle quantity and quality and single-joint performance in the knee extensors. Thirty-nine untrained young male participants were randomly assigned to NMES training (n = 21) and control (n = 18) groups. The 8-week NMES training induced significant increase in the isometric maximal voluntary contraction (MVC) torque of the knee extensors (≈9.3%), muscle volume of the individual and entire quadriceps muscles determined by magnetic resonance imaging (≈3.3%–6.4%), and a significant decrease in the ultrasound echo intensity of the vastus lateralis (≈−4.0%); however, hypertrophy of the vastus intermedius (i.e., the deep muscle) was limited (≈3.3%). In the NMES training group, the repeated measures correlations of the isometric MVC torque with the muscle volume of the entire quadriceps muscle and each quadriceps muscle were significant (rrm (20) = 0.551–0.776), whereas that of the isometric MVC torque with the ultrasound echo intensity of the vastus lateralis was not significant. These findings suggest that NMES training produces muscle strength gains, muscle hypertrophy, and partial muscle quality improvement and that the NMES training-induced muscle strength gains is caused by muscle hypertrophy in the knee extensors.
Introduction
Neuromuscular electrical stimulation (NMES) training does not require voluntary muscle contraction. Hence, this training method is frequently used for patients with disabilities such as spinal cord injury (Gorgey et al., Citation2016), chronic obstructive pulmonary disease (Veldman et al., Citation2016), and chronic heart failure (Veldman et al., Citation2016) and for patients who have undergone total knee arthroplasty (Stevens-Lapsley et al., Citation2012) or anterior cruciate ligament reconstruction (Labanca et al., Citation2022) to maintain or improve their joint performance and/or body composition. Furthermore, because NMES devices are portable and easy to operate, NMES training is used as a convenient strength training tool for healthy individuals (Gondin et al., Citation2005). According to the latest review (Mukherjee et al., Citation2023) that investigated studies on NMES training for healthy adults published from 2008 to 2020, all the included studies reported that NMES intervention induced significant strength gains in the participants. Thus, it appears that muscle strength gains associated with NMES training can be achieved not only in people with the aforementioned disabilities but also in healthy individuals.
Muscle hypertrophy associated with long-term resistance training contributes to muscle strength gains (Erskine et al., Citation2014), and this is expected to occur with NMES training. However, NMES training-induced muscle hypertrophy has been assessed using muscle thickness and/or cross-sectional area (CSA), and to the best of our knowledge, no evaluation of the effect of NMES on muscle hypertrophy in terms of muscle volume using a pre-test – post-test – control design has been conducted. Since muscle thickness and CSA are determined using a single cross-sectional image, the risk of underestimating/overestimating the degree of muscle hypertrophy is high. Furthermore, muscle volume is a major determinant of maximum isometric joint torque and is a more accurate index of muscle size than muscle thickness and CSA in evaluating muscle strength (Akagi et al., Citation2009). Therefore, determining the muscle volume is essential to clarify the true effect of NMES training on muscle hypertrophy.
One challenge with conventional NMES training is its difficulty in electrically stimulating deep muscles. In a previous study of patients with acute anterior cruciate ligament tears who underwent anterior cruciate ligament surgery (Hasegawa et al., Citation2011), a 4-week NMES training increased the muscle thickness of the rectus femoris (RF) and vastus lateralis (VL) but did not change that of the vastus intermedius (VI), suggesting difficulties in electrically stimulating deep muscles. Regarding the quadriceps femoris (QF), Mazzoli et al. (Citation2018) described that the contribution of the VI to the knee extension mechanism should not be neglected. Ando et al. (Citation2015) reported that the muscle thickness of the VI is a better predictor of maximal knee extensor strength than that of the superficial QF muscles (i.e., the RF, VL, and vastus medialis [VM]). Therefore, if the VI can be sufficiently stimulated and hypertrophied by NMES training, knee extensor strength can be increased more effectively.
Recently, an increasing interest in muscle quality and quantity when examining their relationship with physical performance has been observed. For instance, some muscle quality indices are separately associated with joint-level power-related measures of knee extensors (Hirata et al., Citation2022). When using an ultrasound apparatus, the echo intensity and shear modulus of a muscle are used to evaluate the intramuscular fat content (Akagi et al., Citation2018; Hioki et al., Citation2023) and muscle stiffness (Bernabei et al., Citation2020), respectively, and are considered as one of the muscle quality indices. It has been reported that the lower the muscle echo intensity, the higher the muscle strength (Akagi et al., Citation2018; Bali et al., Citation2020; Mota & Stock, Citation2017; Wilhelm et al., Citation2014; Yoshiko et al., Citation2023) and physical performance (Rech et al., Citation2014; Wilhelm et al., Citation2014). Similarly, muscle shear modulus has been reported to be related to multi-joint (Ando et al., Citation2021; Ema, Citation2023) and sports performances (Miyamoto et al., Citation2019). However, whether stiffer or softer muscles are better for those performances depends on their type. NMES training-induced changes in muscle echo intensity have been previously investigated (Hioki et al., Citation2023). On the other hand, no studies have examined the effect of NMES training on muscle shear modulus. Therefore, clarifying the effect of NMES training on muscle quantity and quality, which can be evaluated using an ultrasound apparatus, is necessary.
This study aimed to investigate the effect of NMES training on muscle quantity and quality and single-joint performance in knee extensors using a newly developed NMES device expected to provide sufficient NMES to deep muscles. We adopted 8 weeks as the training period for muscle hypertrophy based on the views of (Wakahara et al., Citation2019). Furthermore, this study’s hypotheses were as follows: 1) the 8-week NMES training can improve muscle quantity and quality and single-joint performance and 2) the improvements in muscle quantity and quality correlate with that of the single-joint performance.
Materials and methods
Sample size calculation and participants
In this study, two groups were established as follows: the NMES training and control groups. Since this study’s primary outcomes were indices of muscle quantity and quality and single-joint performance in the knee extensors before and after the 8-week intervention (0 and 8 weeks, respectively), an a priori sample size estimation was performed for a two-way repeated measures analysis of variance (ANOVA) using the G*Power software package (version 3.1.9.4; Kiel University, Kiel, Germany) before recruiting participants. The input parameters were as follows: Statistical test = ANOVA: Repeated measures, within-between interaction; Effect size: f = 0.25 (medium) (Cohen, Citation1988); α err prob = 0.05; Power (1 − β err prob) = 0.80; Number of groups = 2 (as described above, the NMES training and control groups); Number of measurements = 2; Corr among rep measures = 0.50; and Nonsphericity correction e = 1. Therefore, the overall sample size was 34. Considering potential dropouts, this study recruited a slightly larger number of participants (39 young male participants) and randomly assigned more participants to the NMES training group (21 young male participants; age: 22 ± 2 years, height: 169.3 ± 5.9 cm, body mass: 59.5 ± 8.6 kg; mean ± standard deviation (SD)) than to the control group (18 young male participants; age: 22 ± 2 years, height: 172.2 ± 5.8 cm, body mass: 61.6 ± 7.9 kg; mean ± SD). No statistically significant group differences were observed in age, height, and body mass (p = 0.137–0.567). None of the participants had a previous or current knee injury and had not undergone lower-body resistance training for at least 6 months. All the 39 participants completed the study. This study was approved by the Ethics Committee of the Shibaura Institute of Technology (No. 22–022) and Nippon Sport Science University (No. 022-H204) and was conducted in accordance with the guidelines outlined in the Declaration of Helsinki. The participants were informed of the study’s purpose and potential risks and provided written informed consent before participation.
Experimental procedures
A schema of the experimental procedures is shown in . At 0 weeks, the participants completed the following three sessions: one to familiarize themselves with joint torque and power measurements, one to measure the muscle size, and one to perform ultrasonic, isometric, and isotonic measurements. After the familiarization session, the session to measure the muscle size was conducted with at least 2 days between sessions. Subsequently, the session to measure other parameters was performed at least 1 day after the muscle size measurement session. At 8 weeks, measurement sessions for muscle size (one day) and other parameters (another day) were held on different days in this order. For the NMES training group, sessions to measure muscle size and other parameters were conducted 2–4 days and 3–6 days after the last training session, respectively. Furthermore, the measurements were only recorded for the right leg.
Figure 1. Schema of the experimental procedures.
In the familiarization session, the participants sat on the reclining seat of a dynamometer (CON-TREX MJ, Physiomed, Schnaittach, Germany) with the hip at 80° flexion (anatomical position = 0°) and performed several isometric maximal voluntary contractions (MVCs) (knee joint angle: 90° flexion [anatomical position = 0°]) and isotonic contractions at maximal effort (resistance: 20% of isometric MVC torque; knee joint angle: 110°–40° flexion) of the knee extensors. In the muscle size measurement session, the volumes of the RF, VL, VI, and VM were determined using a magnetic resonance scanner (Echelon Oval, Hitachi, Ltd., Tokyo, Japan). Therefore, in the session to measure other parameters, the shear modulus and echo intensity of the RF and VL, isometric MVC torque, isotonic peak power, potentiated twitch torque, voluntary activation (VA%), and root mean square values of the surface electromyography signals (RMS-EMGs) of the RF, VL, VM, and biceps femoris (BF) were determined. Strong verbal encouragement was provided to the participants during the isometric and isotonic measurements. Additionally, the torque and angle and surface electromyography (EMG) data were obtained using a dynamometer (CON-TREX MJ, Physiomed) and a standard EMG system (Bagnoli 8 EMG System, DELSYS, USA), respectively. The torque, angle, and EMG data were recorded at a sampling frequency of 2000 Hz on a personal computer using the LabChart software (version 8.1.16, AD Instruments, Australia) after a 16-bit analogue-to-digital conversion (PowerLab16/35, ADInstruments, Australia) to allow synchronization where appropriate. Furthermore, the temperature in the experimental room, where all measurements excluding the muscle size measurements, was maintained at approximately 23°C throughout the measurements; however, that of the experimental room where the muscle size measurements were performed was approximately 21°C.
Intervention
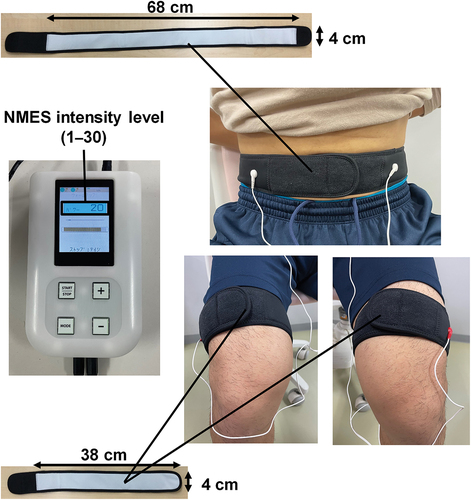
During the 8-week intervention period, all participants were requested to conduct their daily activities and eat as usual. Participants in the control group were asked to refrain from resistance training during the study period, while those in the NMES training group performed the 8-week NMES training for 3 days per week in our laboratory, with at least 24 h of rest between the training sessions. The participants in the NMES training group sat on a chair with their hips and knees at approximately 90° flexion and the ankle at 0° (anatomical position). They wore the three belt electrodes (silver thread electrodes) of an NMES device (Dr. Moritani EMS, Insuretech Industries Inc., Japan) wetted with water around their abdomen (one-belt electrode: approximately 68 cm × 4 cm; distance between the two buttons connecting the NMES device = approximately 54 cm) and near the distal ends of both thighs (two-belt electrodes: approximately 38 cm × 4 cm) (). This method, known as belt electrode skeletal muscle electrical stimulation (Hamada et al., Citation2023; Honda et al., Citation2021; Tomida & Nakae, Citation2020), is considered to induce contractions in larger muscles, including deeper muscles, compared to conventional NMES which uses pad-type electrodes and induces muscle contractions in a limited area between the electrodes on the skin. Furthermore, it is thought that this type of NMES produces less pain during muscle contraction exercises due to the dispersed distribution of electricity (Honda et al., Citation2021). The NMES device used in the present study is also planned to allow for strong contractions of the inner muscles by delivering electrical impulses that simulate motor unit recruitment and rate-coding patterns observed during MVCs through the belt electrodes with a contact area dozens of times larger than that of a conventional stimulating electrode (PAT.P). The NMES training comprises a 2-min warm-up, 9-min main training programmes containing five different NMES programmes with varying stimulation pulse frequencies (12–60 Hz) and pulse widths (10–300 μs), and 2-min cooling down. The stimulation pulse frequencies and pulse widths of this device are designed to increase or decrease simultaneously. Unlike conventional NMES devices that use alternating positive and negative rectangular waves (Nishikawa et al., Citation2023), this device is made to have an independent circuit design that can output positive and negative rectangular waves simultaneously. In other words, this NMES device is designed to deliver highly effective neuromuscular stimulation, even at low stimulation voltages, by simultaneously applying current in both anterograde and retrograde directions, effectively doubling the potential difference. The NMES intensity, which could be adjusted in 30 steps (up to 100 mA in 3.3 mA increments) and was displayed numerically in 30 steps on the NMES device, was set to the maximum intensity that each participant could reportedly tolerate, and this was adjusted daily. During the training session, we recorded the values of these 30 steps on a measurement form. The participants were instructed to maintain the aforementioned sitting posture as much as possible and to avoid unnecessary muscle contractions. All participants in the NMES training group completed the 8-week NMES training without dropping out.
Figure 2. Description of a neuromuscular electrical stimulation device.
Positions for the ultrasonic measurements and EMG activities
The thigh length of the participants from the greater trochanter to the popliteal crease was first measured using a steel tape in 0.5 cm increments while they were standing upright to determine the measurement positions for the muscle shear modulus, echo intensity, and EMG activities. Following our previous study (Akagi et al., Citation2022), marks were placed at the distal 20% (for VM EMG activity), 50% (for RF and BF EMG activities and VL shear modulus and echo intensity), and 70% (for VL EMG activity and RF shear modulus and echo intensity) of the thigh length.
The participants were then placed on a bed in the prone position. The centre of the width in the mediolateral direction and fascicle longitudinal direction of the BF at the distal 50% of the thigh length was confirmed using an ultrasound apparatus (ACUSON S3000, Siemens Medical Solutions) coupled with a 45-mm linear transducer array (9L4 Transducer, 4–9 MHz, Siemens Medical Solutions), to which a water-soluble transmission gel was attached. A pre-amplified bipolar active surface EMG electrode (electrode shape: parallel bar, size: 1 mm width × 10 mm length, and inter-electrode distance: 10 mm; DE-2.1, DELSYS, USA) with band-pass filtering between 20 and 450 Hz was placed at the abovementioned location after preparing the skin by shaving, abrasion with sandpaper, and cleaning with alcohol.
Subsequently, the participants sat on a reclining seat of the dynamometer (CON-TREX MJ, Physiomed, Schnaittach, Germany) with the hip at 80° and the knee at 90° flexion. The pelvis and torso were secured to the reclining seat and dynamometer with nonelastic straps and/or a seatbelt. Care was taken to adjust the centres of rotation of the knee joint and dynamometer. An ankle adapter attached to the lever arm was also positioned slightly proximal to the lateral malleolus using a nonelastic strap. The participants’ postures were as described above in all measurements, excluding the isotonic measurements. To determine the measurement sites of the muscle shear modulus and echo intensity, the centres of the widths in the mediolateral direction of the RF and VL were confirmed at the distal 70% and 50% of the thigh length, respectively, using the ultrasound apparatus. Similarly, the centres of the widths in the mediolateral direction and fascicle longitudinal directions of the RF, VL, and VM were confirmed at the distal 50%, 70%, and 20% of the thigh length, respectively, to identify the locations of the EMG electrode attachment. Finally, the pre-amplified bipolar active surface EMG electrodes for the RF, VL, and VM were placed at each of the sites described above to coincide with the fascicle longitudinal directions, and a reference electrode was placed over the left lateral malleolus.
Ultrasonic measurements
Regarding RF and VL, the muscle shear modulus and echo intensity were measured using longitudinal shear wave elastography and transverse B-mode ultrasound images, respectively, obtained using the ultrasound apparatus. An examiner gently placed the linear transducer array longitudinally (for muscle shear modulus) or transversely (for echo intensity) at the abovementioned sites using a water-soluble transmission gel until the required ultrasound images were obtained to avoid exerting pressure on the target muscle. Next, the ultrasound system was optimized to visualize the muscles and tendons with appropriate penetration, while the bars for adjusting the brightness at each depth were aligned to the far right. The imaging mode used for the study was tissue harmonic imaging with a 7 MHz receiving frequency, and the imaging gain and dynamic range were set at 0 dB and 70 dB to ensure the smooth visualization of the muscles. During the measurement, the examiner was careful not to apply pressure on the target muscle to avoid influencing the values of muscle shear moduli and echo intensity. Regarding the muscle shear modulus, the examiner obtained an elastography image on a scale from blue (soft) to red (hard), depending on the magnitude of the shear wave propagation speed. Before storage, the elastography images were investigated to assess whether the shear wave was sufficient to yield accurate measurements using the ultrasound apparatus, which displayed colour-coded images on a scale from green (good) to orange (bad). We considered the image quality to be acceptable if yellow-to-orange pixels occupied ≤ 20% area of a colour-coded image within the region of interest (ROI) of a colour map. The measurements were repeated until three elastographic images of each muscle were of sufficient quality. Furthermore, three transverse B-mode ultrasound images of each muscle were obtained for each participant for the echo intensity. Finally, all obtained images were transferred from the ultrasound apparatus to a personal computer in the DICOM format.
The method for analyzing the elastographic image followed that described in our previous study (Akagi et al., Citation2022). The ROI on each colour map was made as large as possible while excluding non-target tissues (for example, subcutaneous adipose tissues, aponeuroses, and non-target muscles, among others) using an image processing software (ImageJ 1.52a, National Institutes of Health, Bethesda, USA). Additionally, the average value of the shear wave propagation speed over the ROI was computed for each image using an analysis software written in MATLAB (MATLAB R2018a, MathWorks; Hirata et al., Citation2020). The coefficient of variation (CV) and intraclass correlation coefficient for case 1,3 (ICC(1,3)) for the measured values of shear wave propagation speed were calculated to assess the examiner’s accuracy. The CV and ICC(1,3) for the three values (39 participants × 2-time points [0 and 8 weeks]) were 2.9% ± 2.2% and 0.964 (p < 0.001) for the RF and 2.4% ± 1.4% and 0.973 (p < 0.001) for the VL, respectively. For each RF and VL, the product of the square of the average value of the shear wave propagation speed in the three images and muscle density was calculated as the muscle shear modulus (Nordez & Hug, Citation2010). In this study, the muscle density was assumed as 1,084 kg/m3 based on a previous study (Ward & Lieber, Citation2005).
The echo intensity was evaluated once per image in a computer-assisted 8-bit greyscale analysis using the standard histogram function in the ImageJ software (version 1.52a, National Institutes of Health, Bethesda, USA). An ROI as large as possible, excluding the surrounding fascia, was selected for each muscle (Akagi et al., Citation2018; Caresio et al., Citation2015). The mean echo intensity of the regions was expressed as a value between 0 (black) and 255 (white), and the mean values of the three measurements were used for further analyses. In this study, the CV and ICC(1,3) for the three values (39 participants × 2-time points [0 and 8 weeks]) were 0.3% ± 0.2% and 1.000 (p < 0.001) for the RF and 0.4% ± 0.3% and 0.999 (p < 0.001) for the VL, respectively.
Before starting the measurement at 0 weeks, the day-to-day repeatability of the ultrasonic measurements was evaluated in eight young male participants using the CV of the values for each of the 2 days. The CVs for the muscle shear modulus were 5.4% ± 7.5% and 5.3% ± 2.9% for the RF and VL, respectively, whereas those for the echo intensity were 4.8% ± 7.0% and 2.9% ± 1.8% for the RF and VL, respectively.
Isometric measurements
The isometric measurement methods used in the present study were in accordance with those described in our previous study (Akagi et al., Citation2022).
QF twitch responses were obtained using a constant-current variable-voltage stimulator (DS7AH, Digitimer Ltd., Welwyn Garden City, UK) with a controller (SEN-3401, Nihon Kohden, Tokyo, Japan) before the isometric and isotonic measurements. A cathode (2 × 2 cm) and anode (4 × 5 cm) were placed in the femoral triangle and midway between the superior aspect of the greater trochanter and inferior border of the iliac crest, respectively, to percutaneously stimulate the femoral nerve with rectangular pulse widths of 200 μs. The stimulus intensity was gradually increased (in 10-mA increments from 20 mA) until a plateau in the twitch torque was attained, and supramaximal stimulus intensity was set at the electrical current calculated by multiplying the stimulus intensity by 1.4 (303 ± 111 mA and 312 ± 102 mA at 0 and 8 weeks, respectively). Resting-evoked twitch responses were obtained two times every 10 s to determine the twitch torque of the knee extensors and the peak-to-peak compound muscle action potential amplitude (Mmax) of the RF, VL, and VM. Higher values of the twitch torque and Mmax of each muscle were used for further analysis.
After performing warm-up procedures, which comprise submaximal contractions, the peak torque during the 3-s isometric MVC of the knee extensors was determined two times with a 1-min interval. If the difference between the two peak torque values was > 10% of the higher torque, additional contractions were performed until the difference between the highest and second-highest values was ˂10% of the highest value; 1 min of rest was allowed between contractions. When determining the peak torque during the isometric MVC of the knee extensors, two supramaximal twitch stimulations were interpolated approximately 2 and 3 s after the beginning and end of the MVC, respectively, to determine the potentiated twitch torque and VA% (= [1 − (superimposed twitch torque/potentiated resting twitch torque)] × 100). Additionally, the RMS-EMGs of the RF, VL, VM, and BF during the isometric MVC of the knee extensors were evaluated over a 0.5-s period around the peak torque. The highest peak torque value was determined as the isometric MVC torque, and the potentiated twitch torque, VA%, and RMS-EMG values of the RF, VL, VM, and BF in the task with the highest peak torque were used for further analysis. The RMS-EMG values of the RF, VL, and VM were normalized using the Mmax of the RF, VL, and VM, respectively. Moreover, isometric MVC of the knee flexors was performed two times with a 1-min interval, and the RMS-EMG of the BF determined over a 0.5-s period around the peak torque in the task with the highest value of isometric MVC torque of the knee flexors was used to normalize the RMS-EMG of the BF during MVC of the knee extensors. The torque data were low-pass filtered at 500 Hz when the isometric MVC torque, the potentiated twitch torque, and VA% were analyzed offline.
Isotonic measurements
Similar to the isometric measurements, the isotonic measurement methods were in accordance with those described in our previous study (Akagi et al., Citation2022).
Maximal-effort isotonic contractions of the knee extensors with a resistance set to 20% of the isometric MVC torque at 0 weeks were performed three times every 3–4 s from a knee joint angle of 110° to 40°. Immediately the lever arm with the ankle adapter reached the end of the range of motion (i.e., a knee joint angle of 40°), it automatically returned to its initial position (i.e., a knee joint angle of 110°) for 1 s while the participants were fully relaxed. The highest value of the three peak power measurements was used for further analysis. As previously reported (Akagi et al., Citation2022), a dynamometer (CON-TREX MJ; Physiomed) generated an additional breaking force as the lever arm approached the end of the range of motion, which could result in torque and power spikes. Therefore, the power of the first peak was evaluated. The RMS-EMGs of the RF, VL, VM, and BF, which were assessed over a time interval of 0–100 ms from the onset of movement of the lever arm in the task with the highest peak power, were normalized with a similar method used under isometric conditions. Furthermore, when analyzing the isotonic peak power offline, the torque and angular velocity data were low-pass filtered at 20 Hz.
Muscle size measurements
A series of transverse images of the relaxed right thigh were obtained using a 1.5-T whole-body magnetic resonance imaging scanner (Echelon Oval, Hitachi, Ltd., Tokyo, Japan) with a T1-weighted spin-echo sequence (repetition time: 520 ms; echo time, 8.0 ms; slice thickness: 5 mm; and interspaced distance: 0 mm). Imaging was performed with a field of view of 256 × 256 mm and a matrix size of 512 × 512. Within the device, the participants lay in the supine position with torso and spine coils placed on the posterior and anterior parts of their right thigh, respectively. Care was taken to avoid deforming the muscles using a handmade device composed of polystyrene foam. The outlines of the RF, VL, VM, and VI were digitized from the scanned images, and each CSA was measured once by a highly trained analyst using a personal computer with an image analysis software package (sliceOmatic ver 5.0 Rev-2d, TomoVision, Canada). Non-contractile tissue was excluded because it was imaged at tones differing from those of the contractile tissue. Each muscle volume was automatically calculated by multiplying the sum of the CSA of each muscle group along its length by an interval of 5 mm using an image analysis software package. Additionally, the muscle volume of the QF was calculated as the sum of the muscle volumes of the RF, VL, VI, and VM.
Habitual physical activity measurements
The participants were instructed to wear a device (Active style Pro HJA-750C, Omron Health Care, Kyoto, Japan) to assess their habitual physical activity while performing activities of daily living for 11 days during the intervention period, excluding the time spent bathing or sleeping. The data from the days when the participants wore the device for >500 min/day, which were recorded in a diary, were used for the analysis. The analysis period (4–11 days) met the criteria used in a previous study (Watanabe et al., Citation2020). Furthermore, the mean magnitude of physical activity was determined per day at three levels as follows: light (<3.0 metabolic equivalents), moderate (3.0–5.9 metabolic equivalents), and vigorous (≥6.0 metabolic equivalents) intensity levels (Lyden et al., Citation2011).
Statistical analyses
First, the normality of the data in each group at 0 and 8 weeks was assessed using the Shapiro – Wilk test. Therefore, the normality of the data for the VA%, normalized RMS-EMG of each muscle during isometric and isotonic measurements, muscle volume of the QF, muscle shear modulus and echo intensity of the RF, and magnitudes of physical activity for light and vigorous intensity levels were not confirmed for any of the combinations (time × group). Considering the experimental design, the data of these parameters were log-transformed before conducting the following statistical analyses, except for calculating the repeated measures correlation.
Regarding the isometric MVC torque; isotonic peak power; twitch torque; VA%; muscle volumes of the RF, VL, VI, VM, and QF; echo intensity and shear modulus of the RF and VL; and normalized RMS-EMG of the RF, VL, VM, and BF during isometric and isotonic contractions, a two-way ANOVA with one within-group (time [0 and 8 weeks]) and one between-group (group [NMES training and control groups]) factors was used. When a significant interaction was observed, an additional ANOVA was conducted to examine simple main effects. Considering the experimental design, we interpreted the presence of an NMES training effect for parameters with the significant time × group interaction and with no significant difference at 0 weeks between the groups. In this case, an effect size index for the pre-test – post-test – control design (dppc) was calculated following a previous study (Morris, Citation2008). If the NMES training-induced change in isometric MVC torque and/or isotonic peak power was significant, the repeated measures correlation was calculated using a web and standalone application for repeated measures correlation (rmcorrShiny) (Marusich & Bakdash, Citation2021) to examine the overall within-individual relationship with the other parameters that were significantly changed by the NMES training. Additionally, if the muscle volume in ≥ 3 of the RF, VL, VI, and VM significantly increased with NMES training, a one-way ANOVA with one within-group factor (muscle) was performed to investigate inter-muscle differences in the percentage increase from 0 to 8 weeks. When the main effect of muscle was significant, the Bonferroni multiple-comparison test was conducted so that the statistical analysis software described below would automatically calculate a P-value adjusted for the number of combinations. To confirm the similarity in the magnitude of physical activity between the groups, a two-way ANOVA with one within-group (level [light, moderate, and vigorous]) and one between-group (group [NMES and control groups]) factor was used.
Furthermore, for ease of interpretation, data in the text and figures are presented as means ± SDs of raw data, with or without log transformation. Statistical significance was set at p < 0.05. When a one-way or two-way ANOVA was performed, η2 is listed with the interaction and main effect results as the effect size. All statistical analyses were performed using statistical analysis software (SPSS 25.0, IBM, USA) and a spreadsheet (Excel 2016, Microsoft, USA). The dppc or η2 value was interpreted as dppc <0.200 or η2 <0.010 for trivial, 0.200 ≤ dppc <0.500 or 0.010 ≤ η2 <0.060 for small, 0.500 ≤ dppc <0.800 or 0.060 ≤ η2 <0.140 for medium, and dppc ≥0.800 or η2 ≥0.140 for large effects (Cohen, Citation1988).
Results
Isometric measurements
The means and SDs and the values of F, P, and η2 for the parameters related to isometric measurements are summarized in .
Table 1. Means and standard deviations and values of F, P, and η2 for the parameters related to isometric measurements.
shows the isometric MVC torque at 0 and 8 weeks in the NMES training and control groups. A significant time × group interaction was observed (p = 0.010). Additionally, the simple main effect of time was significant in the NMES training group (0 < 8 weeks; p < 0.001) but not in the control group. No simple main effect of group was found at both 0 and 8 weeks. The dppc was 0.377 (small).
Figure 3. Isometric maximal voluntary contraction (MVC) torque (a), twitch torque (b), and voluntary activation (VA%) (c) of the knee extensors before (0 weeks) and after (8 weeks) the 8-week intervention in the neuromuscular electrical stimulation (NMES) training (n = 21) and control (n = 18) groups.
Regarding the twitch torque (), a time × group interaction and main effects of time and group were not significant. Similarly, no significant time × group interaction and main effects of time and group were found for the VA% ().
Furthermore, regarding the normalized RMS-EMG, no significant time × group interaction and main effects of time and group were found in the RF (), VL (), and BF (). However, for the normalized RMS-EMG of the VM (), a significant main effect of time (0 < 8 weeks; p = 0.008) was observed without a significant time × group interaction or main effect of group.
Figure 4. Root mean square value of surface electromyography signal (RMS-EMG) of the rectus femoris (RF) (a), vastus lateralis (VL) (b) and medialis (VM) (c), and biceps femoris (BF) (d) under isometric conditions before (0 weeks) and after (8 weeks) the 8-week intervention in the neuromuscular electrical stimulation (NMES) training (n = 21) and control (n = 18) groups.
Isotonic measurements
The means and SDs and the values of F, P, and η2 for the parameters related to isotonic measurements are summarized in .
Table 2. Means and standard deviations and values of F, P, and η2 for the parameters related to isotonic measurements.
shows the isotonic peak power at 0 and 8 weeks in the NMES training and control groups. No significant time × group interaction and main effects of time and group were found.
Figure 5. Isotonic peak power of the knee extensors before (0 weeks) and after (8 weeks) the 8-week intervention in the neuromuscular electrical stimulation (NMES) training (n = 21) and control (n = 18) groups.
The normalized RMS-EMG of each muscle is shown in . Regarding the RF (), VL (), and BF (), no significant time × group interaction and main effects of time and group were found. However, for the VM (), a main effect of time (0 < 8 weeks; p = 0.029) was significant, but the time × group interaction and main effect of group were not significant.
Figure 6. Root mean square value of surface electromyography signal (RMS-EMG) of the rectus femoris (RF) (a), vastus lateralis (VL) (b) and medialis (VM) (c), and biceps femoris (BF) (d) under isotonic conditions before (0 weeks) and after (8 weeks) the 8-week intervention in the neuromuscular electrical stimulation (NMES) training (n = 21) and control (n = 18) groups.
Muscle volume
The means and SDs and the values of F, P, and η2 for the muscle volume of the RF, VL, VI, VM, and QF are summarized in .
Table 3. Means and standard deviations and values of F, P, and η2 for the muscle volume of the rectus femoris, vastus lateralis, vastus intermedius, vastus medialis, and quadriceps femoris.
presents the muscle volume at 0 and 8 weeks in the NMES training and control groups. For all muscles, a significant time × group interaction was found (p ≤0.004), and a simple main effect of time was significant in the NMES training group (0 < 8 weeks; p < 0.001), but not in the control group. A simple main effect of group was not significant at both 0 and 8 weeks. The values of dppc for the RF, VL, VI, VM, and QF were 0.219 (small), 0.421 (small), 0.167 (trivial), 0.264 (small), and 0.293 (small), respectively.
Figure 7. Muscle volume of the rectus femoris (RF) (a); vastus lateralis (VL) (b), intermedius (VI) (c), and medialis (VM) (d); and quadriceps femoris (QF) (e) before (0 weeks) and after (8 weeks) the 8-week intervention in the neuromuscular electrical stimulation (NMES) training (n = 21) and control (n = 18) groups.
For the percentage increases in the muscle volume of the RF (4.3% ± 3.3%), VL (6.4% ± 3.3%), VI (3.3% ± 3.5%), and VM (5.2% ± 3.2%) from 0 to 8 weeks in the NMES training group, a main effect of muscle was significant (F[2.497,49.934] = 3.696, p = 0.024, η2 = 0.156 [large]); however, the Bonferroni multiple comparison test applied to the six combinations did not reveal any significant differences in the percentage increase between specific muscles (adjusted p = 0.066–1.000). Specifically, the corresponding percentage increase in the muscle volume of the QF was 4.9% ± 2.0%.
Ultrasonic measurements
The means and SDs and the values of F, P, and η2 for the parameters related to ultrasonic measurements are summarized in .
Table 4. Means and standard deviations and values of F, P, and η2 for the parameters related to ultrasonic measurements.
For the muscle stiffness of the RF () and VL (), no significant time × group interaction and a main effect of group were found; however, a significant main effect of time was observed (0 < 8 weeks; p = 0.001).
Figure 8. Shear modulus of the rectus femoris (RF) (a) and vastus lateralis (VL) (b) and echo intensity of the RF (c) and VL (d) before (0 weeks) and after (8 weeks) the 8-week intervention in the neuromuscular electrical stimulation (NMES) training (n = 21) and control (n = 18) groups.
No significant time × group interaction or main effects of time and group was found for the RF () regarding echo intensity. In contrast, a significant time × group interaction (p = 0.004) was observed for the VL (). Additionally, the simple main effect of time was significant in the NMES training group (0 < 8 weeks; p = 0.025) but not in the control group. No significant simple main effect of group was found both at 0 and 8 weeks. The dppc was 0.703 (medium).
Repeated measures correlations of isometric MVC torque with other parameters
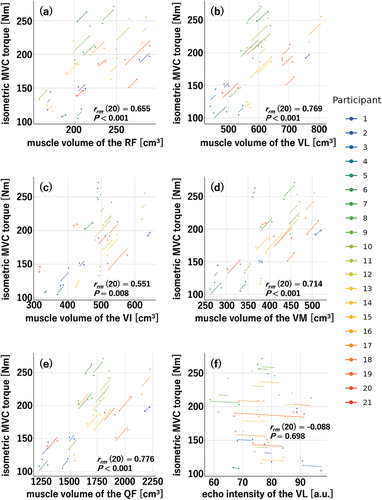
Significant effects of NMES training were found on isometric MVC torque; muscle volume of the RF, VL, VI, VM, and QF; and echo intensity of the VL. Therefore, the repeated measures correlations of the isometric MVC torque with the RF, VL, VI, VM, and QF muscle volumes and the echo intensity of the VL were calculated (). The repeated measures correlations between the isometric MVC torque and each muscle volume were significant (RF: rrm (20) = 0.655, p < 0.001; VL: rrm (20) = 0.769, p < 0.001; VI: rrm (20) = 0.551, p = 0.008; VM: rrm (20) = 0.714, p < 0.001; QF: rrm (20) = 0.776, p < 0.001), whereas no significant repeated measures correlation was found between the isometric MVC torque and echo intensity of the VL (rrm (20) = −0.088, p = 0.698).
Figure 9. Repeated measures correlations of isometric maximal voluntary contraction (MVC) torque with muscle volume of the rectus femoris (RF) (a); vastus lateralis (VL) (b), intermedius (VI) (c), and medialis (VM) (d); and quadriceps femoris (QF) (e) and echo intensity of the VL (f) in the neuromuscular electrical stimulation (NMES) training group (n = 21).
Habitual physical activity
Among the 39 participants, data from two who did not meet the criteria described in the “Materials and Methods” section were excluded from the analysis. The magnitudes of physical activity in the NMES training group (n = 20) were 402 ± 130 min/day, 67 ± 30 min/day, and 2 ± 1 min/day for light, moderate, and vigorous intensity levels, respectively. The magnitudes of physical activity in the control group (n = 17) were 370 ± 132 min/day, 64 ± 21 min/day, and 2 ± 2 min/day for light, moderate and vigorous intensity levels, respectively. The level × group interaction (F[2,70] = 0.166, p = 0.847, η2 <0.001 [trivial]) and a main effect of group (F[1,35] = 0.686, p = 0.413, η2 = 0.019 [small]) were not significant. Therefore, these results confirm the similarity in the magnitude of physical activity between the groups.
Discussion
This study’s main findings are as follows: 1) an 8-week NMES training programme increased the isometric MVC torque and muscle volume and partly decreased the muscle echo intensity and 2) the repeated measures correlations of isometric MVC torque with muscle volume were significant for knee extensors. These results suggest that the NMES training-induced improvement in single-joint performance evaluated under isometric conditions was caused by muscle hypertrophy, partly supporting this study’s hypotheses.
The isometric MVC torque was improved by the 8-week NMES training programme () with a small effect size (dppc = 0.377). Here, we would like to compare the effect size of the present study on muscle strength gains with those of previous studies. A brief review article (Mukherjee et al., Citation2023) described that the all 10 previous studies included in the systematic review reported significant muscle strength gains as an outcome of the NMES treatment. Of the 10 previous studies, two measured isometric MVC torque, used NMES training alone for 4 (Lategan et al., Citation2014) or 12 (Son et al., Citation2014) weeks, and provided detailed muscle strength data. Therefore, we calculated the values of dppc using these data to be 0.309 (small) and 0.901 (large) for Lategan et al. (Lategan et al., Citation2014) and Son et al (Son et al., Citation2014), respectively. Since the value of dppc (0.377) and length of the training period (8 weeks) were between those of the previous studies and no training effect on twitch torque was observed () in this study, additional training effects on isometric MVC torque can be expected with a further continuation of the NMES training employed in this study. However, the differences between NMES and voluntary resistance training should also be considered based on their effects on isometric MVC torque. Rahmati et al. (Rahmati et al., Citation2021) described that this effect appeared to be lower for NMES training than for voluntary resistance training. A previous study (Sterczala et al., Citation2020) where four lower-body exercises, including complex multi-joint movements and single-joint isolation exercises, were performed at a similar training period (8 weeks) and frequency (3 days per week) identical to that in this study calculated the dppc for the improvement of the isometric MVC torque of the knee extensors to be 0.691 (medium). Furthermore, although the training period was shorter (4 weeks) with the same number of training days per week (3 days) in our previous study (Ema et al., Citation2018), the corresponding dppc exceeded 1 (1.134; large) when training using the same movement as the isometric MVC torque measurement. NMES and voluntary muscle contraction constitute different modes of muscle activation, and the long-term application of each mode can induce different muscle adaptations (Paillard, Citation2008). Therefore, the trade-off between the simplicity of NMES training without voluntary contraction and its muscle-strengthening effects should be noted.
The 8-week NMES training programme induced hypertrophy in all muscles, including the VI, which is the only deep muscle in the QF (). This supports the effectiveness of the NMES device used in this study. Many studies have evaluated NMES training-associated muscle hypertrophy using muscle CSA (Gondin et al., Citation2005, Citation2006) and/or thickness (Hasegawa et al., Citation2011). However, these studies only assessed the CSAs of the muscles, and there is a real risk of overestimating/underestimating muscle hypertrophy. To the best of our knowledge, this is the first study to investigate the effect of NMES training on hypertrophy determined by muscle volume using a pre-test – post-test – control design. Specifically, this study is the first step towards properly evaluating the effects of NMES training on muscle hypertrophy. On the other hand, more attention may need to be paid to the presence or absence of inter-muscle differences in the effects of NMES training on muscle hypertrophy in the QF. Although no clear difference was found in the percentage increase in muscle volume from 0 to 8 weeks in the NMES training group between the VI and other muscles, a significant main effect of muscle on the corresponding percentage increase was found, and the dppc for the muscle volume of the VI (0.167) was interpreted as trivial. Based on these results, the stimulation of deep muscles (i.e., the VI) may have been weaker than that of superficial muscles (i.e., the RF, VL, and VM). In other words, it is possible that the NMES device used in this study did not stimulate the VI as much as anticipated. However, given that a significant difference in the effect size of muscle strength gains was observed between the 8-week (the present study) and 12-week (Son et al., Citation2014) NMES training, and that statistically significant muscle hypertrophy of the VI occurred, the shorter duration of the NMES training intervention in the present study could have influenced the muscle volume of the VI. As the training of the VI to effectively improve knee extensor strength is important, future studies will be needed to determine whether hypertrophy of the VI occurs as expected with a longer NMES training period than that in the present study. Regarding the effect of NMES training on the hypertrophy of the superficial muscles, the dppc values for the RF (0.219), VL (0.421), and VM (0.264) were also smaller than those of squat training for the same 8-week period (RF: 0.28, VL: 0.64, and VM: 0.64) (Akagi et al., Citation2020). Thus, the simplicity of NMES training without voluntary contraction must have limited the training effect on muscle hypertrophy as well as on muscle strength gains as described in the previous paragraph.
The repeated measures correlations of the isometric MVC torque of the knee extensors with the muscle volume of each muscle and the QF were all significant () without neuromuscular adaptation evaluated under isometric conditions (). These results suggest that the muscle hypertrophy achieved in the knee extensors is responsible for the NMES training-induced increase in isometric MVC torque. This hypothesis is logical as muscle volume is a major determinant of isometric MVC torque in the knee extensors (Akagi et al., Citation2009). However, it was difficult to determine why neuromuscular adaptations were not observed in this study. Generally, neuromuscular adaptations occur after a short NMES training period (4–5 weeks) (Gondin et al., Citation2006; Maffiuletti et al., Citation2002; Vitry et al., Citation2019). In this study, measurements were not performed midway through the 8-week training period; however, it is unlikely that neuromuscular adaptations disappeared by the end of the 8-week training period. Certainly, studies (Gondin et al., Citation2005; Maffiuletti et al., Citation2002) where neuromuscular adaptations were evaluated using RMS-EMG/Mmax before and after NMES training are available, and the RMS-EMG/Mmax of one or more of the synergistic muscles did not change. Therefore, this study may be a similar case.
In contrast to the isometric MVC torque, the 8-week NMES training did not change the isotonic peak power () without neuromuscular adaptation of each muscle (). During NMES, large fast-twitch motor units are activated before slow-twitch motor units, suggesting the “reversed size principle” of motor unit recruitment by NMES (Moritani, Citation2021). Given this suggestion, it is natural to assume that isotonic peak power also improves with NMES training. Nevertheless, a discrepancy was found between the effects of NMES training on isotonic peak power and isometric MVC torque, which could be attributed to training specificity. Moreover, the NMES training used in this study did not induce a significant change in the knee joint angle and probably did not cause an increase in joint angular velocity and, consequently, isotonic peak power. Paillard (Paillard, Citation2008) reported that NMES and voluntary muscle contraction constitute different modes of muscle activation and induce different acute physiological effects on the neuromuscular system and that the combination of NMES and voluntary muscle contraction probably mask training specificity. Isotonic contractions, where the load remains constant, but the velocity can vary, are considered more relevant to normal voluntary activity than isokinetic and isometric contractions. Therefore, a future challenge is to combine NMES training with voluntary resistance training to increase isotonic peak power.
Regarding the indices of muscle quality obtained from the ultrasonic measurements, the effect of NMES training was observed only for the echo intensity of the VL (). In a previous study of 15 weeks of resistance training of the QF (Santos et al., Citation2018), the echo intensity of the VL at 39% of the distance between the upper edge of the patella (0%) and the anterior superior iliac spine (100%) decreased after 6 weeks. Meanwhile that of the VL at 56% and that of the RF at 22% of the corresponding distance showed no change after 15 weeks. Considering that the measurement site for the echo intensity of the VL in the present study (50%) was located between the measurement sites (39% and 56%) in the abovementioned previous study, the present results are generally consistent with that of the previous study (Santos et al., Citation2018). In other words, even if the NMES training intervention period had been longer, the echo intensity of the RF would not have changed. A review study on muscle echo intensity (Stock & Thompson, Citation2021) did not reach a consensus regarding changes in muscle echo intensity due to chronic resistance training. Hence, it is also unclear why muscle echo intensity changes with resistance training. Santos et al. (Santos et al., Citation2018) suggested that the difference in training effects on the echo intensity of the VL and RF may be attributed to the different anatomical features of the two muscles, but it is currently difficult to provide a clear explanation in this regard. It has been found that muscle echo intensity negatively correlates with isometric MVC torque not only in older individuals but also in young individuals (Akagi et al., Citation2018; Mota & Stock, Citation2017; Yoshiko et al., Citation2023). However, no significant repeated measures correlation was found between isometric MVC torque and echo intensity of the VL in this study (). Therefore, these results suggest that the muscle echo intensity improvement did not influence the isometric MVC torque. On the other hand, the effect of NMES training on muscle shear modulus was not observed in this study (). A meta-analysis in a systematic review (Dankel & Razzano, Citation2020) revealed no effect of long-term resistance training on changes in muscle shear modulus, and the included studies’ results are consistent with our findings. Previous studies (Bali et al., Citation2020; Mota & Stock, Citation2017; Wilhelm et al., Citation2014) have reported that muscle shear modulus positively correlates with dynamic explosive performance requiring high-velocity muscle contraction. Therefore, considering the abovementioned findings, it should be noted that no NMES training-induced changes were observed in either isotonic peak power or muscle shear modulus.
In the present study, muscle strength gains, muscle hypertrophy, and muscle quality improvement of the knee extensors were achieved through NMES training using a newly developed NMES device expected to provide sufficient NMES to deep muscles, even in healthy people. This suggests that NMES training would be more effective for people who use their QF less frequently or are unable to move them voluntarily due to knee disability. In other words, the NMES device used in this experiment is expected to be a very useful rehabilitation/training tool, especially for people with knee disorders. We intend to demonstrate the effectiveness of the NMES device through actual training intervention for such people in the future.
This study had some limitations. First, individual differences in the effects of NMES training may have depended on those in pain tolerance to NMES and/or habitual physical activity. To investigate this possibility, we calculated the correlation coefficients of the average NMES intensity (calculated by current value; 83.0 ± 4.9 mA [range: 74.7–94.1 mA]) during the training period and the magnitudes of physical activity with the percentage change in MVC torque before and after training. The results showed no significant correlations of the average intensity level during the training period (r = −0.039, p = 0.867) and the magnitudes of physical activity for light (r = 0.113, p = 0.636), moderate (r = −0.017, p = 0.942), and vigorous (r = −0.197, p = 0.404) intensity levels with the percentage change in MVC torque before and after training. These results suggest that individual differences in pain tolerance to NMES and/or habitual physical activity had little influence on our results. However, it should also be noted here that the present study did not measure joint torque of the knee extensors during NMES. In previous studies (Almeida et al., Citation2019; Snyder-Mackler et al., Citation1994; Stevens-Lapsley et al., Citation2012), the intensity of NMES during the training period was determined by the ratio of the muscle strength induced by NMES to the muscle strength during MVC. This ratio was found to be correlated with the muscle strength gains associated with NMES training for people with disabilities. It is not clear whether the findings obtained for people with disabilities can be directly applied to the present study; however, further research is needed to consider these points. Second, the measured data for each parameter were available only before and after 8 weeks of training. Naturally, it is difficult to determine the timing and degree of change in each parameter during the 8 weeks and to clarify how the NMES training programme induced muscle hypertrophy and strength gains. Finally, ultrasonic measurements were performed at only one site for both the RF and VL. As described earlier, 15 weeks of resistance training for the QF resulted in significant differences in echo intensity changes between measurement sites of the VL, while no significant differences in echo intensity changes were observed between measurement sites of the RF (Santos et al., Citation2018). Thus, the influence of the ultrasound measurement site on the results of the present study should not be ignored. However, ultrasound measurements in the present study should have been performed close to the respective muscle belly of the VL and RF. Therefore, it can be inferred that NMES training-induced changes in muscle quality were somewhat accurately captured in the present study.
In conclusion, this study investigated the effects of an 8-week NMES training programme on muscle quantity and quality and single-joint performance of the knee extensors. The NMES training programme increased isometric MVC torque and muscle volume and partly decreased muscle echo intensity, indicating that single-joint performance under isometric conditions and muscle quantity and quality improved to some extent. The repeated measures correlations of isometric MVC torque with muscle volume were also significant. Therefore, the NMES training-induced improvement in single-joint performance under isometric conditions is suggested to be caused by muscle hypertrophy.
Acknowledgments
This study was partially supported by JSPS KAKENHI Grant Number JP17KK0174 (Fund for the Promotion of Joint International Research, Fostering Joint International Research) (to RA). We would like to thank Dr. Toshio Moritani (president of Osekkai Club Inc., Japan) for lending us an NMES device (Dr. Moritani EMS) and Mr. Taishi Matsui for his assistance with data analysis. Dr. Moritani was not involved in the experimental results or their interpretation. We would like to thank Editage (www.editage.com) for English language editing.
Disclosure statement
No potential conflict of interest was reported by the author(s).
Data availability statement
The data that support the findings of this study are available from the corresponding author upon reasonable request.
Additional information
Funding
References
- Akagi, R., Nomura, Y., Kawashima, C., Ito, M., Oba, K., Tsuchiya, Y., Power, G. A., & Hirata, K. (2022). Trade-off between maximal power output and fatigue resistance of the knee extensors for older men. Journal of Aging and Physical Activity, 30(6), 1003–1013. https://doi.org/10.1123/japa.2021-0384
- Akagi, R., Sato, S., Hirata, N., Imaizumi, N., Tanimoto, H., Ando, R., Ema, R., & Hirata, K. (2020). Eight-week low-intensity squat training at slow speed simultaneously improves knee and hip flexion and extension strength. Frontiers in Physiology, 11, 893. https://doi.org/10.3389/fphys.2020.00893
- Akagi, R., Suzuki, M., Kawaguchi, E., Miyamoto, N., Yamada, Y., & Ema, R. (2018). Muscle size-strength relationship including ultrasonographic echo intensity and voluntary activation level of a muscle group. Archives of Gerontology and Geriatrics, 75, 185–190. https://doi.org/10.1016/j.archger.2017.12.012
- Akagi, R., Takai, Y., Ohta, M., Kanehisa, H., Kawakami, Y., & Fukunaga, T. (2009). Muscle volume compared to cross-sectional area is more appropriate for evaluating muscle strength in young and elderly individuals. Age & Ageing, 38(5), 564–569. https://doi.org/10.1093/ageing/afp122
- Almeida, G. J., Khoja, S. S., & Piva, S. R. (2019). Dose-response relationship between neuromuscular electrical stimulation and muscle function in people with rheumatoid arthritis. Physical Therapy, 99(9), 1167–1176. https://doi.org/10.1093/ptj/pzz079
- Ando, R., Saito, A., Umemura, Y., & Akima, H. (2015). Local architecture of the vastus intermedius is a better predictor of knee extension force than that of the other quadriceps femoris muscle heads. Clinical Physiology and Functional Imaging, 35(5), 376–382. https://doi.org/10.1111/cpf.12173
- Ando, R., Sato, S., Hirata, N., Tanimoto, H., Imaizumi, N., Suzuki, Y., Hirata, K., & Akagi, R. (2021). Relationship between resting medial gastrocnemius stiffness and drop jump performance. Journal of Electromyography and Kinesiology, 58, 102549. https://doi.org/10.1016/j.jelekin.2021.102549
- Bali, A. U., Harmon, K. K., Burton, A. M., Phan, D. C., Mercer, N. E., Lawless, N. W., & Stock, M. S. (2020). Muscle strength, not age, explains unique variance in echo intensity. Experimental Gerontology, 139, 111047. https://doi.org/10.1016/j.exger.2020.111047
- Bernabei, M., Lee, S. S. M., Perreault, E. J., & Sandercock, T. G. (2020). Shear wave velocity is sensitive to changes in muscle stiffness that occur independently from changes in force. Journal of Applied Physiology, 128(1), 8–16. https://doi.org/10.1152/japplphysiol.00112.2019
- Caresio, C., Molinari, F., Emanuel, G., & Minetto, M. A. (2015). Muscle echo intensity: Reliability and conditioning factors. Clinical Physiology and Functional Imaging, 35(5), 393–403. https://doi.org/10.1111/cpf.12175
- Cohen, J. (1988). Statistical power analysis for the behavioral sciences (2nd ed.). Lawrence Erlbaum Associates.
- Dankel, S. J., & Razzano, B. M. (2020). The impact of acute and chronic resistance exercise on muscle stiffness: A systematic review and meta-analysis. Journal of Ultrasound, 23(4), 473–480. https://doi.org/10.1007/s40477-020-00486-3
- Ema, R. (2023). Association between elastography-assessed muscle mechanical properties and high-speed dynamic performance. European Journal of Sport Science, 23(7), 1233–1239. https://doi.org/10.1080/17461391.2022.2097129
- Ema, R., Saito, I., & Akagi, R. (2018). Neuromuscular adaptations induced by adjacent joint training. Scandinavian Journal of Medicine & Science in Sports, 28(3), 947–960. https://doi.org/10.1111/sms.13008
- Erskine, R. M., Fletcher, G., & Folland, J. P. (2014). The contribution of muscle hypertrophy to strength changes following resistance training. European Journal of Applied Physiology, 114(6), 1239–1249. https://doi.org/10.1007/s00421-014-2855-4
- Gondin, J., Guette, M., Ballay, Y., & Martin, A. (2005). Electromyostimulation training effects on neural drive and muscle architecture. Medicine and Science in Sports and Exercise, 37(8), 1291–1299. https://doi.org/10.1249/01.mss.0000175090.49048.41
- Gondin, J., Guette, M., Ballay, Y., & Martin, A. (2006). Neural and muscular changes to detraining after electrostimulation training. European Journal of Applied Physiology, 97(2), 165–173. https://doi.org/10.1007/s00421-006-0159-z
- Gorgey, A. S., Caudill, C., & Khalil, R. E. (2016). Effects of once weekly NMES training on knee extensors fatigue and body composition in a person with spinal cord injury. The Journal of Spinal Cord Medicine, 39(1), 99–102. https://doi.org/10.1179/2045772314Y.0000000293
- Hamada, R., Sato, S., Miyasaka, J., Murao, M., Matsushita, M., Kajimoto, T., Otagaki, A., Asano, T., Nankaku, M., Kondo, T., Arai, Y., Kanda, J., Takaori-Kondo, A., Ikeguchi, R., & Matsuda, S. (2023). Belt electrode-skeletal muscle electrical stimulation during early hematopoietic post-transplantation to prevent skeletal muscle atrophy and weakness. Transplantation and Cellular Therapy, 29(1),.e51.1–.e51.7. https://doi.org/10.1016/j.jtct.2022.09.030
- Hasegawa, S., Kobayashi, M., Arai, R., Tamaki, A., Nakamura, T., & Moritani, T. (2011). Effect of early implementation of electrical muscle stimulation to prevent muscle atrophy and weakness in patients after anterior cruciate ligament reconstruction. Journal of Electromyography and Kinesiology, 21(4), 622–630. https://doi.org/10.1016/j.jelekin.2011.01.005
- Hioki, M., Takahashi, H., Saito, A., Imai, M., & Yasuda, H. (2023). Effect of electromyostimulation training on intramuscular fat accumulation determined by ultrasonography in older adults. European Journal of Applied Physiology, 123(2), 271–282. https://doi.org/10.1007/s00421-022-05074-3
- Hirata, K., Ito, M., Nomura, Y., Kawashima, C., Tsuchiya, Y., Ooba, K., Yoshida, T., Yamada, Y., Power, G. A., Tillin, N. A., & Akagi, R. (2022). Muscle quality indices separately associate with joint-level power-related measures of the knee extensors in older males. European Journal of Applied Physiology, 122(10), 2271–2281. https://doi.org/10.1007/s00421-022-05005-2
- Hirata, K., Yamadera, R., & Akagi, R. (2020). Can static stretching reduce stiffness of the triceps surae in older men? Medicine and Science in Sports and Exercise, 52(3), 673–679. https://doi.org/10.1249/MSS.0000000000002186
- Honda, Y., Tanaka, N., Kajiwara, Y., Kondo, Y., Kataoka, H., Sakamoto, J., Akimoto, R., Nawata, A., Okita, M., & Gomes, A. V. (2021). Effect of belt electrode-skeletal muscle electrical stimulation on immobilization-induced muscle fibrosis. PLOS ONE, 16(5), e0244120. https://doi.org/10.1371/journal.pone.0244120
- Labanca, L., Rocchi, J. E., Giannini, S., Faloni, E. R., Montanari, G., Mariani, P. P., & Macaluso, A. (2022). Early superimposed NMES training is effective to improve strength and function following ACL reconstruction with hamstring graft regardless of tendon regeneration. Journal of Sports Science and Medicine, 21, 91–103. https://doi.org/10.52082/jssm.2022.91
- Lategan, L., Crafford, K., Suliman, F., & Govender, N. (2014). Electrical muscle stimulation (EMS) training of the hamstrings. African Journal for Physical Health Education, Recreation and Dance, 20(21), 439–452. https://hdl.handle.net/10520/EJC155181
- Lyden, K., Kozey, S. L., Staudenmeyer, J. W., & Freedson, P. S. (2011). A comprehensive evaluation of commonly used accelerometer energy expenditure and MET prediction equations. European Journal of Applied Physiology, 111(2), 187–201. https://doi.org/10.1007/s00421-010-1639-8
- Maffiuletti, N. A., Pensini, M., & Martin, A. (2002). Activation of human plantar flexor muscles increases after electromyostimulation training. Journal of Applied Physiology, 92(4), 1383–1392. https://doi.org/10.1152/japplphysiol.00884.2001
- Marusich, L. R., & Bakdash, J. Z. (2021). rmcorrShiny: A web and standalone application for repeated measures correlation. F1000 Research, 10, 697. https://doi.org/10.12688/f1000research.55027.1
- Mazzoli, D., Giannotti, E., Manca, M., Longhi, M., Prati, P., Cosma, M., Ferraresi, G., Morelli, M., Zerbinati, P., Masiero, S., & Merlo, A. (2018). Electromyographic activity of the vastus intermedius muscle in patients with stiff-knee gait after stroke. A retrospective observational study. Gait & Posture, 60, 273–278. https://doi.org/10.1016/j.gaitpost.2017.07.002
- Miyamoto, N., Hirata, K., Inoue, K., & Hashimoto, T. (2019). Muscle stiffness of the vastus lateralis in sprinters and long-distance runners. Medicine and Science in Sports and Exercise, 51(10), 2080–2087. https://doi.org/10.1249/MSS.0000000000002024
- Moritani, T. (2021). Electrical muscle stimulation: Application and potential role in aging society. Journal of Electromyography and Kinesiology, 61, 102598. https://doi.org/10.1016/j.jelekin.2021.102598
- Morris, S. B. (2008). Estimating effect sizes from pretest-posttest-control group designs. Organizational Research Methods, 11(2), 364–386. https://doi.org/10.1177/1094428106291059
- Mota, J. A., & Stock, M. S. (2017). Rectus femoris echo intensity correlates with muscle strength, but not endurance, in younger and older men. Ultrasound in Medicine and Biology, 43(8), 1651–1657. https://doi.org/10.1016/j.ultrasmedbio.2017.04.010
- Mukherjee, S., Fok, J. R., & van Mechelen, W. (2023). Electrical stimulation and muscle strength gains in healthy adults: A systematic review. Journal of Strength & Conditioning Research, 37(4), 938–950. https://doi.org/10.1519/JSC.0000000000004359
- Nishikawa, Y., Sakaguchi, H., Kawade, S., Maeda, N., Tanaka, S., & Hyngstrom, A. (2023). Electrical muscle stimulation in young adults: effect of muscle volume on brain-derived neurotrophic factor levels. European Journal of Applied Physiology, 123(2), 361–366. https://doi.org/10.1007/s00421-022-05078-z
- Nordez, A., & Hug, F. (2010). Muscle shear elastic modulus measured using supersonic shear imaging is highly related to muscle activity level. Journal of Applied Physiology, 108(5), 1389–1394. https://doi.org/10.1152/japplphysiol.01323.2009
- Paillard, T. (2008). Combined application of neuromuscular electrical stimulation and voluntary muscular contractions. Sports Medicine, 38(2), 161–177. https://doi.org/10.2165/00007256-200838020-00005
- Rahmati, M., Gondin, J., & Malakoutinia, F. (2021). Effects of neuromuscular electrical stimulation on quadriceps muscle strength and mass in healthy young and older adults: a scoping review. Physical Therapy, 101(9), zab144. https://doi.org/10.1093/ptj/pzab144
- Rech, A., Radaelli, R., Goltz, F. R., da Rosa, L. H., Schneider, C. D., & Pinto, R. S. (2014). Echo intensity is negatively associated with functional capacity in older women. Age (Dordr), 36(5), 9708. https://doi.org/10.1007/s11357-014-9708-2
- Santos, R., Valamatos, M. J., Mil-Homens, P., & Armada-da-Silva, P. A. S. (2018). Muscle thickness and echo-intensity changes of the quadriceps femoris muscle during a strength training program. Radiography (Lond), 24(4), e75–e84. https://doi.org/10.1016/j.radi.2018.03.010
- Snyder-Mackler, L., Delitto, A., Stralka, S. W., & Bailey, S. L. (1994). Use of electrical stimulation to enhance recovery of quadriceps femoris muscle force production in patients following anterior cruciate ligament reconstruction. Physical Therapy, 74(10), 901–907. https://doi.org/10.1093/ptj/74.10.901
- Son, J., Lee, D., & Kim, Y. (2014). Effects of involuntary eccentric contraction training by neuromuscular electrical stimulation on the enhancement of muscle strength. Clinical Biomechanics, 29(7), 767–772. https://doi.org/10.1016/j.clinbiomech.2014.06.003
- Sterczala, A. J., Miller, J. D., Dimmick, H. L., Wray, M. E., Trevino, M. A., & Herda, T. J. (2020). Eight weeks of resistance training increases strength, muscle cross-sectional area and motor unit size, but does not alter firing rates in the vastus lateralis. European Journal of Applied Physiology, 120(1), 281–294. https://doi.org/10.1007/s00421-019-04273-9
- Stevens-Lapsley, J. E., Balter, J. E., Wolfe, P., Eckhoff, D. G., & Kohrt, W. M. (2012). Early neuromuscular electrical stimulation to improve quadriceps muscle strength after total knee arthroplasty: A randomized controlled trial. Physical Therapy, 92(2), 210–226. https://doi.org/10.2522/ptj.20110124
- Stock, M. S., & Thompson, B. J. (2021). Echo intensity as an indicator of skeletal muscle quality: Applications, methodology, and future directions. European Journal of Applied Physiology, 121(2), 369–380. https://doi.org/10.1007/s00421-020-04556-6
- Tomida, K., & Nakae, H. (2020). Efficacy of belt electrode skeletal muscle electrical stimulation on muscle flexibility of lower limbs: A randomized controlled pilot trial. Medicine, 99(47), e23156. https://doi.org/10.1097/MD.0000000000023156
- Veldman, M. P., Gondin, J., Place, N., & Maffiuletti, N. A. (2016). Effects of neuromuscular electrical stimulation training on endurance performance. Frontiers in Physiology, 7, 544. https://doi.org/10.3389/fphys.2016.00544
- Vitry, F., Martin, A., & Papaiordanidou, M. (2019). Torque gains and neural adaptations following low-intensity motor nerve electrical stimulation training. Journal of Applied Physiology, 127(5), 1469–1477. https://doi.org/10.1152/japplphysiol.00513.2019
- Wakahara, T., Shiraogawa, A., & Eynon, N. (2019). Effects of neuromuscular electrical stimulation training on muscle size in collegiate track and field athletes. PLOS ONE, 14(11), e0224881. https://doi.org/10.1371/journal.pone.0224881
- Ward, S. R., & Lieber, R. L. (2005). Density and hydration of fresh and fixed human skeletal muscle. Journal of Biomechanics, 38(11), 2317–2320. https://doi.org/10.1016/j.jbiomech.2004.10.001
- Watanabe, D., Yoshida, T., Watanabe, Y., Yamada, Y., Kimura, M., & Group, K. S. (2020). Objectively measured daily step counts and prevalence of frailty in 3,616 older adults. Journal of the American Geriatrics Society, 68(10), 2310–2318. https://doi.org/10.1111/jgs.16655
- Wilhelm, E. N., Rech, A., Minozzo, F., Radaelli, R., Botton, C. E., & Pinto, R. S. (2014). Relationship between quadriceps femoris echo intensity, muscle power, and functional capacity of older men. Age (Dordr), 36(3), 9625. https://doi.org/10.1007/s11357-014-9625-4
- Yoshiko, A., Watanabe, K., & Akima, H. (2023). Relative contribution of neuromuscular activation, muscle size, and muscle quality to maximum strength output of the thigh muscles in young individuals. Physiological Reports, 11(1), e15563. https://doi.org/10.14814/phy2.15563