Abstract
Proper characterization of each individual's unique pattern of strengths and weaknesses requires good measures of diverse abilities. Here, we advocate combining our growing understanding of neural and cognitive mechanisms with modern psychometric methods in a renewed effort to capture human individuality through a consideration of specific abilities. We articulate five criteria for the isolation and measurement of specific abilities, then apply these criteria to face recognition. We cleanly dissociate face recognition from more general visual and verbal recognition. This dissociation stretches across ability as well as disability, suggesting that specific developmental face recognition deficits are a special case of a broader specificity that spans the entire spectrum of human face recognition performance. Item-by-item results from 1,471 web-tested participants, included as supplementary information, fuel item analyses, validation, norming, and item response theory (IRT) analyses of our three tests: (a) the widely used Cambridge Face Memory Test (CFMT); (b) an Abstract Art Memory Test (AAMT), and (c) a Verbal Paired-Associates Memory Test (VPMT). The availability of this data set provides a solid foundation for interpreting future scores on these tests. We argue that the allied fields of experimental psychology, cognitive neuroscience, and vision science could fuel the discovery of additional specific abilities to add to face recognition, thereby providing new perspectives on human individuality.
“ The things that make me different are the things that make me.” [attributed to A. A. Milne]
In human cognition, measures of how one individual differs from another frequently fall into two broad categories: general aptitude testing and specific clinical testing. General aptitude tests such as IQ tests and the SAT effectively capture the full range of performance, from exceptionally good to clinically poor, yet they tend to be aimed at only a few, general abilities. In contrast, clinical tests are available for a diverse array of specific disabilities. However, since clinical tests are aimed at identifying clinically poor performance, they tend to be relatively insensitive to variation in the nonimpaired range. Could it be that our concerted efforts to capture general abilities and specific disabilities have missed an opportunity to capture the full range of performance in numerous specific abilities that define key aspects of our individuality? In this paper, we take face recognition ability as an example of a specific ability that can contribute to our understanding of what makes each individual unique.Footnote
We view the specificity of face recognition ability as a potentially paradigmatic example of how our increased understanding of neural and cognitive mechanisms can guide a renewed search for specific abilities. Face recognition is one of the clearest examples of a neurally and cognitively dissociable trait. Several brain areas respond more strongly to faces than to other stimuli (Kanwisher, McDermott, & Chun, Citation1997; Tsao, Freiwald, Tootell, & Livingstone, Citation2006; Tsao, Moeller, & Freiwald, Citation2008), several behavioural phenomena are larger for faces than for other stimuli (McKone, Kanwisher, & Duchaine, Citation2007), and studies of patients and transcranial magnetic stimulation have shown both selective impairments in, and selective sparing of, face processing (Duchaine, Yovel, Butterworth, & Nakayama, Citation2006; Germine, Cashdollar, Düzel, & Duchaine, Citation2011; Moscovitch, Winocur, & Behrmann, Citation1997; Pitcher, Charles, Devlin, Walsh, & Duchaine, Citation2009). Such dissociations identify face recognition as a promising candidate for possible specificity.
We demonstrate here that face recognition indeed fractionates from other domains not only in experimental and patient-based studies, but also in its natural variation across individuals. Indeed, face recognition appears to be largely independent of, or specific from, more general abilities (see , which presents key criteria, terms, and heuristics related to capturing specific abilities). This specificity implies a relative commonness of both selective deficits and selective talents in the domain of face recognition.
Table 1. Key criteria, terms, and heuristics related to capturing specific abilities
The discovery of new specific abilities could provide an opportunity to reexamine a classic question in human ability research: To what extent do human abilities cluster into fewer general abilities versus multiple specific abilities? In the past, a tension has existed between the intuitive appeal and popularity of theories that emphasize a larger number of more diverse abilities (Gardner, Citation1983; Goleman, Citation1998; Guilford, Citation1967; Sternberg, Citation1984; Thorndike, Citation1920) and the clearer and more rigorous empirical support for theories that emphasize a smaller number of more overlapping abilities (Chabris, Citation2007; Jensen & Weng, Citation1994; Neisser et al., Citation1996; Spearman, Citation1904; cf. Brackett & Mayer, Citation2003; Mayer, Caruso, & Salovey, Citation1999). A rigorous characterization of new specific abilities could conceivably show that popular intuitions about the multiplicity of our cognitive strengths and weaknesses are not as far from reality as prior work has suggested.
A notable false start in the process of identifying face recognition as a specific ability was the release of the third edition of the Wechsler Memory Scale (WMS–III) in 1997 (Wechsler, Citation1997). A test of face recognition was added to WMS–III in an effort to capture nonverbal visual memory (Holdnack & Dellis, Citation2004). Yet this face recognition test was criticized as having an inadequate correlation with the nonface visual memory portion of WMS (r = .28 to .30; Holdnack & Dellis, 2004; Millis, Malina, Bowers, & Ricker, Citation1999; Wechsler, Citation1997) and was subsequently dropped from the next version of WMS, WMS–IV (Wechsler, Citation2009). Unknowingly, this research anticipates our own result, reported below, of a similarly low correlation between our face recognition test (Cambridge Face Memory Test, CFMT) and our nonface visual memory test (Abstract Art Memory Test, AAMT; r = .26). While such a finding is a critically important piece of our current aim to identify specific abilities and more fully appreciate what makes each individual unique, it was a disappointment in the context of Wechsler's aim to develop a more general measure of visual memory. It is interesting to consider how many more such findings, suggestive of specific abilities, may be buried in the file drawers of efforts to produce standardized general aptitude tests.
Despite the heavy attention to faces in past experimental studies of mind and brain, we still know relatively little about individual differences in face processing. This imbalance illustrates a classic and persisting hurdle in psychology: the difficulty of translating insights gleaned from experiments into an understanding of naturally occurring differences (Cronbach, Citation1957; Tracy, Robins, & Sherman, Citation2009). We believe that predominantly experimental fields, such as cognitive neuroscience, vision science, and experimental psychology, have much to offer the study of human variation. Yet the challenges of this translational work must not be taken lightly. In particular, increased attention to developing excellent measures of human variation in experimentally defined mechanisms will be necessary to actualize this translational potential.
Here, we provide a foundational analysis of the full range of variation in face identity recognition ability. This paper centres around five key test development criteria that we propose as a core methodology for isolating and measuring specific abilities. These criteria are detailed in the next section. In subsequent sections, we apply each criterion to face recognition ability in a manner that aims to be accessible and broadly applicable to further investigations of specific abilities.
By applying the first three of our five criteria, we isolate face recognition as a specific ability, building off of the WMS findings recounted above and other more recent reports suggesting specificity (Dennett et al., Citation2012; Hildebrandt, Wilhelm, Schmiedek, Herzmann, & Sommer, Citation2011; McGugin, Richler, Herzmann, Speegle, & Gauthier, Citation2012; Wilhelm et al., Citation2010; Wilmer et al., Citation2010). By applying the final two criteria, we enhance the measurement of face recognition ability, first by establishing traditional age- and sex-referenced norms, then by generating model-based estimates of ability and precision for each individual. Notably, by considering these precision estimates en masse over our 14 hundred participants, we are able to characterize the precision of our measures over the full range of ability levels, from clinically poor to exceptionally good. Finally, by providing our entire normative data set as supplementary information, we enable future researchers to generate the same norm-referenced and model-based estimates for their participants.
We measure face recognition ability here with the Cambridge Face Memory Test (CFMT, Duchaine & Nakayama, Citation2006), which has been used, to date, in over 50 published studies. CFMT's clear instructions and computer-based format make it quick, uncomplicated, and suitable for web administration, where it has produced results indistinguishable from lab testing (Germine et al., Citation2012; Wilmer et al., Citation2010). CFMT's effective removal of nonface cues is supported by both its robust inversion effect and its effective identification of prosopagnosic individuals—those with severe everyday face recognition deficits (Bowles et al., Citation2009; Duchaine & Nakayama, Citation2006). While CFMT was initially developed as a diagnostic test for developmental prosopagnosia (Duchaine & Nakayama, Citation2006), a domain in which it has become the de facto standard instrument (Bowles et al., 2009), CFMT has increasingly been used in studies that investigate the full range of human variation. Evidence has accumulated for CFMT's reliability (Bowles et al., 2009; Herzmann, Danthiir, Schacht, Sommer, & Wilhelm, Citation2008; Wilmer et al., Citation2010) and validity (Bowles et al., 2009; Dennett et al., 2012; Russell, Duchaine, & Nakayama, Citation2009; Wilmer et al., Citation2010) for capturing individual differences and also for the heritability of CFMT-measured individual differences in face recognition (Wilmer et al., Citation2010). Several additional tests have recently been modelled after CFMT (Dennett et al., 2012; Germine, Duchaine, & Nakayama, Citation2011; McGugin et al., 2012; McKone et al., Citation2011; McKone et al., Citation2012).
We include two key control recognition tests in our investigation: (a) an Abstract Art Memory Test (AAMT) of visual memory for hard-to-verbalize images (Wilmer et al., Citation2010), and (b) a Verbal Paired-Associates Memory Test (VPMT) of verbal memory for hard-to-visualize word pairs (Woolley, Gerbasi, Chabris, Kosslyn, & Hackman, Citation2008). Like CFMT, AAMT and VPMT have produced highly comparable results on the web and in the lab (Germine et al., 2012). AAMT and VPMT were chosen to enable a clean dissociation of face recognition from more general visual and verbal recognition abilities. Moreover, AAMT and VPMT examine abilities that face recognition is often intuitively grouped with. AAMT assesses visual recognition of stimuli that, like the names we attach to faces, are difficult to describe verbally. VPMT assesses verbal recognition of word pairs that, like names, create an arbitrary association between a word and something else (here, that “something else” is a second word, in order to minimize the involvement of visual memory). The theoretical basis, reliability, and validity we establish below for these key control tests is an important step in demonstrating the specificity of face recognition.
A canonical constraint in test development is the cost of testing many individuals. Numerous iterative improvements are often required for a test to achieve adequate usability, efficiency, reliability, validity, and norms. This iterative test development process, which in the past has often relied upon in-person assessment of many thousands of paid participants, can be extremely costly. Such an obstacle can be overcome where profit incentive is great (e.g., by private corporations), but it can otherwise be prohibitive. The potential for profit is clearly substantial for many general aptitude tests, such as IQ tests and the Scholastic Assessment Test (SAT), and for many clinical tests designed to diagnose common specific disabilities, such as tests for dyslexia or aphasia. We propose that there is less profit incentive for tests of specific abilities, despite the broad value to society of a more individualized understanding of human performance and potential. The case of face recognition in the Wechsler Memory Scale, recounted above, may be a case in point.
Our present approach to this obstacle rests on the following insight: By providing real-time, individualized feedback on performance, web-based testing can satisfy an individual's desire for self-knowledge while producing high-quality scientific data (Germine et al., 2012; Wilmer et al., Citation2010). Such an approach aligns the interests of individuals with those of science and produces the large amount of high-quality data necessary for rigorous test development. We believe there is potential for a virtuous circle of learning whereby the public's direct engagement in the creation of new scientific knowledge facilitates science's efforts to enhance individuals' self-knowledge. As a model example of this approach, the bulk of the analyses reported in this paper use a 1,471-participant data set collected via our website Testmybrain.org. We include this entire, item-by-item data set as supplementary information to flexibly support further research efforts with the three main tests reported on here (CFMT, AAMT, and VPMT).
In sum, the present investigation isolates and measures the specific ability of face recognition. To do so, it applies the power of modern psychometric methods and web-based testing to hypotheses generated from basic cognitive and neuroscience research. Motivated by this example, we suggest that the time is right for a renewed investigation of specific abilities.
FIVE CRITERIA FOR ISOLATING AND MEASURING SPECIFIC ABILITIES
We now summarize the five test development criteria that we use below to isolate (Criteria 1–3) and measure (Criteria 4–5) face recognition ability. Following this summary, we apply each of these criteria to our battery of three tests (CFMT, AAMT, and VPMT). By applying the first three criteria, we provide clear evidence for the specificity of face recognition ability. By applying the final two criteria, we (a) enable the generation of two types of standardized scores for our tests, (b) evaluate the precision of our tests over their full range, and (c) allow the generation of unique error bars for each individual's score.
Criterion 1. Clear theory of process or domain
Any test should have clear rationale for what it is designed to measure. The targeted capacity could be a particular process across domains, such as recognition memory regardless of what is to be recognized. It could be a particular domain across processes, such as face processing regardless of what type of processing is to be done on the face. Or, it could be a particular process in a particular domain, such as face identity recognition. In Section 1, we lay out, for each of our tests, the underlying theory, details on its development, and its procedure.
Criterion 2. High reliability
Classic test theory seeks to maximize global reliability measures, such as Cronbach's alpha or Guttman's lambda, that provide an estimate of overall signal-to-noise in the measure. Such estimates are critical for interpreting the size of correlations, since the geometric mean of the reliabilities of two measures provides a theoretical upper bound on the correlation that may be obtained between them (Schmidt & Hunter, Citation1996). In Section 2, we observe high reliability for our three tests and conduct item analyses to develop a more fine-grained appreciation for the contribution of each item to the reliability of the test as a whole.
Criterion 3. Established convergent and discriminant validity
A valid test measures what it is designed to measure. Validity is generally defined by a pattern of higher correlations with more theoretically related measures or manipulations (convergent validity) and lower correlations with less theoretically related measures or manipulations (discriminant validity; Campbell & Fiske, Citation1959). A valid measure of a specific ability will show particularly acute discriminant validity, dissociating strongly from more general ability measures theorized to involve similar processes, similar domains, or both similar processes and similar domains. In Section 3, we first document the convergent validity of our three tests (CFMT, AAMT, and VPMT). We then show that CFMT dissociates strongly from both AAMT and VPMT despite their reliability, their convergent validity, and their focus on the putatively similar process of recognition memory. These dissociations show that face recognition, as assessed by CFMT, is a specific ability.
Criterion 4. Extensive norms
Norms enable the interpretation of an individual's score by defining a reference distribution with which that score can be compared. A larger and richer normative data set can be used to more finely match the reference distribution to a given individual's age, sex, or other characteristics. Providing the entire data set directly in open-access form, as we do here, rather than just summary statistics, enables the richest and most flexible comparisons. In Section 4, we introduce our 1,471 participant normative data set and characterize variation in performance by age and sex.
Criterion 5. Detailed, model-based analysis of ability and precision
Item response theory (IRT) calculates ability in a model-based manner that goes beyond simply summing performance over test items. IRT scores include precision, in the form of unique standard error bars, for each individual, something that raw scores do not provide. These individual error bars facilitate clinical decision making. They may also be looked at en masse to characterize the overall precision of a measurement tool over different ranges of performance. Finally, IRT scores are less tied to the particular normative sample that was used to compute them than are traditional z scores. In Section 5, we present a minitutorial on IRT analyses. We then conduct IRT analyses on our three tests. The item-by-item data set we provide as supplementary information can be used to calculate IRT-based ability and precision estimates for any further individual who takes one or more of these tests.
SECTION 1: CLEAR THEORY OF PROCESS OR DOMAIN
Any test should have a clear theory for what it is designed to measure. It could be designed to measure a particular process across domains, a particular domain across processes, or a particular process in a particular domain. Face recognition ability is an example of a particular process in a particular domain, with recognition being the process and faces being the domain.
Such a clear theory is needed not only for tests of a candidate specific ability, but also for the control tests that are used to evaluate that specificity. Our two control tests were chosen to enable a clean dissociation of face recognition from abilities similar in process (recognition memory) but different in domain (involving nonface visual and difficult-to-visualize verbal stimuli). As mentioned above, these control tests measure recognition abilities that face recognition is often intuitively grouped with: (a) An Abstract Art Memory Test (AAMT) assesses visual recognition of stimuli that, like faces, are difficult to describe verbally, and (b) a Verbal Paired-Associates Memory Test (VPMT) assesses verbal recognition of word pairs that, like names, create an arbitrary association between a word and something else (here, that “something else” is a second word, in order to minimize the involvement of visual memory).
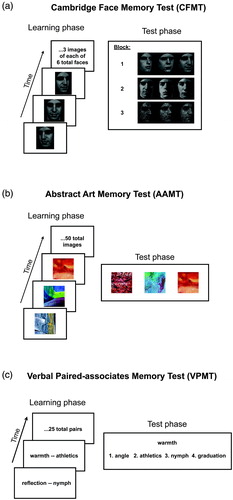
In this section, we describe the theory behind each of our tests, as well as each test's development, implementation, and procedure. The basic procedure for all three of our tests, shown in , involves first presenting the participant with a series of stimuli to learn (“learning phase”) and then asking them to recognize these stimuli amongst distractors in a multiple-choice format (“test phase”). All three tests are thus designed to assess recognition memory for novel, recently encountered stimuli.
Figure 1. Schematic description of three main memory tests. In the learning phase, shown at left, the participant learns novel target stimuli. In the test phase, shown at right, the participant identifies the target stimulus amongst distractors. See text for details of each test. Stimuli shown in a and b are different from, but chosen to be representative of, those used in the actual tests. To view a colour version of this figure, please see the online issue of the Journal.
Cambridge Face Memory Test (CFMT)
CFMT was designed to be a relatively pure test of face memory that measures the ability to learn a novel face, without involving features that are a nonintrinsic part of the face, such as hair, make-up, or jewellery (Duchaine & Nakayama, Citation2006). The detailed structure, motivation, and development of the Cambridge Face Memory Test is described in Duchaine and Nakayama Citation(2006).
A graphical summary of the basic structure of CFMT is shown in . CFMT uses a three-alternative forced choice (3AFC) recognition paradigm, so chance performance is 33% correct. In an initial learning block of 18 trials, participants view each of six faces from three different viewpoints, and after seeing the three views for a given face (, left), they are given three test trials for that face (one example test trial shown in the first row of , right). In a second block of 30 trials, participants are tested on their ability to remember the six target faces in novel images from various viewpoints (, right, second row). A third block of 24 trials again tests participants on their ability to remember the target faces in novel images from various viewpoints, but adds visual noise (, third row). In between blocks, participants study a line-up of all six faces, simultaneously presented, for 30 seconds.
It is worth noting that CFMT is unique amongst our three tests in its inclusion of test trials during the learning block. Performance on these trials is typically above 95% correct. These trials therefore contribute relatively little to discriminating better from worse performance on CFMT. Rationales for having these trials include (a) boosting the morale of those who may perform poorly on the rest of the test (CFMT was originally developed as a clinical test to identify developmental prosopagnosic patients) and (b) reinforcing the learning process (learning of faces is notoriously challenging, relative to other stimulus classes; Duchaine & Nakayama, Citation2006). As we see below, some of these Block 1 items also discriminate well between relatively low-performing individuals, thereby contributing to CFMT's utility as a diagnostic test for poor face recognition ability.
Abstract Art Memory Test (AAMT)
AAMT was designed to be a relatively pure test of visual memory that would measure individual differences in learning of visual images without unduly involving verbal processing or semantic knowledge (Chatterjee, Russell & Nakayama, Citation2009). The stimulus images used in AAMT were abstract images without any identifiable object or obvious semantic content—essentially images that were hard to verbalize, as faces are in the absence of a name.
We wanted a relatively pure measure of visual memory for novel, nonface stimuli. We chose abstract art as the stimulus category to make the test sufficiently challenging, to reduce the usefulness of verbal strategies, and to minimize the impact of specific semantic knowledge or other forms of expertise by minimizing dependence on prior knowledge of known objects. Abstract art is an uncommon category to have substantial expertise in, and due to its abstract nature, it is nonobvious that such expertise would aid memory, short of direct prior experience with the specific items to be remembered. Indeed, abstract art eschews, by definition, physical realism, semantic information, and simple categorization, and, contrary to most object classes, it tends not to share common organizational features. In contrast, individual differences in visual expertise can be ubiquitous for more semantically loaded stimulus classes such as cars (Dennett et al., 2012). These individual differences in visual expertise for a specific stimulus category of personal interest may obscure broader and more fundamental individual differences in nonface visual memory.
A graphical summary of the basic structure of AAMT is shown in . AAMT uses a 3AFC recognition paradigm, so chance performance is 33% correct. During the learning phase (, left), participants study a series of 50 abstract art images, each presented for one second, with a one-second blank screen between images. During the subsequent test phase (, right), participants are asked to identify each memorized image amongst two novel images. Each previously viewed image is tested once, for 50 total trials. A short practice was given at the beginning, with two images memorized and then tested. The images were multicolour. Each image was cropped into a square of the same size. The order of target images in the testing phase is random with respect to the order of target images in the learning phase, but the order of images in the learning phase, and the order of trials in the test phase, are both the same across participants.
In an initial piloting phase, we used a version of the test that contained 100 rather than 50 images. Based on pilot data, we honed the test to a more efficient 50-item version that retained a high level of reliability and aimed mean performance at 66% accuracy, midway between chance and ceiling (see Sections 2 and 5 and above for discussions of how this midway point tends to relate to reliability and precision).
Verbal Paired-Associates Memory Test (VPMT)
VPMT (first used by Woolley et al., Citation2008) was designed to be a relatively pure test of verbal memory that would measure individual differences in episodic verbal memory without involving visual–spatial processing.
A graphical summary of the basic structure of VPMT is shown in . VPMT uses a four-alternative forced choice (4AFC) recognition paradigm, so chance performance is 25% correct. During the learning phase (, left), participants study a series of 25 word pairs, each presented for six seconds. During the subsequent test phase (, right), participants view the first word in each pair, along with four alternative candidates for the second word, and are asked to select the one that was in the original pair they studied.
In order to make the test difficult (it was initially designed to identify extraordinary performers in Woolley et al., Citation2008) and to reduce the usefulness of visual–spatial strategies (a desirable quality for isolating verbal recognition with minimal contribution of visual processing), only abstract nouns were used. Paivio Citation(1965) showed that paired associate learning is significantly worse for abstract word pairs than for concrete word pairs. Paivio, Yuille, and Madigan's (Citation1968) norms for concreteness and imagery of nouns were used to select a set of 100 abstract nouns with low concreteness and imageability ratings (e.g., “hope”) that were not also extremely uncommon. These words were then randomly separated into four lists of 25 words, two destined to be cues and two destined to be targets. As semantic similarity can significantly aid memory (Howard & Kahana, Citation2002), cues and targets were matched to minimize semantic relatedness (using latent semantic analysis) and to avoid matching words that started with the same letter or ended with the same letter string (e.g., no “-tion” words were paired). For each cue–target pair, three distractor words were chosen from the other possible target words in the same list. The distractor words were randomly chosen, with the constraints that each word appeared as a target word once, and three times as a distractor word, and the three distractor words were different from one another on every trial. Two versions of the test (Forms A and B) were thus prepared, each with a unique set of word pairs. Form A was used here. The versions were approximately equal in word and word-pair ratings.
The six-second presentation of word pairs during the learning phase was slightly longer than the most typical duration (five seconds) found in the literature because the abstractness and unrelatedness of the words in the pairs had already made the test more difficult than typical versions. The word pairs in the learning phase and the trials in the test phase were presented in a single predetermined random order. The order of the 25 test trials, one for each memorized word pair, was unrelated to the order of word pairs in the study phase). In the data reported in this paper (Normative Data Set A), the original CFMT was administered between VPMT's learning phase and test phase, which made VPMT's test phase more difficult.
SECTION 2: HIGH RELIABILITY
Measuring reliability is necessary for interpreting the magnitude of correlations between tests. Optimizing efficiency is one of the fundamental aims of classic test theory; if higher reliability can be achieved from shorter tests, measurement error is reduced, statistical power enhanced, and inferences strengthened. In this section, we focus first on measuring reliability and then on evaluating efficiency.
Our first analysis below measures the reliability of our three tests and finds them all to be high by conventional standards. Our second analysis, a standard item analysis, provides a window into the contribution of individual items to the reliability of each test. Such item analyses can guide efforts to add and drop items in order to increase a test's reliability and/or its efficiency. The results of these item analyses suggest that while incremental improvements in efficiency may still be possible, these tests are already quite efficient.
Our third analysis, a modified item analysis, illustrates the limitations of a standard item analysis by showing that some items discriminate better at lower ability levels, while other items discriminate better at higher ability levels. When aiming for a test that captures performance across the full range of abilities, as we advocate here, it is helpful to choose a variety of items, some that discriminate well at lower ability levels and some that discriminate well at higher ability levels. This modified item analysis provides a bridge to Section 5. The IRT analyses we conduct in that section explicitly model performance on each item by ability level. These IRT analyses ultimately allow a more principled estimate of ability that includes unique error bars for each person.
All three analyses reported in this section were computed using the 1,471-person normative data set described in Section 4, which is provided as supplementary materials.
Analysis 1: Reliability
The reliability of a test directly limits the size of its correlations with other tests. For example, if two measures each have a reliability of .5, the theoretical upper bound on their correlation with each other is .5. More generally, the theoretical upper bound on the correlation between two measures is computed as the geometric mean of their reliabilities (Schmidt & Hunter, Citation1996). Correlations scale proportionally with this upper bound. For example, the same underlying relationship that produces a .2 correlation with an upper bound of .4 would be expected to produce a .3 correlation with an upper bound of .6 and a .5 correlation if it were possible for the upper bound to reach 1.0 (Schmidt & Hunter, Citation1996). Tests of the significance of the difference between two correlations implicitly assume that the upper bounds on these correlations are the same. If upper bounds differ between two correlations, then this should be taken into account when comparing them (Schmidt & Hunter, Citation1996).
Several basic approaches exist for measuring reliability, each capturing somewhat different potential sources of measurement noise. Here, we focus on internal reliability, which assesses the noise present even within a single administration of the test. To visualize the reliability of our three tests, we plot in –2c the performance of each individual on even trials (y-axis) against their performance on odd trials (x-axis). For all three tests, performance on odd trials is clearly highly predictive of performance on even trials. The correlations shown here imply Spearman–Brown corrected split-half reliabilities of .91, .80, and .83 for CFMT, AAMT, and VPMT, respectively. The Cronbach's alpha reliabilities for these three tests—interpretable as the mean of all possible Spearman–Brown corrected split-half reliabilities (Cortina, Citation1993)—are .90, .80, and .81 for CFMT, AAMT, and VPMT, respectively. These internal reliabilities are high by conventional standards, reaching or exceeding the level of .80 that is generally required of high-stakes tests (DeVellis, Citation1991).
Figure 2. Reliability and item analyses. Split-half correlations (left column), standard item analyses (middle column), and modified item analyses (right column) for the Cambridge Face Memory Test (CFMT; top row), an Abstract Art Memory Test (AAMT; middle row), and a Verbal Paired-Associates Memory Test (VPMT; bottom row), plotted with data from the normative sample described in Section 4. Graphs A–C plot the relationship between the two halves of each test (even items on y-axis plotted against odd items on x-axis). In these graphs, the line shown plots x = y. Graphs D–F plot results of a standard item analysis. In these graphs, item correlations (y-axis; correlation between item and rest of test) are plotted against item difficulty (x-axis; proportion of persons answering that item incorrectly). The horizontal lines in Graphs D–F indicate statistical significance (p = .05, two-tailed), and the vertical lines indicate the midway point between ceiling and chance performance (the so-called psychometric sweet spot; see text). Different dot shades in Graph D indicate CFMT's Blocks 1 (light grey), 2 (dark grey), and 3 (black). Graphs G–I show results of a modified item analysis, designed to highlight how a single item can discriminate differently at different ability levels. Graphs G–I are in most ways identical to Graphs D–E; the x-axis is the same, and the y-axis is also the same except that performance on the rest of the test is dichotomized at a given percentile cut-off (this focuses the analysis on the ability level represented by that percentile cut-off). Axis ranges in all Graphs D–I are the same.
Analysis 2: Standard item analysis
All else equal, adding items increases, and dropping items decreases, a test's reliability. Test development typically involves some combination of adding and dropping items to balance the desire for high reliability with the desire for constrained test length. Item analyses provide useful guidance for such efforts.
A standard item analysis technique is to correlate performance on each item with summed performance on the remainder of the test. We call these correlation values “item correlations”. An item correlation provides a rough measure of an item's contribution to test reliability. –2f show item correlations for each of our three tests (y-axis), arrayed by item difficulty (x-axis). Item difficulty is defined here as the proportion of persons who answered an item incorrectly. We now examine –2f in some detail to evaluate the contributions of their individual items to their reliability.
A basic aim for a test designed to measure a single ability is for as many items as possible to show a robust, positive item correlation, indicating that they contribute nonzero information to the measurement being made. In –2f, all items on all three tests satisfy this aim by showing positive item correlations that are above the threshold for statistical significance (threshold of p = .05, two-tailed, indicated by horizontal dotted line). An item can, however, contain nonzero positive information about an ability, yet also contain enough noise with respect to that ability that it has no overall effect on reliability (or it could even reduce reliability). A case in point is provided by Block 1 of CFMT, shown as the light-grey dots in . While all item correlations for this block are positive and statistically significant, CFMT's reliability is essentially equally high with or without these items included (e.g., Cronbach's alpha with these items = .90; Cronbach's without these items = .89).
In many cases, evidence against a contribution to reliability of one or several items justifies shortening the test by dropping those items from the test. The items in CFMT's Block 1, however, serve two purposes that are unrelated to issues of reliability. First, as discussed in Section 1 above, they are designed to reinforce the learning process and to maintain morale for individuals who go on to perform poorly on the rest of the test (Duchaine & Nakayama, Citation2006). Second, as we discuss just below in Analysis 3, some of these items distinguish relatively well at the low end of performance. The case of CFMT's Block 1, therefore, illustrates the importance of balancing potentially multiple theory-driven and data-driven considerations when making decisions about dropping or adding items.
A general trend amongst item correlations is evident for all tests, but especially for CFMT, when item correlations are arrayed by item difficulty, as in –2f. All else equal, items that show the highest item correlations, and therefore contribute most to reliability, tend to have a difficulty about midway between perfect performance and chance performance (Lord & Novick, Citation1968). For three-alternative forced-choice tests like CFMT and AAMT, where perfect performance is 0% incorrect (100% correct), and chance performance is 67% incorrect (33% correct), this so-called sweet spot of difficulty is 33% incorrect (67% correct). From a psychometric perspective, a mean item difficulty near the sweet spot is generally a desirable quality in a test. Yet though items near the sweet spot tend to contribute the most to reliability, a range of difficulties is still generally preferred when the aim is to precisely capture individual performance over a broad range of ability levels. The reason for this is that hard items tend to discriminate particularly well at high ability levels, and easy items tend to discriminate particularly well at low ability levels (for further discussion of this point, see Analysis 3 of this section, and see Section 5).
Several insights about our tests can be gained by comparing and contrasting their item difficulties in –2f. First, the mean item difficulty on AAMT is near the sweet spot of 33% incorrect (. As discussed just above, this is, all things equal, a desirable quality in a test. Second, while CFMT's mean item difficulty of 25% is easier than the sweet spot, its mean item difficulty for just Blocks 2 and 3 (dark-grey and black dots, ) is right at the sweet spot (33% incorrect). Therefore, after Block 1, the morale-building learning phase of CFMT for which most participants perform near ceiling (light-grey dots, ), CFMT contains 54 additional trials whose mean item difficulty is right at the sweet spot. Third, VPMT's item difficulties, in contrast to the other two tests, are all greater than the sweet spot (. Two related consequences of the relative difficulty of VPMT's items are: (a) as we demonstrate below in Analysis 3 of this section, many of VPMT's items distinguish particularly well at the high end of performance, and (b) as we demonstrate below in Section 5, VPMT, as a whole, distinguishes better at the high end of performance than at the low end.
Insights about the source of the high reliability for these three tests can be gleaned from their item correlations shown on the y-axes of –2f. First, VPMT has the highest mean item correlation of the three tests (.35, versus .31 for CFMT and .24 for AAMT). Despite having fewer items than the other tests (25 items), VPMT therefore still manages to attain a high reliability. Second, though AAMT's mean item correlation is lower than VPMT's, its reliability is equal to VPMT's because of its greater number of items (50 items). As mentioned above, all things equal, increasing test length increases reliability. Third, while CFMT's Block 1 contributes little to its reliability (see discussion of this point in Analysis 1 just above), a finding consistent with its positive but low item correlations, CFMT's remaining 54 items are both numerous and high in item correlations (54 items is more than VPMT and similar to AAMT; and the mean item correlation for these items is .35, higher than AAMT's mean item correlation and equal to VPMT's). CFMT's high reliability—higher than both AAMT and VPMT—derives from the numerous items in CFMT's Blocks 2 and 3 with high item correlations.
In sum, substantial insight can be gleaned from a standard item analysis about the contributions of individual items to the reliability of a measure. The item analyses shown in –2f for our three tests suggest that the individual items on these tests consistently contribute positive information to the measurement of the ability being assessed. While there remains room for potentially creating more reliable and efficient versions of these tests, they already have reliability that is high by conventional standards, justifying their use in a wide variety of circumstances. We now turn to a modified item analysis that highlights the relationship between item difficulty and the ability of an item to discriminate effectively over different ranges of performance. This analysis will provide a conceptual link between the focus in the present section on the reliability of a test and the focus in Section 5 on the precision of an individual person's score on that test.
Analysis 3: Modified item analysis examining the high and low ends of performance
It can be tempting to conclude from a standard item analysis, such as the one conducted just above, that the ideal test would consist entirely of items right at the sweet spot of difficulty, midway between chance and ceiling. While such a test would probably discriminate well amongst persons who perform near the middle of the test's range (of which there are often many), it would probably discriminate poorly amongst persons who perform rather well on the test, and also poorly amongst persons who perform rather poorly on the test. A test with a broader range of difficulties is typically preferred for its ability to more effectively capture performance across a broader range of ability levels.
–2i show the results of a modified item analysis that illustrates, more fully than the standard item analysis presented just above, how each item discriminates at a variety of different performance levels. The modified item analysis is, in most ways, identical to the standard item analysis presented above. Like that analysis, it correlates performance on each item with summed performance on the rest of the test. Unlike that analysis, however, it dichotomizes performance on the rest of the test at a particular percentile cut-off. This focuses the analysis on each item's ability to discriminate at that percentile level of performance. For example, a cut-off at the 95th percentile focuses the analysis on each item's ability to discriminate individuals who score exceptionally well (at or above the 95th percentile) from the rest (below the 95th percentile).
As a case in point of how item correlations may change when focusing on a particular cut-off away from the middle of the test's range, consider once again CFMT's Block 1. As discussed above, performance on this block is near ceiling, and its item correlations in a standard item analysis are low enough that it does not contribute to CFMT's reliability. At the 5th-percentile cut-off (, bottom plot), however, the mean item correlation for Block 1 (.23) is higher than that of both Block 2 (.18) and Block 3 (.11), suggesting that Block 1 contributes substantial information to distinguishing individuals at a cut-off that could be critical for clinical decision making. This case illustrates how the value of certain items may be obscured by a standard item analysis.
We now take a broader look at these modified item analyses across all three tests (–2i). A tendency can be seen whereby easier items discriminate better at lower percentile cut-offs (5th or 10th, bottom two graphs), and harder items discriminate better at higher percentile cut-offs (95th or 90th, top two graphs). Items nearer to the sweet spot of difficulty, in contrast, tend to discriminate better at the median split cut-off (50th percentile, middle graph). The 50th-percentile cut-off graphs (–2i, middle) paint a picture similar to the standard item analyses (–2f). The reason for this similarity is that the results of standard item analyses tend to be drawn toward the relatively large proportion of participants who typically perform near the median. The progression, from lower percentile cut-offs, where easier items discriminate best, to higher percentile cut-offs, where harder items discriminate best, is particularly clear for both CFMT (, bottom-to-top graph) and AAMT (, bottom-to-top graph). The same basic progression holds for VPMT (, bottom-to-top), but it is somewhat less clear because VPMT contains no items easier than the sweet spot. Still, as with the other tests, items near VPMT's sweet spot tend to discriminate best at the median split cut-off (, middle graph), and VPMT's more difficult items discriminate better at the higher cut-offs (95th and 90th, top two graphs) than at the lower cut-offs (5th and 10th, bottom two graphs). One can imagine that if VPMT had included items easier than the sweet spot, they may have discriminated better at the lower cut-offs (5th and 10th) than the higher cut-offs (95th and 90th). Consistently across tests, therefore, the more difficult the item, the more likely it is to discriminate well at higher cut-offs.
Modified item analyses like these provide a more complete view than standard item analyses of the contributions of individual items to capturing performance over different ranges of ability. These item analyses therefore provide more comprehensive guidance for deciding which items to drop and retain when seeking a test that effectively captures a wide range of performance levels. When aiming to capture a broad range of performance, one should favour a range of items that includes some (usually harder items) that discriminate well at higher cut-offs and some (usually easier items) that discriminate well at lower cut-offs.
In Section 5, we pick up where our modified item analysis leaves off with an IRT analysis. IRT moves beyond classic test theory by explicitly modelling both the performance level that each item discriminates best at and the power of each item for discriminating at its optimal performance level. This more detailed consideration of item characteristics provides the information necessary to generate a more principled estimate of each individual's ability, complete with error bars that indicate the precision of that estimate.
SECTION 3. CONVERGENT AND DISCRIMINANT VALIDITY
In this section, we establish the convergent and discriminant validity of our three measures. Combined with the theoretical basis provided in Section 1 and the reliability analyses in Section 2, the evidence for validity presented here provides clear support for the specificity of face recognition ability.
The validity of a test is generally defined as the combination of convergent validity, or higher correlations with more theoretically related measures or manipulations, and discriminant validity, or lower correlations with less theoretically related measures or manipulations (Campbell & Fiske, Citation1959). Together, reasonable evidence for both convergent and discriminant validity demonstrates that a test measures what it is designed to measure.
Specificity is supported when a test shows particularly acute discriminant validity, correlating little with reliable and valid tests that measure either conceptually similar abilities or highly general abilities like IQ. Conceptually similar abilities may be similar in process, domain, or some combination of the two. In this section, we dissociate face recognition ability from two tests that are similar in process to CFMT, involving recognition memory for recently learned items, yet different in domain, involving difficult-to-verbalize nonface visual stimuli (AAMT) and difficult-to-visualize verbal stimuli (VPMT).
We consider convergent validity first and discriminant validity second because robust evidence that each measure taps its intended ability (i.e., convergent validity) amplifies the specificity that can be inferred from a dissociation between measures (i.e., discriminant validity). Analyses of convergent validity show that each of our three main measures correlates highly with an independent test designed to capture a theoretically related construct. Analyses of discriminant validity show that our three main measures dissociate strongly from each other. Given the reliability, convergent validity, and conceptual similarity of CFMT, AAMT, and VPMT, the strong dissociation between them suggests a high degree of specificity for face recognition.
Convergent validity
In the paragraphs below, we describe three additional tests (a Famous Faces Memory Test, FFMT; an Object and Scene Memory Test, OSMT; and a Code Learning Memory Test, CLMT) and report how each of them, respectively, establishes the a convergent validity of one of our three main tests (CFMT, AAMT, and VPMT, respectively). The best evidence for convergent validity comes from a sizable correlation with a test designed to capture the mechanism of interest in a rather different way (a “remote association,” Wilmer, Citation2008). It is therefore a strength of these additional tests, for establishing convergent validity, that they differ in several ways from our tests of interest.
Famous Face Memory Test (FFMT) and Cambridge Face Memory Test (CFMT)
illustrates the procedure for our Famous Faces Memory Test (FFMT). FFMT consists of 20 total trials. For each trial, the participant is shown a famous face and is asked “Who is this?” (, left). If they submit a guess, they are shown the correct answer along with their guess and are asked to indicate whether they got the name correct (, right top). A participant's total score on this test is computed as the number of faces out of 20 for which they submit a guess and verify that they produced the correct name. We favour this self-scoring procedure, which we find produces highly accurate results, because it allows misspellings of the correct answer to be scored as correct. Participants who do not produce the correct name are additionally asked to indicate whether they are familiar with the person (, right top and bottom), but this does not figure into the scoring procedure. The famous faces are: Angelina Jolie, Audrey Hepburn, Barack Obama, David Beckham, Demi Moore, Johnny Depp, Donald Trump, Fred Astaire, George Clooney, John F. Kennedy, Jr., Matt Damon, Paul McCartney, Nicole Kidman, Uma Thurman, Tyra Banks, Margaret Thatcher, Stephen Colbert, Scarlett Johansson, Susan Sarandon, and Renee Zellweger.
Figure 3. Convergent validity. (A–C) Schematic descriptions of tests that establish convergent validity (see text for full details). (D–F) Performance on tests from A–C is plotted against performance on the test whose convergent validity it establishes. Dots in D are jittered slightly over the range plus-or-minus half an item correct, for improved visibility of individual data points. Least-squares line is drawn. The data plotted in F were originally reported by Woolley and colleagues (2008). Stimulus shown for FFMT is different from, but chosen to be representative of, the image of Audrey Hepburn used in the actual test. CFMT = Cambridge Face Memory Test. AAMT = Abstract Art Memory Test. VPMT = Verbal Paired-Associates Memory Test.
FFMT differs from CFMT in multiple ways. For example: (a) While CFMT tests the ability to recognize which of three faces was seen before, FFMT tests the ability to recall the name that goes with a face; (b) while CFMT tests the ability to recognize faces encountered seconds or minutes before, FFMT tests the ability to draw upon longer term memories for faces that may have accumulated over months, years, or even decades; and (3) while CFMT requires no particular knowledge obtained prior to completing the test, knowledge of the particular famous faces tested in FFMT may vary with age and/or cultural literacy.
In , we show data on FFMT and CFMT. Despite multiple differences in the time-frame and nature of the memory task, FFMT and CFMT correlated robustly—r(437) = .55, 95% [CI .48, .61], 31% of variance explained—indicating high convergent validity.
The 439 participants in this data set completed FFMT and CFMT on Testmybrain.org between January and March, 2010 (315 female; mean age 35 years; standard deviation age 16). On FFMT, these participants averaged 60.0% correct, with a standard deviation of 23.7% and a Cronbach's alpha reliability of .86. On the CFMT, these participants averaged 79.8% correct, with a standard deviation of 13.2% and a Cronbach's alpha reliability of .90.
Object and Scene Memory Test (OSMT) and Abstract Art Memory Test (AAMT)
illustrates the procedure for our Object and Scene Memory Test (OSMT). OSMT consists of 100 total trials. The basic format of OSMT is the same as that for AAMT (see description of AAMT in Section 1 above). Like AAMT, OSMT starts with a learning phase where all target images are viewed, one at a time, and it then proceeds to a test phase where the participant is required to identify each target image amongst two distractor images.
OSMT differs from AAMT in its domain. Whereas the images in AAMT were abstract and relatively devoid of semantic information, the images in OSMT were of objects and scenes that were rich in semantic information. Despite this semantic content, test trials in OSMT were designed such that explicit verbal labels were unlikely to aid the recognition process. Verbal labels were rendered relatively ineffective by choosing distractors that would typically receive the same verbal label as the target image. For example, in , “black binoculars” would describe all three images in the shown test trial. Likewise, when the other two learning phase images shown in were encountered in the test phase, the labels “lily pads with flower” and “chocolate ice cream cone” would apply to all three images shown in the respective test trials.
In , we show data on OSMT and AAMT. Despite the difference in domain and the far greater semantic content of stimuli in OSMT compared to AAMT, these two tests correlated robustly—r(18) = .68, 95% CI [.34, .86], 46% of variance explained—indicating high convergent validity.
The 20 participants in this data set completed OSMT and AAMT in the lab (12 female; mean age 48 years; standard deviation age 12). On OSMT, these participants averaged 83.8% correct, with a standard deviation of 8.3% and a Cronbach's alpha reliability of .83. On the AAMT, these participants averaged 58.7% correct, with a standard deviation of 18.9% and a Cronbach's alpha reliability of .89.
Code Learning Memory Test (CLMT) and Verbal Paired-Associates Memory Test (VPMT)
illustrates the procedure for our Code Learning Memory Test (CLMT). In CLMT, participants are given five minutes to study a list of 22 pairs of codewords and their meanings (e.g., “bug dust = diversions”). The codeword–meaning pairs are presented for approximately 13 seconds each. Participants are then given a set of 46 fictitious email messages written using the codewords. These emails are written as if recovered from a terrorist organization that uses the studied code. Participants are allowed to read the emails at their own pace, but are not allowed to reaccess the codeword-meaning list after the initial study period. Participants' performance on CLMT is measured by free-response answers to 13 questions about the content of the emails. Participants' responses are coded for correctness, and a proportion correct score, out of 13, is calculated.
While CLMT and VPMT are similar in their requirement to pair one word in memory with another word, they differ in multiple ways. For example: (a) While VPMT tests the ability to recognize which of four word-pairs was seen before, CLMT tests the ability to recall the word that was paired with the presented code word; (b) while VPMT uses abstract, difficult-to-visualize words, CLMT uses both abstract and concrete words; and (c) while VPMT is presented in a relatively abstract manner, CLMT is embedded in a vivid narrative.
In , we show data on VPMT and CLMT, originally reported by Woolley and colleagues (2008). Despite the difference in the type and amount of verbal material to be remembered, the method of testing memory, and the response modality, the two tasks correlated robustly—r(50) = .48, 95% CIs [.24, .67], 23% of variance explained—indicating high convergent validity.
The 52 participants in this data set completed CLMT, VPMT, and CFMT in the lab (40 female; mean age 31 years; standard deviation age 10). On CLMT, these participants averaged 40.0% correct, with a standard deviation of 25.1%. On VPMT, these participants averaged 49.5% correct, with a standard deviation of 20.0%. On CFMT, these participants averaged 73.4% correct, with a standard deviation of 13.7%. Internal reliability statistics are not available for this data set. In contrast to the robust correlation between VPMT and CLMT, CFMT dissociated strongly from both VPMT—r(50) = .12, 95% CIs [–.16, .38], 1% of variance explained—and CLMT—r(50) = .08, 95% CIs [–.20, .34], 1% of variance explained.
Discriminant validity
The best evidence for discriminant validity comes from a low correlation with a test designed to capture a similar process or domain (a “proximal dissociation”; Wilmer, Citation2008). It is therefore a strength of our two control tests (AAMT and VPMT), for establishing discriminant validity, that they and CFMT are all designed to capture a similar process: recognition memory for novel, recently encountered stimuli. Given evidence provided above that CFMT, AAMT, and VPMT are all reliable and high in convergent validity, we are now poised to consider whether they dissociate from each other clearly enough to support an inference of specificity for face recognition.
plots the correlations of CFMT with both AAMT and VPMT. These correlations are low, explaining just a few percentage points of variance. CFMT correlates .26 with AAMT (95% CI [.21, .31], , 6.8% of variance explained) and .18 with VPMT (95% CI [.13, .23], , 3.1% of variance explained). AAMT and VPMT also largely dissociate from each other, correlating .25 (95% CI [.20, .30], 6.3% of variance explained). In regression analyses, AAMT and VPMT together explained only 8.1% of the variance in CFMT, and this value was even smaller (6.8%) with age regressed out of the tests (to account for the curvilinear relationship between age and our tests—see discussion of norms in Section 4 below—age was regressed out of each test with a second order regression).
Figure 4. Discriminant validity. Performance on the Cambridge Face Memory Test (CFMT) is plotted against performance on (A) an Abstract Art Memory Test (AAMT) and (B) a Verbal Paired-Associates Memory Test (VPMT). For improved visibility of individual data points, dots are jittered slightly over the range plus-or-minus half an item correct. Least-squares lines are drawn.
presents the variance explained by the correlations of CFMT with AAMT and VPMT (left two bars) next to the higher variance explained by the three convergent validity correlations discussed above (right three bars). Clearly, CFMT dissociates strongly from AAMT and VPMT, relative to its higher correlation with FFMT. Moreover, CFMT's low correlations with AAMT and VPMT are not due to low convergent validity of AAMT or VPMT, as both AAMT and VPMT correlate highly with an independently designed measure aimed at capturing a theoretically related construct. Neither are CFMT's low correlations with AAMT and VPMT due to low reliability. The upper bounds on these correlations, set by the reliability of these tests, are .846 and .854, respectively (upper bounds in are shown by horizontal lines above bars; see Section 2 for information on theory and computation of upper bounds). As described above under “Convergent validity”, CFMT also dissociates strongly from CLMT. Together, these dissociations provide strong evidence for the specificity of face recognition ability.
Figure 5. Specificity of face recognition ability. Convergent and discriminant validity correlations from and are plotted here in terms of variance explained to demonstrate the Cambridge Face Memory Test's (CFMT's) specificity. Labels and pictures below each bar indicate the two tasks correlated. Error bars are ±1 SE. Horizontal lines above each bar indicate the upper bound on variance explained set by the reliability of the tests being correlated. Since the Code Learning Memory Test's (CLMT's) reliability is not known, upper bound for rightmost correlation is estimated as the Verbal Paired-Associates Memory Test's (VPMT's) reliability. The substantial independence of CFMT from the Abstract Art Memory Test (AAMT) and VPMT, and CFMT's high association with the Famous Faces Memory Test (FFMT), indicate the combination of acute discriminant validity and high convergent validity necessary to demonstrate that an ability is specific. OSMT = Object and Scene Memory Test. Critically, CFMT's strong dissociations with AAMT and VPMT can be explained neither by poor reliability, as the upper bounds on left two correlations are high, nor by poor convergent validity for AAMT or VPMT, as each shows substantial association with a theoretically related task designed to demonstrate its convergent validity. OSMT = Object and Scene Memory Test.
Clinically, our data have clear implications for the likelihood that a prospective developmental prosopagnosic individual who has been flagged based on a given diagnostic cut-off score on CFMT will ultimately demonstrate a deficit that is specific to faces. Consider, for example, that of the 30 (2.0%) of individuals in our sample who scored more than two standard deviations below CFMT's mean, a full 10 scored above AAMT's mean, and another 8 scored within a single standard deviation below AAMT's mean. Similarly, 9 of these 30 individuals scored above VPMT's mean, and 10 scored within a single standard deviation below VPMT's mean. The mean AAMT and VPMT z scores for these prospective prosopagnosic individuals were –0.65 and –0.43, respectively. In short, the majority of individuals in our large, unselected population whose CFMT scores meet a commonly used diagnostic cut-off for developmental prosopagnosia show little evidence of a more general verbal, or even visual, recognition impairment.
In sum, CFMT shows robust evidence for specificity by dissociating strongly from two other theoretically driven, reliable, and valid tests of recognition memory.
SECTION 4. EXTENSIVE NORMS
Having supported face recognition's specificity in Sections 1–3, we now turn our attention, in Sections 4 and 5, to enabling the most meaningful interpretation of an individual person's performance on our tests. Here in Section 4 we facilitate this interpretation by establishing norms for our three main tests, including provision of the entire normative data set as supplementary information (this same data set was used for the reliability analyses, item analyses, and convergent validity analyses reported in Sections 2 and 3 above). Below, in Section 5, we apply powerful IRT methods to this normative data set.
Norms enable the interpretation of a particular score for a particular individual by defining a reference distribution to which the individual's performance can be compared. For example, it may be desirable to compare an individual to those of similar age or similar gender. The 1,471-person data set we provide as supplementary information can be used to compute either a z score or percentile score, based on the most appropriate reference distribution, for any new individual who takes one or more of these tests. The ability to pull together such a reference group on the fly provides maximal flexibility to such normative analyses, whether they are being used to inform diagnostic criteria or to capture normal variation.
As we see in Section 5, the size of this data set and the inclusion of item-by-item data also support the generation of a sophisticated IRT-based score for any new individual who takes one or more of these tests. A key virtue of IRT-based scores is that they include unique error bars—a measure of precision—for each individual, something that no other scoring procedure provides. Such unique error bars are particularly useful in clinical contexts, where establishing the confidence with which a person's score meets (or misses) a diagnostic threshold is of key importance.
Overview of norms
Since the availability of our normative data set as supplementary information provides direct access to detailed normative information for our tests, our chief aim in this subsection is to convey a general flavour for this data set, and to develop the reader's intuitions for it, via the visual displays provided in .
Figure 6. Norms. Data from our large normative data set (n = 1,471) are plotted. This data set is provided in its entirety, in item-by-item form, as supplementary information. X-axes for all graphs in each column are shown below C and F; Y-axes for all graphs in each column are shown beside B and E. (A–C) Overall distributions with best fitting normal curve. (D–F) Data plotted by age and sex, with females in black and males in grey. Vertical lines indicate standard deviation for each data point. For visibility, lines are plotted up for females and down for males. Each dot indicates mean performance either at a single age or over several binned ages. Ages were binned when a single age had fewer than 35 participants, starting from the age of the youngest participant (9) and working upward. Horizontal position of dot indicates the mean age in that bin. Dots are drawn with areas proportional to the number of persons for that dot. CFMT = Cambridge Face Memory Test. AAMT = Abstract Art Memory Test. VPMT = Verbal Paired-Associates Memory Test.
characterize the overall distribution of performance for CFMT, AAMT, and VPMT, respectively. For each test, the mean, median, standard deviation, skewness, and 95% confidence interval for skewness, respectively, are: 74.2%, 75.0%, 13.7%, –0.28, and [–0.41, –0.16] for CFMT; 64.8%, 66.0%, 13.7%, –0.23, and [–.35, –.10] for AAMT; and 46.4%, 44.0%, 21.1%, 0.53, and [0.40, 0.65] for VPMT. The moderate positive skew of VPMT raises the question of whether it may discriminate better at the high end of performance than the low end (due to a possible floor effect). Conversely, the negative skews of CFMT and AAMT, though small in magnitude, raise the question of whether one or both tests may discriminate better at the low end of performance than at the high end (due to a possible ceiling effect). As we see below in Section 5, VPMT does discriminate best at the high end, consistent with some degree of floor effect. In contrast, CFMT and AAMT discriminate equally well at both the high and low end of performance, showing no evidence for a ceiling effect.
Our tests show clear age and sex effects. –6f summarize mean performance on our three main tests by age (x-axis) and sex (black = females, grey = males). Each dot represents the mean performance, for a given sex, at one age or over several ages (multiple ages were grouped, as necessary, to have at least 35 values per dot). Dot size is proportional to the number of individual values that it represents. Standard deviations are represented by lines, drawn upward for females and downward for males. While most participants are between their late teen years and their early 30s, there are 121, 85, and 45 participants, respectively, in their 30s, 40s, and 50s, sufficient for robust norms based on decade of life. Females performed somewhat better than males on all three tests: CFMT (means 74.9% and 72.8%, respectively, p = .007), AAMT (means 65.2% and 63.7%, respectively, p = .05), VPMT (means 47.4% and 44.4%, respectively, p = .01). On CFMT, at least for females, performance appears to increase into the 30s and decrease thereafter (), consistent with a previous report in a sample of 60,000 participants that used an alternative form of CFMT as well as other non-CFMT-format face recognition tests (Germine, Duchaine, et al., 2011). There is a suggestion in the data that AAMT and/or VPMT may peak somewhat earlier (–6f).
One advantage of the IRT analyses described in the next section is that they are, under a wide range of conditions, sample independent (Embretson, Citation1996). Practically speaking, sample independence means that the z scores they generate are not tied to the mean and standard deviation of that particular sample, but should be the same across a wide range of different samples, with different means and different standard deviations. In this way, IRT simplifies the collection of normative data sets by removing the firm requirement that the mean and standard deviation be representative of the population that the norms will be applied to. The means and standard deviations in the current data set are, nevertheless, comparable to those observed in other lab and web-based samples (Germine et al., 2012; Wilmer et al., Citation2010), once the relatively young age of this sample (mean = 23.6 years and median = 20 years) is taken into account (compare with mean = 27.5 years and median = 25 years in Wilmer et al., Citation2010).
In sum, the data set provided as supplemental information provides a basis for generating traditional age- and sex-matched norms for both clinical and nonclinical use. In Section 5, we discuss how this data set can be used to generate a more sophisticated, IRT-based estimate of ability that includes unique error bars for each individual person.
Further details of normative data set
The normative data set provided with this paper includes item-by-item accuracy information for our three main tests (CFMT, AAMT, and VPMT), age, sex, and the date and time that testing was initiated, for each of 1,471 web-tested participants.
These data were collected from October 7 to December 13, 2009, via Testmybrain.org as part of a battery called “Words, Faces, and Abstract Art”. The order of the tests was: (a) learning phase of VPMT, (b) AAMT, (c) test phase of VPMT, and (d) CFMT. The 1,471 participants included in this data set were 73% of an original 2,020 who completed all three tests, minus 549 (27%) who were excluded for the following reasons: 440 (22%) for answering “no” to the question “Is English your first language (or one of your first)?”, 10 (<1%) for not reporting using either a desktop or a laptop computer, 48 (2%) for reporting technical problems, 48 (2%) for reporting having taken the battery previously, and 3 (<1%) for not reporting an age. The remaining participants ranged in age from 11 to 81 years, with a median of 20, mean of 24, and standard deviation of 10. A total of 995 (67%) were female.
The dropping of participants listed above was done as a precaution, in order to ensure the highest quality normative data set. The results reported in this paper, however, remain essentially identical when all original 2,020 participants are included in analyses. Even the 440 participants who reported not having English as one of their first languages performed as well as the 1,471 retained participants on CFMT and AAMT (p-values of differences were .60 and .93, respectively, despite the large numbers), and nearly as well on VPMT (mean performance of 74.2% versus 74.6%, p = .03).
As a rough indicator of where Testmybrain.org participants tend to come from, we recently (during 2011) asked 4,590 participants to report their country of residence. Eighty percent of participants came from the following 10 countries: the United States (46%), the United Kingdom (11%), India (6%), Canada (5%), Australia (4%), the Philippines (2%), Germany (1%), China (1%), Sweden (1%), and Romania (1%), with a large number of other countries contributing less than 1% of participants each. Overall, approximately 24% of participants came from countries where English is not an official language.
SECTION 5. DETAILED, MODEL-BASED ANALYSIS OF ABILITY AND PRECISION
In Sections 1–3, we established that face recognition, as measured by CFMT, is a specific ability. Section 4 established the norms necessary for gauging how an individual's performance compares to that of others. Here in Section 5, we further enable the interpretation of individual performance by deriving a more sophisticated, model-based estimate of an individual's ability, based on IRT, that includes unique error bars for each individual person.
The precision of an estimate of performance, or ability, may be defined by its standard error of measurement: The smaller the standard error of measurement, the higher the precision. Precision and reliability are essentially equivalent concepts. The higher the reliability, the higher the precision. In Section 2, we focused on the reliability, and by extension the precision, of the test as a whole. Here, we conduct a more fine-grained, IRT-based analysis that enables an estimate of precision for each individual. These precision estimates allow us to more fully interpret individual scores.
The power of the item-by-item normative data set provided as supplementary information is particularly notable in the context of these IRT-based analyses. The accessibility of this data set means that when a further individual takes one of these tests, their item-by-item data can be directly analysed, in concert with that normative data set, to derive their z scored IRT-based ability estimate, along with error bars on that estimate. The IRT analysis conducted here also enables an important further insight into the nature of our tests. That is, it indicates how the precision of each test tends to vary from one ability level to the next.
To provide a link to the reliability analyses conducted in Section 2, we begin with the relatively crude, one-size-fits-all, classic test theory approach to placing error bars on individual scores. That is, the overall reliability of a test can be used to compute a single estimate of test precision (i.e., a single standard error). This estimate is not calibrated by ability level, nor is it calibrated by individual participants (both calibrations that are accomplished by IRT). This precision estimate is, nonetheless, useful in that it provides an initial, rough, simple-to-calculate default estimate of the precision of an individual's score. This precision, expressed in terms of standard error of measurement, is computed via the formula:
SE = SD × √(1 – reliability)
where SE is the standard error of measurement for the individual score, SD is the standard deviation of scores on the test (to obtain the SE in z score units, this SD is set to 1.0), and reliability is an estimate of overall test reliability such as Cronbach's alpha.
In our normative data set, the Cronbach's alpha reliabilities and standard deviations, respectively, for our three tests were: .89 and 13.2% for CFMT, .80 and 13.7% for AAMT, and .81 and 21.1% for VPMT. The default SEs for these three tests, in percentage correct and z score units, respectively, were therefore: 4.4% and .32 for CFMT, 6.2% and .45 for AAMT, and 9.1% and .43 for VPMT.
The precision of scores on a test, however, routinely vary across ability levels and, moreover, across individuals at a given ability level. The IRT-based analyses discussed below provide a framework within which to understand these variations in test precision. As a preview of the IRT-based SEs that will be presented below (), these SEs ranged, in z score units, from 0.21 to 0.47 (mean 0.28) for CFMT, from 0.33 to 0.60 (mean 0.40) for AAMT, and from 0.28 to 0.74 (mean 0.42) for VPMT.
The IRT-based analyses discussed below also make clear why percentage correct is not always an adequate measure of an individual's ability and how characteristics of each item can be modelled to derive a more principled estimate of an individual's ability. We start with an illustration of the so-called item response function (IRF). This IRF models the relationship between ability level and performance on a given item. The IRF can be used to illuminate the central insights of IRT-based analysis.
Minitutorial on item response theory
A basic insight of IRT is that it is possible to explicitly determine both the ability level at which each item discriminates best and the power of each item for discriminating at that optimal ability level. Remember, once again, that in Section 2, we conducted a modified item analysis illustrating that easier items tend to distinguish individuals best at low ability levels, and harder items tend to distinguish individuals best at higher ability levels. Here, we pick up where that analysis left off, taking a more detailed look at where in the ability range particular items provide the most discriminating information.
The ability level at which an item provides the most discriminating information can be visualized by looking at that item's item response function (IRF). shows three such IRFs, one for each of three items on CFMT, plotted based upon our 1,471-person normative data set described in Section 4. IRFs plot the probability of answering a given item correctly (y-axis) against an estimate of the ability level of a person (x-axis). In , ability is estimated by the proportion correct on the rest of the test (excluding the item under consideration in order to have an independent ability estimate unconfounded by performance on that particular item). IRT analyses ultimately generate a more principled estimate of ability level, which is often plotted as the ability estimate in an IRF. We plot proportion correct here for simplicity and transparency.
Figure 7. Item response function. Item performance plotted against ability level for three illustrative items in the Cambridge Face Memory Test
(CFMT): one hard item (black), one easy item (light grey), and one item of moderate difficulty (dark grey). Each dot represents the performance of all individuals of a particular ability level on one of these three items. Ability level is computed as proportion correct on CFMT, excluding the item being looked at. Item performance is computed as the proportion of individuals at a given ability level who answered that item correctly. Dots are drawn with area proportional to the number of persons with that ability level. Ability levels were binned when necessary so each one contained at least 10 participants, starting from the lowest performing participant (23 of 72 total items correct) and working upward. Where binning occurred, the ability level was averaged across all participants in that bin.
Again, three IRFs are shown in , each in a different greyscale shade. Each IRF demonstrates how ability predicts performance for one illustrative item from CFMT. The light-grey dots represent an easy item answered correctly by 98% of participants, the dark-grey dots represent a moderate difficulty item answered correctly by 70% of participants, and the black dots represent a hard item answered correctly by only 37% of participants. It is clear from examining these IRFs that individuals of very high ability have a high probability of answering all three items correctly. Yet the shape of the function and, correspondingly, the range over which it best discriminates performance, differ markedly for the three items. The easy item, in light grey, discriminates well only amongst individuals in the lower range of ability. Over this low range, individuals with a relatively higher ability are more likely to answer this item correctly than those with a relatively lower ability. This easy item does not discriminate well, however, amongst individuals of middle to high ability levels, as individuals across that entire range generally perform at ceiling on this item. In contrast to this easy item in light grey, the moderate difficulty item in dark grey discriminates best over the middle ability levels, and the hard item in black discriminates best over the highest ability levels. In the context of , it can be seen that an item discriminates best where its item response function is steepest. It can also be seen that items differ in the ability level at which their item response functions are steepest. Finally, one can imagine how a shallower slope would characterize a noisier or less valid item that less effectively captures the ability of interest (as indicated by a relatively large number of higher ability individuals getting it wrong and a relatively large number of lower ability individuals getting it right).
The IRF allows one to derive two key item-specific parameters that vary from one item to the next. The first item parameter is the ability level at which an item response function is steepest, indicating the ability that it discriminates best at. The second item parameter is the maximum steepness of the item response function, indicating how effectively an item discriminates at its optimal ability level. These item-specific parameters provide the fundamental basis for IRT analyses by allowing different items to provide different types of information about a given person.
The IRT model we use also estimates a third parameter that indicates the floor of performance for a given item. Such a parameter is helpful for cases where floor performance for low-ability individuals may not be right at chance, such as when such low-ability individuals are disproportionately drawn to choose a particularly enticing distractor (and thereby perform below chance).
In some contexts, it may be desirable to estimate a fourth parameter that indicates ceiling performance for a given item. Such a parameter is helpful for cases where ceiling performance for higher ability individuals plateaus at a level below 100% correct. We regarded this fourth parameter as unnecessary in the present context because items that showed a plateau—for example, the easy (light-grey dots) and moderate difficulty (dark-grey dots) items from CFMT shown in —generally plateaued at or near 100% correct. In general, it is best to use the minimum number of parameters that adequately model a test's IRFs, because modelling more parameters requires more data to achieve equally precise parameter and ability estimates (Edelen & Reeve, Citation2007). On multiple-choice tests, the three-parameter model we used is frequently considered optimal.
Once each item's parameters are estimated, a person's performance on these items can be used to estimate both their ability and the standard error of the estimate of their ability. A person who frequently answers the easiest items incorrectly, for example, will generally be estimated to have low ability, whereas a person who frequently answers the hardest items correctly will generally be estimated to have high ability. The standard errors, or precision, of the ability estimates is derived from the consistency with which a person performs relatively well on easier items and relatively poorly on harder items. For example, compared to a person who consistently answers easy items correctly and hard items at chance, a person with the same overall percentage correct score but lower consistency, answering several easy items incorrectly yet scoring greater than chance on the hard items, may receive a similar ability estimate but with a larger standard error (for additional reading on IRT, see Embretson, Citation1996; Embretson & Reise, Citation2000; Hambleton & Jones, Citation1993; Lord & Novick, Citation1968).
Item response theory analyses of our data
presents the key results of the three-parameter IRT analysis discussed just above for each of our three tests, computed using our normative data set. In the large main graphs of –8c, IRT-derived ability estimates for each individual person are plotted on both axes, in z score units, with ±1 standard error shown as a vertical grey line. The reason for plotting ability level on both axes is to allow the upper and lower extent of the error bars to be read directly on the y-axis in terms of ability level. The small inset graphs in A–C plot the same information as that shown in the large main graphs in –8c, with the same x-axis, but with a different y-axis that shows the standard error directly (still in z score units). The y-axis in these small inset graphs is magnified to emphasize the variation in standard errors among individuals even at a single ability level (each dot is one individual).
Figure 8. Item response theory (IRT) analyses of ability and precision for individual persons. The large main graphs in A–C plot IRT-derived ability estimates for each individual person on both axes, with ±1 standard error shown as a vertical grey line. The reason for plotting ability level on both axes is to allow the upper and lower extent of the error bars to be read directly on the y-axis in terms of ability level. The small inset graphs in A–C plot the same information as that shown in the large main graphs in A–C, with the same x-axis, but with a different y-axis that shows the standard error directly (still in z score units). The y-axis in these small inset graphs is magnified to emphasize the variation in standard errors among individuals even at a single ability level (each dot is one individual). The graphs in D–F again plot the same information in the same basic format as the large main graphs in A–C, but now in percentile units. The error bars in D–F end at the percentile ability level that would be reached by increasing or decreasing that person's ability estimate, in z score units, by its standard error. Note that while the standard errors in z score units (A–C) tend to expand with increasing distance from the middle range of abilities, the standard errors in percentile units (D–F) tend to contract with increasing distance from the middle range of abilities, a natural consequence of the nonlinear relationship between z score units and percentile units. CFMT = Cambridge Face Memory Test. AAMT = Abstract Art Memory Test. VPMT = Verbal Paired-Associates Memory Test.
A key commonality among these tests that can be seen in –8c is the overall U-shaped relationship between the ability and error of individual participants. That is, less extreme scores generally have smaller error (greater precision) than more extreme scores. Differences exist among these tests, however, in the particular form of their U-shaped relationships. CFMT, shown in , generally has smaller error (greater precision) than AAMT and VPMT (–8c), as one would expect from CFMT's higher overall reliability. VPMT's error, however, is similar to CFMT's above a z score of about 1.0. AAMT's and VPMT's results differ considerably from each other, with AAMT having smaller error over the lower range of performance and VPMT having smaller error over the higher range of performance. VPMT has the least symmetrical U-shaped function, showing substantially smaller error at high ability levels than at low ability levels.
The form of the relationship between ability and precision for each test has distinct implications. First, CFMT has higher precision (smaller error) across ability levels, supporting its use for capturing the broad spectrum of face recognition ability. Second, VPMT produces precise, low-error results at high ability levels but is less precise for capturing lower ability levels. This result suggests that VPMT could be particularly effective for identifying those with superior verbal recognition (indeed, this is what it was originally designed for; see Woolley et al., Citation2008), while it would be less effective as a diagnostic test to identify impairments in verbal recognition. VPMT's greater precision at higher ability levels results primarily from the difficulty of its items, which tend to discriminate relatively well between high-ability individuals (as indicated by the modified item analysis shown in . Third, AAMT is capable of capturing a broad range of ability levels, though it does so less precisely than CFMT. The AAMT may thus be thought of as a similar general-purpose instrument to CFMT, but one that captures individual performance with somewhat less precision. Overall, the ability to place error bars on individual ability estimates for each of these three tests critically enables the meaningful interpretation of an individual person's profile of scores across these tests.
In certain circumstances, it may be helpful to think of error on a test in percentile units. For example, say that a diagnostic threshold has been set at the 5th percentile and an individual scores in the 10th percentile. A standard error that encompasses 5 percentile units in a downward direction (that is, that stretches to the 5th percentile) would put the lower reach of the 68% confidence interval for that participant right at the diagnostic threshold (given that SE bars indicate a 68% CI). In such a case, one's confidence in a lack of diagnosis for that individual would be rather low, and one might want to conduct additional diagnostic testing to be more confident of that individual's ability level.
–8f plot the same information in the same basic format as the large main graphs in –8c, but now in percentile units. In particular, the error bars in –3f end at the percentile ability level that would be reached by increasing or decreasing that person's ability estimate, in z score units, by its standard error.
A notable difference between standard errors in z score units, as in –8c, versus standard errors in percentile units, as in –8f, is how these errors change with increasing distance from the median ability level. Note that the z-score-based standard errors in –8c tend to increase with increasing distance from the median ability level, whereas the percentile-based standard errors in –8f tend to decrease with increasing distance from the median ability level. This opposite pattern results from the fundamental relationship between z scores and percentiles. For almost any natural distribution of performance, even those that are highly non-normal, there tend to be more individuals in the middle portion of that distribution than at the extremes of that distribution. A given z score change will therefore correspond to a larger percentile change near the middle portion of the distribution than at its extremes. The result of this is that even though there is a substantially larger standard error in z score units at the extremes of ability level for these measures, this corresponds to a relatively small standard error in percentile units. Depending on the inference to be made, one might prefer either z score units or percentile units. Thinking in percentiles is often helpful when making inferences about how one individual compares to others.
Additional notes on item response theory (IRT)
Although IRT has a number of advantages over classic test development methods (Embretson, Citation1996), we see three central advantages when the aim is to capture specific abilities. First, unlike traditional normed scores (see Section 4), IRT scores include precision, in the form of unique standard error bars, for each individual. These individual error bars, discussed just above in relation to , increase the interpretability of individual scores in both clinical and nonclinical contexts. Second, these individual error bars can be looked at en masse, as we have done above (again, see discussion of ), to characterize the overall precision of a measurement tool over different ranges of performance. This information on the precision of a test across ability levels can be used to decide on an appropriate test for a given purpose or to refine a test to be sensitive to a wider (or narrower) range of human variation. Third, IRT scores are less tied to the particular normative sample that was used to compute them than are traditional normed z scores. That is, under a wide range of conditions, one will obtain the same IRT-based z score for an individual even when that individual's z score is computed based on different normative samples with different fundamental statistical characteristics (e.g., different raw score means or standard deviations). We point the reader to outside resources for a detailed discussion of the generalizability of IRT scores across normative samples (Embretson, Citation1996; Embretson & Reise, Citation2000).
The IRT analyses reported in this paper were conducted in the statistical program R (r-project.org), using the function tpm from the package ltm. Given the below five lines of code, R will fit the basic three-parameter model that we have used, then output individual ability and standard error values. For further details on using R to fit IRT models, see the R website, the documentation for the ltm package, and the various print and online resources for using R. A number of other software packages are also available for conducting IRT analyses.
data <- as.matrix(read.table(“data.csv”, sep = “,”))
a <- tpm(data)
b <- factor.scores(a)
write.csv(b$score.dat$z1, ‘ability.csv')
write.csv(b$score.dat$se.z1, ‘se_of_ability.csv')
These five lines do the following: Line 1 loads the data from a file of the standard csv (comma separated values) file type where rows are participants, columns are items, and 0 = correct and 1 = incorrect. Line 2 fits the three-parameter model. Line 3 computes individual ability and standard error values, in z score units. Lines 4 and 5 output the individual ability and standard error values to csv files.
How many participants are required to fit a IRT model that will generate robust individual ability and standard error estimates? The answer depends on a number of factors, including the number of parameters in the model (more parameters require more participants) and the quality of the items (higher discriminability of items requires fewer participants) (Embretson & Reise, Citation2000). A common heuristic for the three-parameter model used here is that 1,000 participants are sufficient to obtain good model fits across a wide range of circumstances (Kim, Citation2006; Yen, Citation1987). Importantly, once an item-by-item normative sample exists that is of sufficient size to fit a robust IRT model for a given test, that model can then be applied to generate ability and precision estimates for any further individual who takes the test.
In sum, IRT-based analyses provide a more principled estimate of ability and allow the placement of error bars, in either z score or percentile units, on that ability. Using the normative data set provided as supplementary information, IRT-based ability and error estimates can be derived for any further individual who takes one or more of our tests. The ability to derive these estimates enables maximally meaningful interpretations of an individual's profile of scores across tests.
DISCUSSION
We argue that the time is right for a renewed investigation of specific abilities, in order to more fully understand the many unique ways in which individuals can vary. Advances in three complementary domains are well-placed to support such investigations. First, basic neural and cognitive sciences increasingly isolate mechanisms that could potentially vary independently between individuals. Second, modern psychometric methods provide powerful techniques for isolating and measuring specific abilities.
Third, high-quality web testing provides the throughput necessary to swiftly hone tests and produce large normative data sets that enhance the interpretability of each individual score. We present face recognition as a model example of how these three domains can come together to facilitate the isolation and measurement of a specific ability. Ultimately, we hope that improved measurement of a wide variety of specific abilities will inspire a keener understanding of our own individuality, a richer appreciation for the variety of minds around us, and a broader view on the diversity of human potential.
The present efforts capture face recognition as a specific ability through the application of five key test development criteria. The first three criteria focus on isolation, or evaluation of the degree of specificity for the candidate ability. These first three criteria are: (1) clear theory of process or domain, (2) high reliability, and (3) convergent and discriminant validity. By applying these criteria, we dissociate face recognition from more general visual and verbal recognition yet show strong convergence between face recognition tests, thereby demonstrating a high degree of specificity. The final two criteria focus on measurement, or generation of the most informative scores for each individual who takes the test.
These final two criteria are: (4) extensive norms and (5) detailed, model-based analysis of ability and precision via Item Response Theory (IRT). By applying these criteria, we enable precise, norm-referenced estimates of an individual's face recognition ability, complete with individual standard error bars. Further, we characterize the precision of our measures over the full range of ability levels, from clinically poor to exceptionally good. Our approach to the majority of these criteria (2–5) was greatly facilitated by high-volume web testing. In addition, the availability of our entire normative data set as supplementary information will enable future researchers to generate the same norm-referenced and model-based estimates of ability for their participants as we have generated here for our participants.
It is worth dwelling on three particular contributions of IRT to the robust measurement of an ability. First, IRT's unique capacity to generate error bars for each individual's score is valuable for clinical decision making because it specifies the confidence with which a given individual surpasses, or falls short of, a diagnostic threshold. Second, the individual error bars that IRT produces may be looked at en masse, as we have done in , to characterize the precision of a measurement tool as a whole over different ranges of performance. Third, unlike traditional norm-based z scores, IRT-based z scores are largely independent of the normative sample from which they are calculated (Embretson, Citation1996). That is, under a wide range of conditions, one will obtain the same IRT-based z score for an individual even when that individual's z score is computed based on different normative samples with different fundamental statistical characteristics (e.g., different raw score means or standard deviations).
Despite these advantages, at least two key factors tend to limit IRT's application. First, there is a significant learning curve to grasp both the fundamental concepts of IRT and the statistical packages available to implement IRT. With this in mind, we have aimed to provide enough information above to understand basic IRT analyses, to get out of the starting blocks with one's own analyses, and to know of some places to look for further information. The second limiting factor is the need for large, item-by-item data sets (Kim, Citation2006; Yen, Citation1987). We suggest that collecting and sharing large web-based data sets, as we do here, could be a valuable approach to overcoming this limiting factor. IRT, originally developed for use with the Scholastic Aptitude Test, has contributed greatly to our ability to assess general abilities. We suggest that IRT has underutilized potential for capturing specific abilities and, in turn, inspiring a richer appreciation of each individual's unique blend of strengths and weaknesses.
The present investigation builds on and extends past studies of selective developmental disorders that have dissociated face recognition from more general recognition (e.g., Duchaine et al., Citation2006; Germine, Cashdollar, et al., 2011; Moscovitch et al., Citation1997). In theory, such dissociations could have turned out to be rare exceptions to a general rule of close yoking between face and nonface recognition abilities. Yet our results suggest differently. They argue that such dissociations are the rule, not the exception. A look at plainly indicates that severely impaired face recognition ability implies little about one's overall visual recognition ability and verbal recognition ability. The same can be observed across the entire spectrum of ability ranging from clinically poor to exceptionally good. Based on these results, we can therefore conclude that there exists a deeper and more pervasive independence between face recognition and other recognition abilities than could have been concluded from prior patient-based research. A clear practical implication of this result is that one probably learns little about an individual's ability to recognize faces from their scores—even their visual memory scores—on a general battery of memory tests such as the Wechsler Memory Scale (Wechsler, Citation1997, Citation2009).
The story recounted in the introduction, about the face memory test that was dropped from the fourth edition of the Wechsler Memory Scale (Wechsler, Citation2009), has been followed by additional recent reports that support face recognition's specificity (Dennett et al., 2012; Hildebrandt et al., Citation2011; McGugin et al., 2012; Wilhelm et al., Citation2010; Wilmer et al., Citation2010). One particularly extensive line of work developed several novel tests of face recognition ability and provided evidence that a latent variable defined by the covariance between them was stable, and quite distinct from more general abilities, across the lifespan (Herzmann et al., Citation2008; Hildebrandt, Sommer, Herzmann, & Wilhelm, Citation2010; Hildebrandt et al., Citation2011; Wilhelm et al., Citation2010). While the individual tasks used in that study had neither the reliability of CFMT nor its accumulated evidence for validity, the structural equation modelling (SEM) methods employed both enabled the creation of a reliable latent variable and provided clear evidence for the validity of that variable. Such SEM-based methods provide powerful tools for investigating candidate specific abilities.
The present investigation was greatly accelerated by the power of web-based testing. Indeed, the large, 1,471-person data set that forms the centrepiece of this paper was collected in largely automated fashion over the course of just two months via our popular website Testmybrain.org. We believe web-based testing could play a key role in the investigation of specific abilities and, more broadly, in the translation of basic science insights into a richer understanding of both clinical and nonclinical human variation. In particular, we advocate a participant-as-collaborator model of web-based testing. This approach provides informative performance feedback to those who complete tests and uses the knowledge gained from participants to develop better tests that could further enhance subsequent participants' understanding of themselves. The present investigation provides an example of this approach. The large number of participants who completed our tests were self-selected, unsupervised, anonymous, and uncompensated. They presumably completed these tests mainly to gain knowledge about their own memory, and the data they provided have fuelled a substantial leap forward in the development of the tests they took. Thus, by facilitating both the public's and science's respective searches for knowledge, the participant-as-collaborator model of web testing could accelerate the test development efforts necessary for a fuller understanding of what makes each individual unique.
In sum, we have provided clear evidence for face recognition's specificity, facilitated its precise and efficient measurement in individuals, and used it as a test case to illustrate five test development criteria that we believe could have broad utility in further efforts to isolate and measure specific abilities. To paraphrase A. A. Milne, the things that make us different are the things that make us. May we gain, over time, a deeper sense of the things that make us.
Supplementary material
Supplementary material is available via the “Supplementary” tab on the article's online page (http://dx.doi.org/10.1080/02643294.2012.753433).
Supplemental Material
Download MS Excel (1.5 MB)Acknowledgments
Thanks to Brad Duchaine, Holum Kwok, and three reviewers for their valuable input. Author contributions: J.B.W. designed the study, analysed the data, and wrote the paper; L.G. created the Famous Faces Memory Test (FFMT), produced online versions of Cambridge Face Memory Test (CFMT), Abstract Art Memory Test (AAMT), and Verbal Paired-associates Memory Test (VPMT), ran the discriminant validity study and the CFMT convergent validity study online, and provided feedback on the manuscript; C.F.C. and M.G. created the VPMT and Code Learning Memory Test (CLMT), conducted the VPMT convergent validity study, and wrote the VPMT portion of Section 1; G.C. created the AAMT and Object and Scene Memory Test (OSMT), conducted the AAMT convergent validity study, and drafted the AAMT portion of Section 1; K.N. provided input on writing and presentation of analyses.
Notes
This article was originally published with errors. This version has been corrected. Please see erratum (http://dx.doi.org/10.1080/02643294.2013.780378).
Related Research Data
REFERENCES
- Bowles , D. C. , McKone , E. , Dawel , A. , Duchaine , B. , Palermo , R. , Schmalzl , L. and Yovel , G. 2009 . Diagnosing prosopagnosia: Effects of ageing, sex, and participant–stimulus ethnic match on the Cambridge Face Memory Test and Cambridge Face Perception Test . Cognitive Neuropsychology , 26 : 423 – 455 . (doi:10.1080/02643290903343149)
- Brackett , M. A. and Mayer , J. D. 2003 . Convergent, discriminant, and incremental validity of competing measures of emotional intelligence . Personality and Social Psychology Bulletin , 29 : 1147 – 1158 . (doi:10.1177/0146167203254596)
- Campbell , D. T. and Fiske , D. W. 1959 . Convergent and discriminant validation by the multitrait–multimethod matrix . Psychological Bulletin , 56 : 81 – 105 . (doi:10.1037/h0046016)
- Chabris , C. F. 2007 . “ Cognitive and neurobiological mechanisms of the law of general intelligence ” . In Integrating the mind: Domain general versus domain specific processes in higher cognition , Edited by: Roberts , M. J. 449 – 491 . Hove , UK : Psychology Press .
- Chatterjee , G. , Russell , R. and Nakayama , K. 2009 . Non-face visual memory impairments in developmental prosopagnosia . Journal of Vision , 9 : 488 (doi:10.1167/9.8.488)
- Cortina , J. M. 1993 . What is coefficient alpha? An examination of theory and application . Journal of Applied Psychology , 78 : 98 – 104 . (doi:10.1037/0021-9010.78.1.98)
- Cronbach , L. J. 1957 . The two disciplines of scientific psychology . American Psychologist , 12 : 671 – 684 . (doi:10.1037/h0043943)
- Deary, I. J., Lawn, M., & Bartholomew, D. J. (2008). A conversation between Charles Spearman, Godfrey Thomson, and Edward L. Thorndike: The international examinations inquiry meetings 1931–1938. History of Psychology, 11, 122–142.
- Dennett , H. W. , McKone , E. , Tavashmi , R. , Hall , A. , Pidcock , M. , Edwards , M. and Duchaine , B. 2012 . The Cambridge Car Memory Test: A task matched in format to the Cambridge Face Memory Test, with norms, reliability, sex differences, dissociations from face memory, and expertise effects . Behavior Research Methods , 44 : 587 – 605 . (doi:10.3758/s13428-011-0160-2)
- DeVellis , R. F. 1991 . Scale development , Newbury Park , NJ : Sage Publications .
- Duchaine , B. and Nakayama , K. 2006 . The Cambridge Face Memory Test: Results for neurologically intact individuals and an investigation of its validity using inverted face stimuli and prosopagnosic participants . Neuropsychologia , 44 : 576 – 585 . (doi:10.1016/j.neuropsychologia.2005.07.001)
- Duchaine , B. , Yovel , G. , Butterworth , E. and Nakayama , K. 2006 . Prosopagnosia as an impairment to face-specific mechanisms: Elimination of the alternative hypotheses in a developmental case . Cognitive Neuropsychology , 23 : 714 – 747 . (doi:10.1080/02643290500441296)
- Edelen , M. O. and Reeve , B. B. 2007 . Applying item response theory (IRT) modeling to questionnaire development, evaluation, and refinement . Quality of Life Research , 16 : 5 – 18 . (doi:10.1007/s11136-007-9198-0)
- Embretson , S. E. 1996 . The new rules of measurement . Psychological Assessment , 8 : 341 – 349 . (doi:10.1037/1040-3590.8.4.341)
- Embretson , S. E. and Reise , S. P. 2000 . Item response theory for psychologists , New York , NY : Psychology Press .
- Gardner , H. 1983 . Frames of mind: The theory of multiple intelligences , New York , NY : Basic Books .
- Germine , L. , Cashdollar , N. , Düzel , E. and Duchaine , B. 2011 . A new selective developmental deficit: Impaired object recognition with normal face recognition . Cortex , 47 : 598 – 607 . (doi:10.1016/j.cortex.2010.04.009)
- Germine , L. T. , Duchaine , B. and Nakayama , K. 2011 . Where cognitive development and aging meet: Face learning ability peaks after age 30 . Cognition , 118 : 201 – 210 . (doi:10.1016/j.cognition.2010.11.002)
- Germine , L. , Nakayama , K. , Duchaine , B. C. , Chabris , C. F. , Chatterjee , G. and Wilmer , J. B. 2012 . Is the Web as good as the lab? Comparable performance from Web and lab in cognitive/perceptual experiments . Psychonomic Bulletin & Review , 19 : 847 – 857 . (doi:10.3758/s13423-012-0296-9)
- Goleman , D. 1998 . Working with emotional intelligence , New York , NY : Bantam Books .
- Guilford , J. P. 1967 . The nature of human intelligence , New York , NY : McGraw-Hill .
- Hambleton , R. K. and Jones , R. W. 1993 . Comparison of classical test theory and item response theory and their applications to test development . Educational Measurement: Issues and Practice , 12 ( 3 ) : 38 – 47 . (doi:10.1111/j.1745-3992.1993.tb00543.x)
- Herzmann , G. , Danthiir , V. , Schacht , A. , Sommer , W. and Wilhelm , O. 2008 . Toward a comprehensive test battery for face cognition: Assessment of the tasks . Behavior Research Methods , 40 : 840 – 857 . (doi:10.3758/BRM.40.3.840)
- Hildebrandt , A. , Sommer , W. , Herzmann , G. and Wilhelm , O. 2010 . Structural invariance and age-related performance differences in face cognition . Psychology and Aging , 25 : 794 (doi:10.1037/a0019774)
- Hildebrandt , A. , Wilhelm , O. , Schmiedek , F. , Herzmann , G. and Sommer , W. 2011 . On the specificity of face cognition compared with general cognitive functioning across adult age . Psychology and Aging , 26 : 701 (doi:10.1037/a0023056)
- Holdnack , J. A. and Delis , D. C. 2004 . Parsing the recognition memory components of the WMS–III face memory subtest: Normative data and clinical findings in dementia groups . Journal of Clinical and Experimental Neuropsychology , 26 : 459 – 483 . (doi:10.1080/13803390490496687)
- Howard , M. W. and Kahana , M. J. 2002 . When does semantic similarity help episodic retrieval? . Journal of Memory and Language , 46 : 85 – 98 . (doi:10.1006/jmla.2001.2798)
- Jensen , A. R. and Weng , L. J. 1994 . What is a good g? . Intelligence , 18 : 231 – 258 . (doi:10.1016/0160-2896(94)90029-9)
- Kanwisher , N. , McDermott , J. and Chun , M. 1997 . The fusiform face area: A module in human extrastriate cortex specialized for the perception of faces . Journal of Neuroscience , 17 : 4302 – 4311 .
- Kim , S. 2006 . A comparative study of IRT fixed parameter calibration methods . Journal of Educational Measurement , 43 : 355 – 381 . (doi:10.1111/j.1745-3984.2006.00021.x)
- Lord , F. M. and Novick , M. R. 1968 . Statistical theories of mental test scores , Reading , MA : Addison-Welsley Publishing Company .
- Mayer , J. D. , Caruso , D. R. and Salovey , P. 1999 . Emotional intelligence meets traditional standards for an intelligence . Intelligence , 27 : 267 – 298 . (doi:10.1016/S0160-2896(99)00016-1)
- McGugin , R. W. , Richler , J. J. , Herzmann , G. , Speegle , M. and Gauthier , I. 2012 . The Vanderbilt Expertise Test reveals domain-general and domain-specific sex effects in object recognition . Vision Research , 69 : 10 – 22 . (doi:10.1016/j.visres.2012.07.014)
- McKone , E. , Hall , A. , Pidcock , M. , Palermo , R. , Wilkinson , R. B. , Rivolta , D. and O'Connor , K. B. 2011 . Face ethnicity and measurement reliability affect face recognition performance in developmental prosopagnosia: Evidence from the Cambridge Face Memory Test–Australian . Cognitive Neuropsychology , 28 : 109 – 146 . (doi:10.1080/02643294.2011.616880)
- McKone , E. , Kanwisher , N. K. and Duchaine , B. C. 2007 . Can generic expertise explain special processing for faces? . Trends in Cognitive Sciences , 11 : 8 – 15 . (doi:10.1016/j.tics.2006.11.002)
- McKone , E. , Stokes , S. , Liu , J. , Cohan , S. , Fiorentini , C. , Pidcock , M. and Pelleg , M. 2012 . A robust method for measuring other-race and other-ethnicity effects: The Cambridge Face Memory Test format . PLoS ONE , 7 ( 10 ) : e47956 (doi:10.1371/journal.pone.0047956)
- Millis , S. R. , Malina , A. C. , Bowers , D. A. and Ricker , J. H. 1999 . Confirmatory factor analysis of the Wechsler Memory Scale–III . Journal of Clinical and Experimental Neuropsychology , 21 : 87 – 93 . (doi:10.1076/jcen.21.1.87.937)
- Moscovitch , M. , Winocur , G. and Behrmann , M. 1997 . What is special about face recognition? Nineteen experiments on a person with visual object agnosia and dyslexia but normal face recognition . Journal of Cognitive Neuroscience , 9 : 555 – 604 . (doi:10.1162/jocn.1997.9.5.555)
- Neisser , U. , Boodoo , G. , Bouchard , T. J. , Boykin , A. W. , Brody , N. Ceci , S. J. 1996 . Intelligence: Knowns and unknowns . American Psychologist , 51 : 77 – 101 . (doi:10.1037/0003-066X.51.2.77)
- Paivio , A. 1965 . Abstractness, imagery, and meaningfulness in paired-associate learning . Journal of Verbal Learning and Verbal Behavior , 4 : 32 – 38 . (doi:10.1016/S0022-5371(65)80064-0)
- Paivio , A. , Yuille , J. C. and Madigan , S. A. 1968 . Concreteness, imagery, and meaningfulness values for 925 nouns. Journal of Experimental Psychology . 76 ( 1, Suppl ) : 1 – 25 .
- Pitcher , D. , Charles , L. , Devlin , J. , Walsh , V. and Duchaine , B. 2009 . Triple dissociation of faces, bodies and objects in extrastriate cortex . Current Biology , 19 : 319 – 324 . (doi:10.1016/j.cub.2009.01.007)
- Russell , R. , Duchaine , B. and Nakayama , K. 2009 . Super-recognizers: People with extraordinary face recognition ability . Psychonomic Bulletin & Review , 16 : 252 – 257 . (doi:10.3758/PBR.16.2.252)
- Schmidt , F. L. and Hunter , J. E. 1996 . Measurement error in psychological research: Lessons from 26 research scenarios . Psychological Methods , 1 : 199 – 223 . (doi:10.1037/1082-989X.1.2.199)
- Spearman , C. 1904 . General intelligence, objectively determined and measured . The American Journal of Psychology , 15 : 201 – 292 . (doi:10.2307/1412107)
- Sternberg , R. J. 1984 . Beyond IQ: A triarchic theory of human intelligence , Cambridge , UK : Cambridge University Press .
- Thorndike, E. L. (1920). Intelligence and its use. Harper's Magazine, 140, 227–235.
- Tracy , J. L. , Robins , R. W. and Sherman , J. W. 2009 . The practice of psychological science: Searching for Cronbach's two streams in social-personality psychology . Journal of Personality and Social Psychology , 96 : 1206 – 1225 . (doi:10.1037/a0015173)
- Tsao , D. Y. , Freiwald , W. A. , Tootell , R. B. and Livingstone , M. S. 2006 . A cortical region consisting entirely of face-selective cells . Science , 311 : 670 – 674 . (doi:10.1126/science.1119983)
- Tsao , D. Y. , Moeller , S. and Freiwald , W. A. 2008 . Comparing face patch systems in macaques and humans . Proceedings of the National Academy of Sciences, USA , 105 : 19514 – 19519 . (doi:10.1073/pnas.0809662105)
- Wechsler , D. 1997 . Wechsler Memory Scale , 3 , San Antonio , TX : The Psychological Corporation .
- Wechsler , D. 2009 . Wechsler Memory Scale , 4 , San Antonio , TX : The Psychological Corporation .
- Wilhelm , O. , Herzmann , G. , Kunina , O. , Danthiir , V. , Schacht , A. and Sommer , W. 2010 . Individual differences in perceiving and recognizing faces—one element of social cognition . Journal of Personality and Social Psychology , 99 : 530 (doi:10.1037/a0019972)
- Wilmer , J. B. 2008 . How to use individual differences to isolate functional organization, biology, and utility of visual functions; with illustrative proposals for stereopsis . Spatial Vision , 21 : 561 – 579 . (doi:10.1163/156856808786451408)
- Wilmer , J. B. , Germine , L. , Chabris , C. F. , Chatterjee , G. , Williams , M. , Loken , E. and Duchaine , B. 2010 . Human face recognition ability is specific and highly heritable . Proceedings of the National Academy of Sciences, USA , 107 : 5238 – 5241 . (doi:10.1073/pnas.0913053107)
- Woolley , A. W. , Gerbasi , M. E. , Chabris , C. F. , Kosslyn , S. M. and Hackman , J. R. 2008 . Bringing in the experts: How team ability composition and collaborative planning jointly shape analytic effectiveness . Small Group Research , 39 : 352 – 371 . (doi:10.1177/1046496408317792)
- Yen , W. M. 1987 . A comparison of the efficiency and accuracy of BILOG and LOGIST . Psychometrika , 52 : 275 – 291 . (doi:10.1007/BF02294241)