Abstract
In grapheme–colour synaesthesia, letters, numbers, and words elicit involuntary colour experiences. Recently, there has been much emphasis on individual differences and possible subcategories of synaesthetes with different underlying mechanisms. In particular, there are claims that for some, synaesthesia occurs prior to attention and awareness of the inducing stimulus. We first characterized our sample using two versions of the “Synaesthetic Congruency Task” to distinguish “projector” and “associator” synaesthetes who may differ in the extent to which their synaesthesia depends on attention and awareness. We then used a novel modification of the “Embedded Figures Task” that included a set-size manipulation to look for evidence of preattentive “pop-out” from synaesthetic colours, at both a group and an individual level. We replicate an advantage for synaesthetes over nonsynaesthetic controls on the Embedded Figures Task in accuracy, but find no support for pop-out of synaesthetic colours. We conclude that grapheme–colour synaesthetes are fundamentally similar in their visual processing to the general population, with the source of their unusual conscious colour experiences occurring late in the cognitive hierarchy.
Synaesthesia is an intriguing phenomenon in which a single stimulus triggers the occurrence of one or more additional experiences—either in the same or in different sensory modalities (Grossenbacher & Lovelace, Citation2001). For example, some synaesthetes see colours when they listen to music, or smell particular odours or tastes. In one of the most widely studied and prevalent forms of synaesthesia, grapheme–colour synaesthetes experience a colour when they see, hear, or think about letters and numbers (Barnett et al., Citation2008; Rich, Bradshaw, & Mattingley, Citation2005; Simner et al., Citation2006). For most synaesthetes, the experiences have been present from early childhood, are highly consistent over time, and do not reflect a disorder or impairment (Rich et al., Citation2005; Rich & Mattingley, Citation2002; Simner et al., Citation2006).
There has been considerable debate over the extent to which synaesthetes' unusual conscious experiences might improve their performance on various visual tasks (Edquist, Rich, Brinkmann, & Mattingley, Citation2006; Palmeri, Blake, Marois, Flanery, & Whetsell, Citation2002; Ramachandran & Hubbard, Citation2001a; Sagiv, Heer, & Robertson, Citation2006). Such superior performance would imply that synaesthetes have (perhaps fundamentally) different cognitive processes from the general population. One of the most widely cited findings, including in the popular media and among synaesthete forums such as the Synesthesia List is that synaesthetic colours cause shapes to “pop-out” in the Embedded Figures Task first reported by Ramachandran and Hubbard Citation(2001a). In this task, participants are asked to identify shapes composed of repetitions of a particular letter within a field of other letters. Ramachandran and Hubbard Citation(2001a) reported that their two synaesthetes were more accurate than controls in identifying the embedded shape, which they subsequently referred to as “pop-out” (Ramachandran & Hubbard, Citation2001b). This has led to claims that synaesthetic colours can arise preconsciously, at an early sensory level (Ramachandran & Hubbard, Citation2001b). Subsequent reports that this effect was not present for all synaesthetes led these authors to propose subgroups of grapheme–colour synaesthetes, termed “lower” and “higher” synaesthetes (Hubbard & Ramachandran, Citation2005; Ramachandran & Hubbard, Citation2001b). “Lower” synaesthetes may not require attentive processing of inducing stimuli to elicit synaesthesia. “Higher” synaesthetes require attentive processing of inducing stimuli and therefore may not show an advantage on the Embedded Figures Task.
The term “pop-out” is grounded in the visual search literature, where a target defined by a unique basic feature (such as colour) is detected in a highly efficient manner (Treisman & Gelade, Citation1980). Typically, this is demonstrated by a relatively flat “search slope”, where reaction time (RT) increases little, if at all, with increasing numbers of distracting items. The original Embedded Figures Task did not manipulate set size and had the displays present for 1 second, which removes any degree of certainty that the items are not attentively processed. Other studies, however, have used more classic visual search paradigms to address this question. Palmeri et al. Citation(2002) tested a synaesthete (W.O.) using a visual search task where the target digit elicited either a distinct synaesthetic colour relative to the distractors (2 among 5s), or a similar synaesthetic colour to the distractors (8 among 6s). Relative to nonsynaesthetic controls, W.O. showed significantly shorter RTs in the distinct colour condition, but not in the similar colour condition, leading the authors to propose that synaesthetic colours were assisting in the task. However, the search slope in the “2 among 5s” condition was not flat as would be the case in true pop-out results derived from displays with physical colour differences (Palmeri et al., Citation2002). In addition, in a condition where the distractors did not induce synaesthesia (but the target still should), there was no difference between W.O. and controls. The authors therefore suggested that W.O. may be more efficient in rejecting distracting letters due to his synaesthetic colours, rather than the target attracting attention due to its unique synaesthetic colour.
Laeng and colleagues (Laeng, Svartdal, & Oelmann, Citation2004) also found an advantage for a synaesthete (P.M.) over nonsynaesthetic controls on a difficult visual search task. In a thorough analysis, however, they showed that this effect came from trials in which the target was close to the central fixation, consistent with the notion that synaesthesia elicited by an attended letter can assist in decision making, rather than attention being attracted by synaesthetic colours from unattended letters. Subsequently, Laeng (Citation2009) tested P.M. and another synaesthete on a similar task but recorded the distance between the synaesthetic colours in colour space. He reported effective search under conditions where the synaesthetic colours were distant but not when they were similar, raising the possibility that her synaesthesia could, under some conditions, cause pop-out.
Other visual search studies have failed to find any advantage for synaesthetes. Edquist et al. Citation(2006) tested 14 synaesthetes and matched controls on displays in which the target was defined by a unique synaesthetic colour (black items) or an actual colour. There was no evidence that individual synaesthetes were more efficient than their controls in black displays, although both synaesthetes and nonsynaesthetes showed efficient search (flat search slopes) for the coloured displays. Similarly, Sagiv et al. (Citation2006) tested two synaesthetes with either synaesthesia-inducing or noninducing targets. In neither condition were the synaesthetes different from the control participants.
Returning now to the Embedded Figures Task methodology (Ramachandran & Hubbard, Citation2001a), Rothen and Meier Citation(2009) tried to replicate the embedded figures effect with 13 synaesthetes, but failed to find any significant advantage in accuracy for the synaesthetes relative to controls. Ward, Jonas, Dienes and Seth (Citation2010) had more success, showing a group-level advantage for 36 synaesthetes over controls. The proportion of correct trials was around 40% (41.4% for synaesthetes compared to 31.5% for controls), however, which Ward et al. suggest is much lower than one would predict if the shape “popped out” due to the unique colour of the items. In addition, subjective reports by the synaesthetes did not show a clear link between seeing the graphemes as coloured during the task and objective performance. The descriptions were instead consistent with the synaesthetic colour only appearing for those items that were currently attended as the synaesthetes searched different areas of the display. Thus, although there may be an advantage to synaesthetes in the Embedded Figures Task, perhaps it does not derive from preattentive synaesthesia, but rather a more successful “grouping” of items or facilitating the decision to reject a group of items as distractors. Note, however, that this alternative interpretation relies heavily on synaesthetes' subjective reports of the extent to which the displays appeared coloured and the way in which these colours appeared. The primary aim of the current study is to objectively test the claim that synaesthetes' advantage in the Embedded Figures Task reflects preattentive pop-out.
There has been an increasing emphasis in the recent synaesthesia literature on the importance of individual differences and the possibility that there are subgroups with different performance profiles (Dixon, Smilek, Wagar, & Merikle, Citation2004; Hubbard, Arman, Ramachandran, & Boynton, Citation2005; Ward, Li, Salih, & Sagiv, Citation2007) and different neural underpinnings (Rouw & Scholte, Citation2007, Citation2010). In addition to the possible distinction between “higher” and “lower” synaesthetes, which is based on a proposed difference in the level at which an inducing stimulus triggers synaesthesia (Ramachandran & Hubbard, Citation2001b), Dixon et al. (Dixon, Smilek, & Merikle, Citation2004; Dixon, Smilek, Wagar, et al., 2004) have suggested that synaesthetes can be distinguished based on the locus of their experiences. They suggest that synaesthetes who report their colours as appearing “out in space” (projectors) are distinguishable (and should be distinguished) from those who see the colours in their “mind's eye” (associators; Dixon, Smilek, & Merikle, Citation2004). Based on early studies with projectors “C” and “J”, Smilek and colleagues suggested that projectors do not need to be aware of the identity of an inducer for synaesthesia to arise (Smilek, Dixon, Cudahy, & Merikle, Citation2001; Smilek, Dixon, & Merikle, Citation2003; Wagar, Dixon, Smilek, & Cudahy, Citation2002).
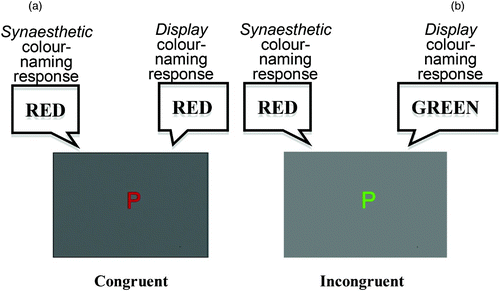
Dixon, Smilek, and Merikle Citation(2004) report that one can objectively discriminate between projectors and associators, a critical step in determining subgroups, by using two different versions of the now-classic Synaesthetic Congruency Task (e.g., Mattingley, Rich, Yelland, & Bradshaw, Citation2001; Mills, Boteler, & Oliver, Citation1999; Wollen & Ruggiero, Citation1983). Both the typical and Dixon, Smilek, and Merikle's reverse colour-naming tasks utilize letters presented in either the same colour as the synaesthetic colour that it elicits for a given synaesthete (congruent) or a different (incongruent) colour from the synaesthetic colour (see ). In the standard Synaesthetic Congruency Task, participants are asked to name the display colour as quickly as possible. When the synaesthetic colour elicited by the letter is incongruent with the display colour, naming times are slower than when the two colours match. In the reverse Synaesthetic Congruency Task, the synaesthetes are asked to name their synaesthetic colour for each letter. Incongruency between the display colour and the synaesthetic colour being named again may slow naming times relative to the congruent condition. Dixon, Smilek, and Merikle report that “projector” synaesthetes, as categorized by subjective report, show more interference from synaesthetic colours on display colour naming than in the reverse condition, while “associator” synaesthetes show more interference of display colours on synaesthetic colour naming than vice versa.
Figure 1. Example displays and correct responses for the two versions of the Synaesthetic Congruency Task. (a) A congruent trial (P is displayed in red and elicits a synaesthetic colour of red). (b) An incongruent trial (P is displayed in green, but elicits a synaesthetic colour of red). To view a colour version of this figure, please see the online issue of the Journal.
The aims of this study are to characterize our sample according to the Dixon, Smilek, Wagar, et al. (2004) dichotomy and then to look for evidence of “pop-out” from synaesthetic colours using a modification of the Embedded Figures Task. First, we use the tasks presented by Dixon, Smilek, Wagar, et al. (2004) to look for individual differences indicating that we have grapheme–colour synaesthetes who fall in the categories of “projector” and “associator”. Second, we objectively test the claim that the advantage seen for some synaesthetes in the Embedded Figures Task reflects “pop-out”. As we have an objective behavioural method to distinguish projectors and associators, we focus here on that categorization instead of the “higher” versus “lower” dichotomy. Ward et al. Citation(2010) reported that these distinctions appear to be independent; however, as both “lower” and “projector” synaesthetes are proposed to experience synaesthetic colours prior to attentive processing/conscious identification of an inducer (e.g., Ramachandran & Hubbard, Citation2001a, Citation2001b; Smilek et al., Citation2001; Smilek et al., Citation2003; Wagar et al., Citation2002), projectors should show pop-out in the classic Embedded Figures Task. These issues are important not just for synaesthesia research, they also have implications for the inferences we can draw from this research to more general questions of cognition. In particular, if we can find evidence that synaesthetic colours can be elicited prior to attentive processing, causing a similar effect to “real” colours (i.e., pop-out), this challenges long-held notions of the role that attention plays in our recognition of letters and linguistic stimuli, as well as the way we “bind” information together into objects for conscious perception.
We recorded detailed subjective reports and tested our synaesthetes intensively on the experimental paradigms that have been proposed to discriminate between subtypes of grapheme–colour synaesthetes (Dixon, Smilek, & Merikle, Citation2004). In our first experiment, we used the two versions of the Synaesthetic Congruency Task proposed by Dixon, Smilek, Wagar, et al. (2004) to distinguish “projector” and “associator” synaesthetes. In the second experiment, we used a novel modification of the Embedded Figures Task (Ramachandran & Hubbard, Citation2001a). We changed the stimuli for this task to more tightly control for potential stimulus confounds and to test for “pop-out” by varying the set size: If synaesthetic colours do cause pop-out, the time it takes to search the displays should be unaffected by set size.
To preempt our results, we found some significant differences between individual synaesthetes and matched controls but the pattern seemed to reliably identify only those classified as “projectors”, without providing clear evidence for distinct subgroups of grapheme–colour synaesthetes in our sample. We did have two synaesthetes who reported “projected” colours and showed the predicted pattern on the synaesthetic congruency tasks, and one synaesthete who showed an associator pattern, but the remaining five synaesthetes could not be reliably classified by the data, suggesting a continuum. We found that synaesthetes were indeed more accurate on the Embedded Figures Task than were controls, but there was no evidence of superior search efficiency and no support for the notion of preattentive synaesthesia. Thus, we suggest that the advantage for synaesthetes is likely to be due to higher level effects in grouping or decision-making processes.
General method
Participants
We tested eight grapheme–colour synaesthetes (7 females; all right-handed; age range = 33–61 years; mean age = 48.6 years, SD = 11.0 years) and eight control (nonsynaesthetic) participants matched for age, sex, and handedness (age range = 30–64 years, mean age 48.7 years, SD = 11.8 years). Every synaesthete had one matched nonsynaesthetic participant who was tested on the same stimuli as the synaesthete to control for any stimulus-level differences.
All participants had normal or corrected-to-normal visual acuity and normal colour vision. Synaesthetes completed two questionnaires. The first is our standard synaesthesia questionnaire that covers personal and demographic details, medical history, experiences of synaesthesia, and other characteristics, including a consistency measure (for details, see Mattingley et al., Citation2001; Rich et al., Citation2005). The second focused on the subjective experience of synaesthesia and the locus of synaesthetic colours for categorizing participants as “projectors” or “associators” (for details, see and Edquist et al., Citation2006). Controls completed a questionnaire to exclude synaesthesia.
Table 1. Subjective reports of synaesthetic colour experiences
General design and apparatus
All experiments were conducted on Dell computers running Windows XP SP2 on a Diamond Digital 1998E monitor with 1,024 × 768-pixel resolution. The testing sessions took place in a semidarkened room with subjects seated approximately 57 cm from the screen. Stimuli were presented on a grey background (RGB = [128 128 128]). All experiments were written in Matlab, using the Psychophysics Toolbox extensions (Brainard, Citation1997; Pelli, Citation1997).
The subjects did the two versions of the Synaesthetic Congruency Task and the modified Embedded Figures Task in a single testing session of 2–4 hours duration. The different tasks were counterbalanced in a partial Latin square design across synaesthetes. Each control performed the tasks in the same order as the appropriate synaesthete. Prior to the testing session, synaesthetes performed a colour-matching task in which they used a colour palette to identify the synaesthetic colour elicited by each letter of the alphabet. A subset of these colours was then used for that synaesthete and his or her matched control in all experiments.
Subjective classification questionnaire
The questionnaire regarding subjective experience of synaesthetic colours was used to classify the synaesthetes as “projectors” versus “associators” based on the question used by Dixon, Smilek, and Merikle Citation(2004). It also included questions that we have used previously (Edquist et al., Citation2006) to look at the locus of experiences in more detail.
shows the responses of the eight synaesthetes. Two synaesthetes (S6, S8) reported that the colour appeared “on the page” or “out in space”. The other six synaesthetes reported seeing their synaesthetic colours “in the mind's eye”. According to Dixon, Smilek, and Merikle Citation(2004) then, we should classify S6 and S8 as projectors, and the other synaesthetes as associators.
EXPERIMENT 1: THE SYNAESTHETIC CONGRUENCY TASK
Method
To test whether there was an objective basis to distinguish projectors and associators in our group, we used the two versions of the Synaesthetic Congruency Task described in Dixon, Smilek, Wagar, et al. (2004). A single coloured letter was presented centrally on the screen until response. The display colour was either the same as (congruent) or different from (incongruent) the synaesthetic colour elicited by the letter (). To construct the incongruent conditions, we selected a single nonmatching colour from the colour set (i.e., the colour of one of the other letters for that synaesthete). Each letter subtended 1.2° × 1.6° of visual angle. Participants responded through a microphone, and vocal onset times were recorded. Errors were scored manually. The stimuli were identical in the two versions of the task.
In the display colour-naming task, participants named the display colour as quickly as possible, ignoring any synaesthetic colours induced by the letters. In the synaesthetic colour-naming task, synaesthetes named their synaesthetic colour induced by the letter, ignoring the display colour. This task is only possible for synaesthetes; hence controls did not complete this version.
Each version of the task had 50 trials per condition (congruent, incongruent), randomly intermingled, divided into two blocks. Thus, synaesthetes completed four blocks (two for each version), and controls completed two blocks (display colour naming only). The order of the blocks was counterbalanced across synaesthetes.
Results
On average, 3.1% of the trials were discarded because of microphone errors. Both synaesthetes and controls had high accuracy on the display colour-naming task (synaesthetes, mean % correct = 98.5, SD = 2.1; controls, mean % correct = 98.1, SD = 1.5). On the synaesthetic colour-naming task, synaesthetes had high accuracy in naming the colour that they had previous nominated as associated with each letter (mean % correct = 99.4, SD = 1.1). Due to the low error rates, we did not analyse error responses. For all of the tasks in this paper, only correct RTs were analysed, and only outliers that reflected anticipations (<150 ms) or failures to respond (>4,000 ms) were removed prior to analysis (<0.01% of trials for all tasks).
shows the mean correct RTs for each individual plus the group averages for both colour-naming tasks. The figure shows that synaesthetes were slower in incongruent (black bars) than congruent (white bars) trials in both versions (, 2c), while controls showed no effects of synaesthetic congruency on display colour-naming times (. A mixed analysis of variance (ANOVA) with the within-subjects factor of congruency (congruent, incongruent) and the between-subjects factor of group (synaesthetes, controls) on the display colour-naming RTs (averages, , 2b) confirmed a significant main effect of congruency, F(1, 14) = 18.310, p = .001, a significant main effect of group, F(1, 14) = 5.302, p = .037, and a significant Congruency × Group interaction, F(1, 14) = 11.969, p = .004. Simple main effects by group demonstrated that synaesthetes were slower on incongruent than on congruent trials (p < .001) but there was no difference for controls (p = .572). The synaesthetic colour-naming RTs ( followed the “reverse” effect reported by Dixon, Smilek, Wagar, et al. (2004) where display colours influence the colour-naming speed of synaesthetic colours: Synaesthetes showed significant effect of congruency, F(1, 7) = 96.99, p < .001, with incongruent trials being slower than congruent trials.
Figure 2. Results from the two versions of the Synaesthetic Congruency Task. The congruent condition is shown with white bars and incongruent with black bars. Error bars show the standard error of the mean. (a) Individual synaesthete (S) reaction times (RTs) with the group average (right of graph) for naming display colours; (b) individually matched control RTs with the group average (right of graph) for naming display colours; (c) individual synaesthete RTs with the group average (right of graph) for naming the synaesthetic colours; (d) scatterplot showing the relationship between the scores on the two different colour naming tasks for individual synaesthetes. We would expect “projectors” to fall to the right of the graph, showing greater impact of synaesthetic colours on display colour naming than the reverse, whereas “associators” should be in the upper portion, showing greater impact of display colours on synaesthetic colour naming than the reverse. The solid line is the linear regression through the average (not significantly different from zero, F < 1). Dotted lines are the 95% confidence intervals around the slope.
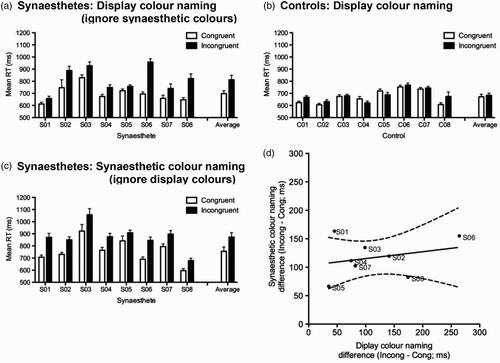
The important analyses for these data are at an individual level. Dixon, Smilek, Wagar, et al. (2004) suggest that “projector” synaesthetes show more interference from synaesthetic colours on display colour naming ( than interference from display colours on synaesthetic colour naming (. Another way to put this is that the magnitude of the effect (incongruent – congruent difference) should be significantly greater for the display colour-naming task than for the synaesthetic colour-naming task (. “Associator” synaesthetes should show the reverse pattern, with greater interference from display colours on synaesthetic colour naming than vice versa (incongruent – congruent difference for synaesthetic colour-naming task should be greater than that for the display colour-naming task; . Either of these patterns would show up as a significant interaction between the tasks and the congruency of the stimuli in an independent-measures ANOVA on the individual data from each synaesthete.
For each individual synaesthete, we conducted an independent-measures ANOVA with the factors of task (synaesthetic colour naming vs. display colour naming) and congruency (congruent, incongruent).Footnote1 Of the eight synaesthetes, only two showed a significant interaction (S1 and S6, p < .05), with another showing a strong trend (S8, p = .058). If we look back at , we can see that for S1 there is a greater congruency effect on synaesthetic colour naming than on display colour naming (“associator” pattern) whereas S6 and S8 show the opposite (“projector” pattern). These results are consistent with the classification based on subjective report. The remaining five synaesthetes showed no significant interactions.Footnote2 This may suggest that although the pattern can be helpful in identifying projectors, the reverse pattern is not necessarily appropriate for identifying associators. Instead, they seem to fall under a “not projectors” category (see Ward et al., Citation2007, for discussion of a third possible category), or illustrate a continuum rather than a clear dichotomy.
EXPERIMENT 2: MODIFIED EMBEDDED FIGURES TASK
The aim of this experiment was to directly test the hypothesis that the advantage for synaesthetes seen in some studies using the Embedded Figures Task reflects “pop-out” by manipulating set size, as well as to see whether the performance patterns of individuals are related to performance on the two versions of the Synaesthetic Congruency Task used in Experiment 1.
Method
We modified the original Embedded Figures Task in three important ways. First, we controlled the number of elements and area covered by the embedded shapes by only using a single figure (a triangle) that could face either left or right (), making it a two-alternative forced-choice task. Second, we manipulated the number of distracting items in the display (“set size”) to examine search efficiency, a key issue in any claim of pop-out. Finally, in addition to the usual black letter condition (where all the items in the display are black), we included: (a) a coloured condition, with the letters coloured congruently for the particular synaesthete, to demonstrate the pattern of results to be expected from a shape defined by a unique display colour; and (b) a noninducing distractor condition, with nonsense (nonletter) distractors, to assess whether having the target items as synaesthetic inducers was sufficient to assist the synaesthetes, should any advantage be present in the black letter condition.
Figure 3. Example displays from the modified Embedded Figures Task. (a) Black letter condition, all set sizes (9, 27, 45, 64). (b) Coloured letter condition, set size 64. (c) Distractors nonletter black condition, set size 64 (the Ps are in white, and the Bs are in orange). To view a colour version of this figure, please see the online issue of the Journal.
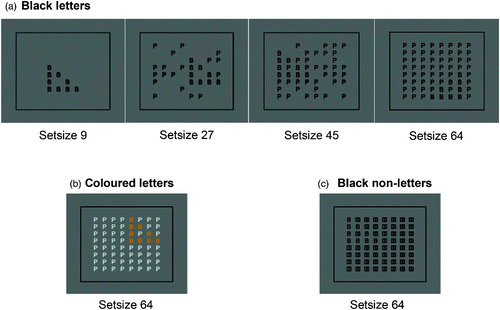
The target in the visual search was a triangle made up of one type of letter (e.g., Bs) embedded in distracting letters (e.g., Ps, ) placed on an invisible 8 × 8 grid. Each synaesthete (and matched control) had one unique target/distractor pair, plus one nonsense (noninducing) symbol. The task was to decide whether the triangle faced left or right and to press one of two keys as quickly as possible. The display was on until response or for a maximum of 10 s.
Each item in the display subtended 0.65° × 0.85° of visual angle. The entire display was 13.5° × 10.5°, framed by a black line, in total covering a space of 19° × 15°. We avoided the peripheral sections of the display in line with Ramachandran and Hubbard's (2001a) design.
We varied the set size between 9, 27, 45, and 64 items (including the target, which was always composed of 9 items; see ). The three versions (black letters, coloured letters, noninducing distractors) were presented in separate blocks, each with 160 trials (40 trials for every set size). The different set sizes were randomly intermingled within blocks, and the order of the blocks was counterbalanced across subjects.
Results
(a) Black letters
shows the group RT (upper panel) and error data (lower panel), plotted by set size. Group analysis on correct RTs showed that both groups were significantly affected by set size, F(1.17, 16.34) = 27.508, p < .001, but there were no effects of group (F < 1, ns) and no interaction (F < 1, ns).
Figure 4. Group reaction times (RTs, in ms; upper panels) and error rates (%; lower panels) for the modified Embedded Figures Task. Synaesthetes: filled squares. Controls: open circles. (a) Both the letters composing the target triangle and distractor letters were presented in black. Asterisk denotes the significant difference between synaesthete and control errors at set size 64 (p = .005). (b) The target triangle was composed of a letter in one colour while distractors were a letter in another colour (both congruent for the synaesthete). There was a trend (p = .066) for synaesthetes to be more accurate than controls. (c) Both the target and distractor items were black, but the distractors were repetitions of a single nonsense symbol. Error bars are standard errors of the mean. Note chance performance would be 50% in this task.
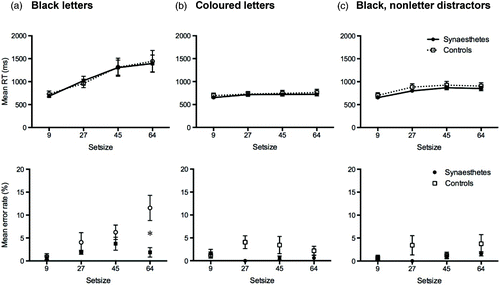
A mixed ANOVA on the percentage correct with the factors of group (synaesthetes, controls) and set size (9, 27, 45, 64) revealed a significant main effect of set size, F(1, 3) = 8.69, p < .001, a significant effect of group, F(1, 14) = 4.86, p = .045, and a significant interaction, F(1, 3) = 6.00, p = .002. Subsequent simple main effects analyses revealed that synaesthetes were significantly more accurate at set size 64 (p = .005), but differences did not reach significance at any other set size (all ps > .2; although as error rates were overall low, the lack of significance at the other set sizes may reflect a ceiling effect).
We also calculated the search slopes for each individual using linear regression. Search slopes provide a measure of the efficiency of search, with typical pop-out searches for unique colours having slopes close to zero (Wolfe & Horowitz, Citation2004). The synaesthetes had a mean slope of 13.29 ms/item (SD = 8.99). The controls had a mean slope of 13.57 ms/item (SD = 10.55). An independent-samples t test showed there was no difference between the groups, t(14) = 0.10, p = .93.
From the group data, we have no evidence that synaesthetes are faster or more efficient than controls in detecting embedded figures, but they are more accurate at the largest set size. Although we have no a priori way to distinguish them, Ramachandran and Hubbard Citation(2001b) suggest that only “lower” synaesthetes will show an advantage in detecting embedded figures. Similarly, the projector versus associator distinction predicts that only projectors would show advantages from synaesthetic colours in this type of task. Thus, we need to look at the individual data for evidence of synaesthetic pop-out. We therefore analysed individual RT data, comparing each synaesthete and matched control (). These analyses showed significant differences for all but Pair 1, but not in a consistent direction. Effects that were significant at p < .05 are shown with an asterisk in . Only two synaesthetes are clearly faster than their matched controls (S2 and S8). S5 is faster than her control at set size 9 but slower at set size 45. Finally, there were four synaesthetes who were significantly slower than their matched controls for at least two set sizes (S3, S4, S6, S7). Importantly, all subjects showed a significant effect of set size, demonstrating that performance does not fit a classic pop-out pattern. For 7 out of 8 synaesthete–control pairs, there were no significant differences in search efficiency (all ps > .209). S8, however, had a significantly shallower search slope than her control, χ(1) = 7.08, p = .008.
Figure 5. Mean reaction times (RTs, in ms) for individual synaesthetes (S) and controls (C) for the black letter version of the modified Embedded Figures Task. Each panel shows a synaesthete/control pair, starting from the top left with Pair 1. Synaesthetes: filled squares, solid line. Controls: open circles, dashed line. Note the different scale for Pairs 3 and 8. Asterisks denote significant differences between synaesthete and control based on post hoc pairwise comparisons for each set size (p < .05) for those analyses that showed a significant interaction between subject and set size.
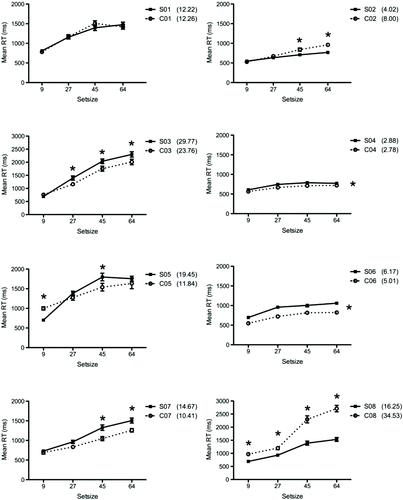
Overall, then, we have no evidence at a group level that there is pop-out from synaesthetic colours, and the evidence at the individual level is slight. We have perhaps one synaesthete (S8) who has an advantage over her respective control, but we also have four synaesthetes (S3, S4, S6, S7) who are significantly slower than their controls. In addition, examination of the RT data for S8/C8 shows that the synaesthete has a similar pattern to that of the other subjects, with a graded increase in RT as set size increases. C8, on the other hand, has a big jump in RT between the middle two set sizes. We cannot, therefore, discount the possibility that the significant RT advantage for S8 is actually due to C8 finding the task unusually difficult at the larger set sizes.
(b) Coloured letters
Both synaesthetes and controls had high accuracy (synaesthetes, mean % correct = 99.3, SD = 0.7; controls, mean % correct = 97.3, SD = 1.5). The group results of this version of the task are shown in , with mean RTs (upper panel) and error rates (lower panel) plotted against set size. A mixed ANOVA on the correct RTs with the factors of group (synaesthetes, controls) and set size (9, 27, 45, 64) revealed a significant effect of set size, F(1.95, 27.28) = 13.35, p < .001, but no significant effect of group (F < 1, ns) and no interaction (F < 1, ns). A mixed ANOVA on the percentage correct with the factors of group (synaesthetes, controls) and set size (9, 27, 45, 64) revealed no main effect of set size (F < 1, ns), a trend for an effect of group, F(1, 14) = 3.98, p = .066, and a weaker trend for an interaction, F(1, 3) = 2.44, p = .077. Again it seems likely that both groups are performing so well, it could mask potential differences. If we accept the group trend, then synaesthetes were more accurate than controls on this task also, where no search was required but rather just a decision about the direction of the grouping.
We again calculated search slopes for these data. Synaesthetes had a mean slope of 1.20 ms/item (SD = 0.72). Controls had a mean slope of 1.15 ms/item (SD = 1.43). An independent-samples t test showed no difference between the groups, t(14) = 0.92, p = .38. The shallow slope demonstrates that when the target shape is defined by colour in the display, the embedded shape does indeed “pop out” such that additional distractors have no effect.
(c) Black nonletter distractors
Both synaesthetes and controls had high accuracy (synaesthetes, mean % correct = 99.2, SD = 0.5; controls, mean % correct = 97.7, SD = 1.7). The group RT and error data are shown in , plotted by set size. A mixed ANOVA with the factors of group (synaesthetes, controls) and set size (9, 27, 45, 64) revealed a significant main effect of set size, F(1.86, 26.08) = 71.04, p < .001, but no effect of group (F < 1, ns) and no interaction (F < 1, ns). A mixed ANOVA on the percentage correct with the factors of group (synaesthetes, controls) and set size (9, 27, 45, 64) revealed no main effect of set size, F(1, 3) = 1.60, p = .203, no main effect of group, F(1, 14) = 2.14, p = .165, and no interaction, F(1, 3) = 1.37, p = .270.
Synaesthetes had a mean slope of 3.62 ms/item (SD = 1.30). Controls had a mean slope of 3.56 ms/item (SD = 1.59). An independent-samples t test on the mean slopes revealed no significant differences in search efficiency between synaesthetes and controls, t(14) = 0.06, p = .95. These shallow search slopes demonstrate that there was sufficient difference between the target letters and the nonletter distractors to allow the embedded shape to “pop out”, with little impact from the number of distracting elements.
Discussion
The primary aim of this study was to look for evidence of pop-out caused by synaesthetic colours in individuals with grapheme–colour synaesthesia, using measures of the popular division of “projectors” versus “associators” suggested by Dixon, Smilek, and Merikle Citation(2004) to characterize our sample. The subjective reports given by our synaesthetes demonstrated considerable individual variation. Such reports are clearly different from the experiences of the general population, but here we tested whether the variation between synaesthetes is important for explorations of the cognitive mechanisms underlying their unusual experiences. Based on the subjective reports, two of our group could be categorized as “projectors”, while the rest were “associators”. Of the two synaesthetes who reported to see their colours “out in space”, both could be objectively classified as a “projector” based on the synaesthetic congruency task suggested by Dixon, Smilek, and Merikle Citation(2004). Five of six of the remaining synaesthetes who all subjectively reported seeing the synaesthetic colours in their “mind's eye” could not be classified reliably based on the objective data. The tasks suggested by Dixon, Smilek, and Merikle (Citation2004) therefore worked to identify “projectors” but could not reliably categorize “associators”, instead perhaps identifying “nonprojectors” rather than a homogenous group (see Ward et al., Citation2007). Alternatively, we may be seeing this pattern of data because synaesthetes fall along a continuum rather than into a dichotomy.
The location of the synaesthetic colour in space is one possible determinant of the data pattern seen on the synaesthetic congruency task. Ward et al. Citation(2007) suggest that such patterns are due to a difference in shifting attention from the locus of the inducer to the colour in “associators” that is not necessary for “projectors”. Dixon, Smilek, and Merikle Citation(2004), in contrast, discuss the relative automaticity of the synaesthetic colours, with “projectors” experiencing synaesthesia more automatically than “associators”. In addition, the same pattern of results would occur if one factored in more or less intensity or strength of synaesthetic colours (also discussed by Dixon, Smilek, Wagar, et al., 2004). For example, one might expect that synaesthetes who describe their colours as being projected out in space might have stronger, more intense, synaesthetic colours than those that get a “sense of colour” or report it as appearing in their mind's eye. Thus, it seems premature to subdivide synaesthetes based on these data patterns when, first, the objective data fail to convincingly classify the majority of synaesthetes in our sample, and, second, we do not know whether the mechanism proposed to differ between the groups is categorical or continuous.
Turning now to the claim that synaesthetes can experience pop-out from their synaesthetic colours, we did not see any group-level effects in RT that suggest that synaesthetic colours can guide attention like real colours. Even at an individual level, the embedded figures data primarily reflected situations where synaesthetes were slower than their matched controls in doing the task. However, we do replicate Ramachandran and Hubbard's (2001a; Hubbard et al., Citation2005) previous findings with accuracy data: Synaesthetes were more accurate than controls in the largest set size of the black letter condition.
At an individual level, search slopes for the black letter condition were not different for seven out of eight synaesthete–control pairs. Interestingly, the one synaesthete who performed significantly better than her matched control in both RT and search efficiency was S8, who also showed the “projector” pattern on the Synaesthetic Congruency Task. This synaesthete still had a significant effect of increasing set size (and an unusually slow control), however, failing to provide evidence for pop-out. There are apparent differences in search efficiency across subjects due to the differences in stimuli and age (note that the control was matched to each synaesthete), but we do not see “pop-out” for a synaesthete without similar shallow search slopes in the control (i.e., where it is due to shape information rather than a synaesthetic colour).
Overall then, we have evidence that, as a group, synaesthetes are more accurate in the black letter condition than controls at the largest set size. It is possible this is a general effect that is masked due to the ceiling performance at the smaller set sizes. Intriguingly, there was also a trend for an overall advantage for synaesthetes over controls when the shape was defined by display colour ( implies that this may be due to differences at the middle set sizes, but there is only a weak trend for an interaction, so we are not able to analyse this statistically). These coloured “control” condition results suggest that synaesthetes also have a tendency to be more accurate than controls under conditions where the items actually do “pop out”. Here, the task still requires some grouping of items to distinguish the two shapes. This, in combination with the lack of any strong effects of synaesthesia on RT or search efficiency, suggests one of two explanations: first, that the advantage for synaesthetes is in grouping the elements together rather than finding them in the first place; or, second, that synaesthetes are more motivated to do the task and therefore perform slightly better under all conditions. Although we cannot discount the possibility that the these effects may be due to an overall greater motivation or concentration by synaesthetes than controls, there was no such difference in the second control condition, where the distractors were nonletters (cf. ceiling effects), making it a reasonable hypothesis that synaesthetes may be able to strategically use their colour to group similar items more effectively than do nonsynaesthetes.
As recently raised by others (Gheri et al., Citation2008; Rothen & Meier, Citation2009), the variance in individual datasets raises the concern that studies in which one or two synaesthetes are tested may not be generalizable to the population of synaesthetes. Any emphasis on subdivisions and categories should highlight the need for reasonable sample sizes, even if advocating a (multiple) single case study approach. In turn, we need to include a caveat in our conclusion: We may have insufficient power to detect subtle RT differences. However, the claim that the accuracy advantage of synaesthetes in the Embedded Figures Task is due to pop-out can clearly be refuted with this sample. We replicate the advantage in accuracy, but there are no synaesthetes who do not show the normal significant effect of set size.
Overall, there is a clear difference between grapheme–colour synaesthetes and nonsynaesthetes in their subjective reports when presented with letters and numbers. Consistency in synaesthetes' reports (e.g., synaesthetes report these colours existing as long as they can remember; the colour reports tend to be highly consistent over time) make it reasonable to assume they are different from the rest of the population at some level. The current data demonstrate, however, that synaesthetes are fundamentally similar to nonsynaesthetes in the way they deploy attention in cluttered displays, showing no evidence of pop-out from synaesthetic colours. Any advantage seems to lie in being able to use their synaesthesia to group similar items slightly more effectively than do nonsynaesthetes, suggesting involvement of higher cognitive strategies.
Acknowledgments
We thank Chris Hammond and David Fencsik for programming assistance, and Rocco Chiou and Margery Pardey for comments on the manuscript. A.N.R. is supported by the Australian Research Council (DP0984494) and the Menzies Foundation. Conflict of interest: Nil.
Notes
1It is difficult to directly analyse the comparison of interest—namely, the magnitude of the difference between incongruent and congruent trials in the two tasks—at an individual level. Here, we look for an interaction in Task × Congruency using an independent-measures ANOVA. As the data come from a single individual, we checked for autocorrelation of RTs. In all but four cases (out of 96 performed correlations) the assumption of independence was valid.
2It is of course possible that this reflects a need for more trials per participant (i.e., a lack of power to detect interactions). There were no hints in the statistics, however, even for a trend (F < 1 for all analyses of the interaction terms), despite most synaesthetes showing a significant congruency effect across the two tasks (i.e., a main effect of congruency).
REFERENCES
- Barnett , K. J. , Finucane , C. , Asher , J. E. , Bargary , G. , Corvin , A. P. , Newell , F. N. and Mitchell , K. J. 2008 . Familial patterns and the origins of individual differences in synaesthesia . Cognition , 106 : 871 – 893 . doi:10.1016/j.cognition.2007.05.003 (doi:10.1016/j.cognition.2007.05.003)
- Brainard , D. H. 1997 . The Psychophysics Toolbox . Spatial Vision , 10 ( 4 ) : 433 – 436 . doi:10.1163/156856897X00357 (doi:10.1163/156856897X00357)
- Dixon , M. J. , Smilek , D. and Merikle , P. M. 2004 . Not all synaesthetes are created equal: Projector versus associator synaesthetes . Cognitive, Affective, & Behavioral Neuroscience , 4 ( 3 ) : 335 – 343 . doi:10.3758/CABN.4.3.335 (doi:10.3758/CABN.4.3.335)
- Dixon , M. J. , Smilek , D. , Wagar , B. and Merikle , P. M. 2004 . “ Grapheme–colour synaesthesia: When 7 is yellow and D is blue ” . In Handbook of multisensory integration , Edited by: Calvert , G. , Spence , C. and Stein , B. 837 – 849 . Cambridge , MA : MIT Press .
- Edquist , J. , Rich , A. N. , Brinkmann , C. and Mattingley , J. B. 2006 . Do synaesthetic colours act as unique features in visual search? . Cortex , 42 ( 1 ) : 221 – 231 . doi:10.1016/S0010-9452(08)70347-2
- Gheri, C., Chopping, S., & Morgan, M.J. (2008). Synaesthetic colours do not camouflage form in visual search. Proceedings of the Royal Society of Biology, 275, 841–846. doi: 10.1098/rspb.2007.1457
- Grossenbacher , P. G. and Lovelace , C. T. 2001 . Mechanisms of synesthesia: Cognitive and physiological constraints . Trends in Cognitive Sciences , 5 ( 1 ) : 36 – 41 . (doi:10.1016/S1364-6613(00)01571-0)
- Hubbard, E. M., Arman, A. C., Ramachandran, V. S., & Boynton, G. M. (2005). Individual differences among grapheme-color synesthetes: Brain-behavior correlations. Neuron, 45(6), 975–985. DOI 10.1016/j.neuron.2005.02.008
- Hubbard , E. M. and Ramachandran , V. S. 2005 . Neurocognitive mechanisms of synesthesia . Neuron , 48 : 509 – 520 . doi:10.1016/j.neuron.2005.10.012 (doi:10.1016/j.neuron.2005.10.012)
- Laeng, B. (2009). Searching through synaesthetic colors. Attention, Perception & Psychophysics, 71(7), 1461–1467. doi:10.3758/APP.71.7.1461
- Laeng , B. , Svartdal , F. and Oelmann , H. 2004 . Does color synesthesia pose a paradox for early-selection theories of attention? . Psychological Science , 15 ( 4 ) : 277 – 281 . doi:10.1111/j.0956-7976.2004.00666.x (doi:10.1111/j.0956-7976.2004.00666.x)
- Mattingley , J. B. , Rich , A. , Yelland , G. and Bradshaw , J. L. 2001 . Unconscious priming eliminates automatic binding of colour and alphanumeric form in synaesthesia . Nature , 410 : 580 – 582 . doi:10.1038/35069062 (doi:10.1038/35069062)
- Mills , C. B. , Boteler , E. H. and Oliver , G. K. 1999 . Digit synaesthesia: A case study using a Stroop-type test . Cognitive Neuropsychology , 16 ( 2 ) : 11 doi:10.1080/026432999380951 (doi:10.1080/026432999380951)
- Palmeri , T. , Blake , R. , Marois , R. , Flanery , M. A. and Whetsell , W. Jr . 2002 . The perceptual reality of synesthetic colors . Proceedings of the National Academy of Sciences , 99 ( 6 ) : 4127 – 4131 . doi:10.1073/pnas.022049399 (doi:10.1073/pnas.022049399)
- Pelli , D. G. 1997 . The VideoToolbox software for visual psychophysics: Transforming numbers into movies . Spatial Vision , 10 ( 4 ) : 437 – 442 . doi:10.1163/156856897X00366 (doi:10.1163/156856897X00366)
- Ramachandran , V. S. and Hubbard , E. M. 2001a . Psychophysical investigations into the neural basis of synaesthesia . Proceedings of the Royal Society , 268 ( 1470 ) : 979 – 983 . doi:10.1098/rspb.2000.1576 (doi:10.1098/rspb.2000.1576)
- Ramachandran , V. S. and Hubbard , E. M. 2001b . Synaesthesia—A window into perception, thought and language . Journal of Consciousness Studies , 8 ( 12 ) : 3 – 34 .
- Rich , A. , Bradshaw , J. L. and Mattingley , J. B. 2005 . A systematic, large-scale study of synaesthesia: Implications for the role of early experience in lexical–colour associations . Cognition , 98 ( 1 ) : 53 – 84 . (doi:10.1016/j.cognition.2004.11.003)
- Rich , A. and Mattingley , J. B. 2002 . Anomalous perception in synaeshtesia: A cognitive neuroscience perspective . Nature Reviews , 3 : 43 – 52 . doi:10.1038/nrn702 (doi:10.1038/nrn702)
- Rothen , N. and Meier , B. 2009 . Do synesthetes have a general advantage in visual search and episodic memory? A case for group studies . Plos One , 4 ( 4 ) doi:10.1371/Journal.Pone.0005037 (doi:10.1371/journal.pone.0005037)
- Rouw , R. and Scholte , H. S. 2007 . Increased structural connectivity in grapheme–color synesthesia . Nature Neuroscience , 10 ( 6 ) : 792 – 797 . doi:10.1038/nn1906 (doi:10.1038/nn1906)
- Rouw , R. and Scholte , H. S. 2010 . Neural basis of individual differences in synesthetic experiences . Journal of Neuroscience , 30 ( 18 ) : 6205 – 6213 . doi:10.1523/JNEUROSCI.3444-09.2010 (doi:10.1523/JNEUROSCI.3444-09.2010)
- Sagiv , N. , Heer , J. and Robertson , L. 2006 . Does binding of synesthetic color to the evoking grapheme require attention? . Cortex , 42 ( 2 ) : 232 – 242 . doi:10.1016/S0010-9452(08)70348-4 (doi:10.1016/S0010-9452(08)70348-4)
- Sagiv , N. , Simner , J. , Collins , J. , Butterworth , B. and Ward , J. 2006 . What is the relationship between synaesthesia and visuo-spatial number forms? . Cognition , 101 ( 1 ) : 114 – 128 . (doi:10.1016/j.cognition.2005.09.004)
- Simner , J. , Mulvenna , C. , Sagiv , N. , Tsakanikos , E. , Witherby , S. A. , Fraser , C. and Ward , J. 2006 . Synaesthesia: The prevalence of atypical cross-modal experiences . Perception , 35 : 1024 – 1033 . doi:10.1068/p5469 (doi:10.1068/p5469)
- Smilek , D. , Dixon , M. J. , Cudahy , C. and Merikle , P. M. 2001 . Synaesthetic photisms influence visual perception . Journal of Cognitive Neuroscience , 13 ( 7 ) : 930 – 936 . (doi:10.1162/089892901753165845)
- Smilek , D. , Dixon , M. J. and Merikle , P. M. 2003 . Synaesthetic photisms guide attention . Brain and Cognition , 53 : 364 – 367 . (doi:10.1016/S0278-2626(03)00144-1)
- Synesthesia List: http://www.daysyn.com/Synesthesia-List.html
- Treisman , A. M. and Gelade , G. 1980 . A feature-integration theory of attention . Cognitive Psychology , 12 ( 1 ) : 97 – 136 . (doi:10.1016/0010-0285(80)90005-5)
- Wagar , B. M. , Dixon , M. J. , Smilek , D. and Cudahy , C. 2002 . Colored photisms prevent object-substitution masking in digit-color synesthesia . Brain and Cognition , 48 ( 2–3 ) : 606 – 611 .
- Ward , J. , Jonas , C. , Dienes , Z. and Seth , A. 2010 . Grapheme–colour synaesthesia improves detection of embedded shapes, but without pre-attentive “pop-out” of synaesthetic colour . Proceedings of the Royal Society , 277 ( 1684 ) : 1021 – 1026 . doi:rspb. 2009.1765 (doi:10.1098/rspb.2009.1765)
- Ward , J. , Li , R. , Salih , S. and Sagiv , N. 2007 . Varieties of grapheme–colour synaesthesia: A new theory of phenomenological and behavioural differences . Consciousness and Cognition , 16 ( 4 ) : 913 – 931 . doi:S1053-8100(06)00102-4 (doi:10.1016/j.concog.2006.09.012)
- Wolfe , J. M. and Horowitz , T. S. 2004 . What attributes guide the deployment of visual attention and how do they do it? . Nature Reviews Neuroscience , 5 ( 6 ) : 495 – 501 . doi:10.1038/Nrn1411 (doi:10.1038/nrn1411)
- Wollen , K. A. and Ruggiero , F. T. 1983 . Colored-letter synesthesia . Journal of Mental Imagery , 7 ( 2 ) : 4