
ABSTRACT
We report the study of a woman who perceives 2D bounded regions of space (“shapes”) defined by sharp edges of medium to high contrast as if they were rotated by 90, 180 degrees around their centre, mirrored across their own axes, or both. In contrast, her perception of 3D, strongly blurred or very low contrast shapes, and of stimuli emerging from a collection of shapes, is intact. This suggests that a stage in the process of constructing the conscious visual representation of a scene consists of representing mutually exclusive bounded regions extracted from the initial retinotopic space in “shape-centered” frames of reference. The selectivity of the disorder to shapes originally biased toward the parvocellular subcortical pathway, and the absence of any other type of error, additionally invite new hypotheses about the operations involved in computing these “intermediate shape-centered representations” and in mapping them onto higher frames for perception and action.
Introduction
Visual perception begins when photons enter the eye. After initial processing in the retina, ganglion cells convey image-based information (local spatiotemporal changes in colour or luminance) to the brain. Most information reaches the primary visual cortex via axons from magnocellular (large-celled) and parvocellular (small-celled) ganglion cells bundled in the optic nerve. Although these two types of cells carry largely overlapping information, most magnocellular cells are achromatic and have relatively large receptive fields, making them very sensitive to rapid and/or subtle discontinuities in luminance (e.g., to edges defined by low luminance contrast), including when they occur over a larger space (e.g., blurred edges). Parvocellular cells have complementary properties: they carry chromatic information and have relatively smaller receptive fields, which makes them particularly sensitive to larger differences in luminance occurring over a finer spatial scale (e.g., sharp and high-contrast edges). At the level of the primary visual cortex, this information is encoded in terms of a retinotopically organized map of visual primitives (local spatial frequency patches, edges, blobs, bars, terminators) (De Valois et al., Citation1982; Felleman & Van Essen, Citation1991; Hubel & Wiesel, Citation1962; Wandell et al., Citation2007). A few tens of milliseconds later, we perceive objects (e.g., dogs, faces, forks) and their relative location and orientation with respect to our bodies and other objects in the environment (Colby, Citation1998; Connor & Knierim, Citation2017; McKyton & Zohary, Citation2007; Melcher & Morrone, Citation2015; Milner & Goodale, Citation2006). Our conscious perception of the world remains stable across eye movements and although a stationary vertical line moves and rotates in retinotopic coordinates when we move and rotate our head, phenomenally, it remains vertical and stationary. A fundamental question concerns the mechanisms involved in this transformation of visual information from primitives in a retinocentric coordinate system to oriented objects in spatiotopic and body-centred coordinate systems.
This question has been tackled using a range of different approaches (computational, psychophysical, behavioural, physiological, neuropsychological) by researchers aiming to develop computational theories of object recognition (e.g., Biederman, Citation1987; Marr & Nishihara, Citation1978; Riesenhuber & Poggio, Citation2000), to discover the principles guiding perceptual organization (Palmer & Rock, Citation1994; Wagemans et al., Citation2012), the functional architecture of the visual system (e.g., Cowey & Vaina, Citation2000; Hubel & Wiesel, Citation1962; Livingstone & Hubel, Citation1987), or to specify the nature of visual representations along the visual cortex (e.g., Connor & Knierim, Citation2017; Milner & Goodale, Citation2006; Pasupathy & Connor, Citation2001).
Four key ideas that have emerged from this work dominate current thinking about the stages intervening between visual input and the subjective experience of objects in the world. The first is the overarching concept of hierarchical processing: it is widely assumed that this transformation involves several successive stages that progressively aggregate the retinotopically-organized primitives represented in the primary visual cortex to form increasingly complex representations of the visual scene, ultimately resulting in object representations in spatiotopic and body-centred coordinates (e.g., Ricci & Serre, Citation2020; Ungerleider & Bell, Citation2011).
The second key idea is the hypothesis that one intermediate step likely consists of segmenting the visual scene in a series of mutually exclusive 2 dimensional “surfaces” or “regions” (Chainay & Humphreys, Citation2001; Hummel, Citation2001; Leek, Reppa, & Arguin, Citation2005; Marr & Nishihara, Citation1978; Nakayama et al., Citation1995). This idea has been explicitly developed by Palmer and Rock (Citation1994) who proposed that an intermediate stage between edge detection and consciously perceived objects consists of a representation of mutually exclusive “connected regions of uniform image properties” (such as luminance, colour or texture) identified by segmentation processes operating on the 2D retinal image—a principle called “uniform connectedness” (see also Tse & Palmer, Citation2012). Support for this proposal comes notably from neuropsychological studies of brain-damaged patients suffering from “object-based” simultanagnosia or neglect. Patients with “object-based” simultanagnosia typically behave as if they can only see one “object” at a time. In line with Palmer and Rock’s idea, it has been shown that multiple shapes (e.g., three discs) can nevertheless be perceived simultaneously by these patients if they are simply connected by a thin line (Barton et al., Citation2007; Luria, Citation1959).
The third idea is that the transition from retinotopic to spatiotopic and body-centred coordinates may be mediated by a representation of shapes in shape-based coordinates. This idea seems to have emerged from the attempt to explain the origin of illusions affecting the perception of shapes or of their orientation, such as the rod-and-frame effect (Ash & Witkins, Citation1948), Mach’s diamond (Mach, Citation1959; Palmer, Citation1999) and other types of ambiguous shapes (Humphreys, Citation1983; Palmer, Citation1985, Citation1989; Rock, Citation1973). Mach’s diamond, for instance, refers to the observation that the same geometrical shape can be perceived either as a diamond or a square depending on its orientation in the environment (not on the retina). The importance of this finding lies in the fact that it suggests that perception results from the computation of a relationship between a representation of the shape and an extrinsic coordinate frame (Palmer, Citation1989; Rock, Citation1973). More recently, this idea has received support from both neuropsychological and neurophysiological studies. Brain damaged patients have been reported who suffered from an attentional disorder whereby they ignore one half of a stimulus independently of its egocentric location or orientation (e.g., Driver & Halligan, Citation1991; Tipper & Behrmann, Citation1996). Such disorders would be difficult to explain without assuming the existence of some type of shape-centred representations (but see Driver & Pouget, Citation2000; Mozer, Citation2002). Converging evidence from neurophysiological (Pasupathy et al., Citation2018) and neuroimaging studies (McKyton & Zohary, Citation2007; Vernon et al., Citation2016) has shown that neurons situated at an intermediate position between the early retinotopic representation and more abstract non-retinotopic object representations in the inferior temporal cortex (IT) encode shapes’ contours as a function of their arrangement relative to the shape itself. For instance, a neuron in V4d may respond preferentially to shapes that contain a sharp convexity on the left independently of the retinotopic size and location of that shape (El-Shamayleh & Pasupathy, Citation2016; Pasupathy & Connor, Citation2001).
The fourth key idea is that intermediate visual processing runs in multiple parallel streams specialized in the processing of different properties of the visual scene and, therefore, in computing shape representations from different types of cues, such as from luminance, colour, disparity and motion cues (Bushnell et al., Citation2011; Conway, Citation2014; Freud et al., Citation2018; Livingstone & Hubel, Citation1987; Nassi & Callaway, Citation2009; Tootell & Nasr, Citation2017). In line with this idea, there is evidence that the processing of different types of information (e.g., colour vs. luminance, high vs. low spatial frequency) remain segregated at least to some degree in several areas of the extrastriate cortex such as V2, V3, V4 and MT (Bushnell et al., Citation2011; Conway et al., Citation2007; Conway & Tsao, Citation2009; Oleskiw et al., Citation2018; Tootell & Nasr, Citation2017) and that the computation of shapes from luminance, colour, motion, and depth cues relies on at least partly distinct extrastriate pathways (Chandrasekaran et al., Citation2007; Jiang et al., Citation2008; Murray et al., Citation2003). Additional evidence for this idea comes from neuropsychological studies. One set of studies has demonstrated that brain-damage may affect disproportionately the processing of some visual features such as colour (Cavanagh et al., Citation1998; Zeki, Citation1990), motion (Zihl et al., Citation1983) or luminance (Morland et al., Citation1999). Such selective loss implies that there are multiple visual pathways involved in processing these diverse properties. Other neuropsychological studies have reported cases of disproportionate disorders in perceiving shape from particular cues. For instance, a patient has been reported with intact ability to perceive shape from luminance, but not from motion despite preserved basic motion perception (Cowey & Vaina, Citation2000). Another patient was able to compute 2D shape from luminance and motion cues but not from illusory contours, and 3D shapes from motion but not from perspective cues (Fine et al., Citation2003). Still another patient could compute shape from luminance cues but was impaired in computing shape from motion and disparity cues (Rizzo et al., Citation1995). Holmes and Horrax (Citation1919) described a patient who could recognize 2D shapes but could not use depth cues to recognize 3D shapes, and Chainay and Humphreys (Citation2001) reported a patient with the reverse profile. These cases indicate that there are multiple visual pathways involved in computing shape representations from different types of visual cues. Finally, other studies have reported patients with a selective deficit in perceiving the orientation and location of shapes computed from specific cues (McCloskey, Citation2009; McCloskey et al., Citation1995; Pflugshaupt et al., Citation2007). McCloskey and colleagues, for instance, reported an individual, A.H., who presented with a disorder in perceiving the location and orientation of objects that was modulated by the visual features of the stimuli: she was better at judging the orientation of arrowheads presented at brief exposures (50 msec) or with a low contrast difference with the background than those presented at high contrast for an unlimited amount of time; and, she was severely impaired at pointing to a stationary visual stimulus (an “X” or an “O”) but flawless when the same stimulus oscillated up and down (6°) at 1 Hz. Such specific difficulty in processing the orientation and location of shapes computed from particular cues, but not in computing the shape itself, suggests that the multiple visual pathways involved in computing shape representation from different cues have independent contributions to perception at least up to a stage at which shape representations are computed.
Despite this progress, much remains to be learned about the nature of the intermediate representations and their computation. Some key ideas remain to be empirically supported. It remains unclear, for instance, whether the shape-centred representations detected in V4 constitute an intermediate stage of visual perception (seeing) or, rather, object-categorization (recognizing). The object-centred representations deduced from neuropsychological studies are similarly ambiguous as they are typically interpreted as a unit of object-based attention rather than of visual perception per se. In addition, many of these key concepts remain to be more clearly specified. For instance, while the hypothesis that at one or several stage(s) of processing the primate visual system represents “objects” with respect to their own coordinate system is widespread (Caramazza & Hillis, Citation1990; Driver et al., Citation1994; Marr & Nishihara, Citation1978; McCloskey, Citation2009; McCloskey et al., Citation2006; Olson, Citation2003; Subbiah & Caramazza, Citation2000; Tipper & Behrmann, Citation1996), the meaning of “object”, the geometric properties of the centre of the coordinate frame, the factors that determine the orientation of the frames’ axis, and the corresponding stages of processing in the visual system, have remained largely underspecified. Similarly, although it seems clear that different properties of the visual scene are initially processed in parallel visual pathways and must then be integrated into a coherent unique percept, much remains to be learned about the functional locus and mechanisms involved in this integration. Perhaps even more importantly, these key concepts and the large body of neuropsychological, behavioural, computational and neurophysiological data relevant to this issue remain to be interrelated within an integrative framework.
A major bottleneck to further progress in understanding the computations involved in the transformation of retinotopic representations into conscious perception of objects is the extreme degree of complexity and interactions between and among multiple levels of representations in the visual system, making it difficult to isolate and study the nature of one particular level. Nevertheless, nature occasionally provides the opportunity to peer inside extremely complex neural systems by isolating components of a system through accidental damage or genetic modification of neural components. We report here the detailed study of a young woman, Davida (a pseudonym), who has no remarkable medical, neuropsychological, neurological, psychiatric or ophthalmological history (see Appendix Case History) but presents with an extraordinarily clear visual disorder that has turned out to be highly informative for some aspects of the issues raised here.
Davida has a highly specific deficit in perceiving the orientation of sharp-edged 2D medium to high contrast bounded regions of space (“shapes”; e.g., black letters and abstract shapes on white background). She reports seeing such shapes alternating between their correct orientation and all the other orientations that would result from their mirroring across one or both axes of their own “shape-centered” coordinate system, their rotation by 90, 180 or 270 degrees around their centre, or both (see Movie S1 online for a description of what she perceives when shown these types of stimuli). In contrast, (a) the processing of orientation from auditory, tactile, and kinesthetic information is intact; (b) visual judgments about the identity, shape, distance, colour, size, movement, and location of the same kind of stimuli are intact; and (c) her perception of the orientation of 3D, strongly blurred or very low contrast shapes, and of compound stimuli emerging from a collection of shapes, is intact.
This highly selective deficit offers new empirical support for the four key concepts introduced above and, more importantly, provides new clues to guide their integration in a common framework. Davida’s disorder suggests that an intermediate stage in the process of constructing the conscious representation of a visual scene has the following properties: (1) it involves segmenting the initial retinotopic space into mutually exclusive bounded regions of space, computed by edge detection mechanisms operating on different visual properties (e.g., luminance, colour, motion, disparity); (2) these bounded regions are represented in “shape-centered” coordinate frames; and, (3) at a subsequent step it involves integrating these multiple “intermediate shape-centered representations” (ISCRs) into a common higher-order body-centred or spatiotopic frame where conscious representation of scenes composed of several shapes and of their spatial relationship emerges (see ). The nature of Davida’s errors, and their similarity in perceptual and speeded action tasks, additionally invites new conclusions about the nature of ISCRs, the operations that support their mapping/transformation from a retinotopic to a body-centred or spatiotopic frame, and their (shared) functional role for visual perception and action.
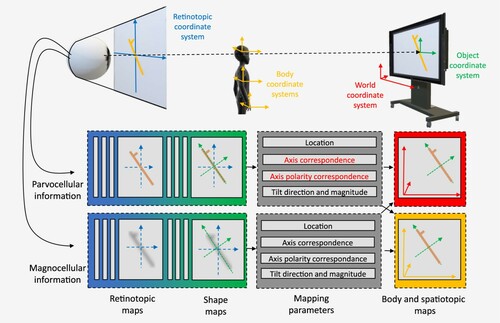
Figure 1. Schematic representation of the main conclusions drawn from Davida’s behavioural profile. Observed objects are projected onto the retina in retinotopic space (in blue). From the retina, information is conveyed to the brain through parvocellular and magnocellular channels. Although both channels are involved in the processing of stimuli of largely overlapping (medium) spatial frequency and contrast, the parvocellular (P) channel plays a distinctive role in the processing of very high contrast and spatial frequency (sharp-edged, fine) stimuli while the magnocellular channel plays a distinctive role in the processing of stimuli with complementary characteristics (very low spatial frequencies and contrast). The primary visual cortex represents this information in retinotopic coordinates. Behaviour requires a transformation from retinotopic coordinates to non-retinotopic coordinates (e.g., spatiotopic and body-centered, in red and yellow). The results reported here suggest that this transformation is mediated by an intermediate, unconscious, stage of processing where the visual system represents bounded regions of space (shapes) in their own “shape-centered” coordinate system composed of orthogonal axes aligned on the geometrical properties of the shape itself (e.g., on the elongation axis of elongated objects, as displayed in the Figure in green). We refer to the representations at this level as “intermediate shape-centered representations” (ISCRs). Davida’s behavioural profile suggests that ISCRs computed from different cues in independent parallel extrastriate pathways (e.g., from colour or luminance edges) are integrated precisely at the level at which they are mapped onto a behaviourally relevant (spatiotopic and body-centred) frame of reference. An intriguing possibly, illustrated here, is that these parallel pathways are specialized in the processing of information derived from the parvocellular and magnocellular channels. Davida’s disorder affects selectively two of the parameters—the axis correspondence and axis polarity correspondence parameters (text in red; McCloskey et al., Citation2006) required to map ISCRs computed (correctly) from sharp and clear changes in colour or luminance (i.e., possibly from information carried in the parvocellular pathway) onto spatiotopic and body-centred coordinates.
Experimental study
Participants
Davida is a right-handed (Oldfield’s Laterality Index of 80), athletic (she is skilful at many sports, including soccer and basketball) and very cooperative young woman. She was 15 years old when this study began in October 2016 and 17 years old when it ended in March 2019. Information regarding her early history was obtained from her parents through a developmental and family history questionnaire and by reviewing her medical record. Although she tested normal in vision and hearing exams, she struggled with reading starting in the 2nd grade. Davida has no other remarkable medical, neuropsychological, neurological, psychiatric or ophthalmological history (see Appendix Case History for details). Some of the experimental tasks were also presented to control participants. The control group was composed of 14 females (11 were right-handed), slightly older (mean age = 19.6; range = 18–21) and longer educated (mean years of college education = 2.15; range = 1–4) than Davida. The control participants had normal or corrected visual acuity and reported no antecedent developmental disorders.
Material and procedure
The experimental investigations were carried out from October 2016 to March 2019 during sessions lasting between 60 and 120 minutes. The study was approved by the Committee on the Use of Human Subjects, Harvard University (Protocol # IRB16-1124). Written informed consent (control participants), assent (Davida) or permission (Davida’s parents) were obtained prior to the study. Unless otherwise indicated, in all experiments participants were seated in front of a laptop computer at 50 cm from the screen. The room was dimly illuminated from the ceiling. All experiments were controlled with the Psychopy software (Peirce, Citation2007, Citation2009), and all visual stimuli were displayed on a Lenovo T460s 14 inch, 16:9, 1920 × 1080 pixels (157 PPI), 60 Hz screen controlled by an Intel® HD Graphic 520 graphics card.
A detailed description of the material and procedures of each experiment is provided in the Appendix. Supplementary Movies can be accessed on the Open Science Framework platform (link: https://osf.io/sp6cz/?view_only=fe6e9e7d30bb4b2bbb3f403bd2ff99f9).
Results
The main conclusions afforded by Davida’s behavioural profile, schematized in , follow from 6 sets of results, §1–§6.
Set of results §1: Davida perceives 2-dimensional stimuli defined by sharp and high-contrast edges in a systematic set of inaccurate orientations
Upon initial questioning, Davida reported seeing letters and other 2-dimensional (2D) shapes defined by sharp and high-contrast edges (e.g., numbers and road signs), but not daily life’s real 3-dimensional (3D) stimuli, in different orientations rapidly alternating piecemeal through a gradual transition “as if the letter was fading in, fading out in different orientations” (see Movie S1). This description, which is similar to that typically reported during rivalry (Blake, Citation2001), suggested the visual system’s attempt to resolve a perceptual problem.
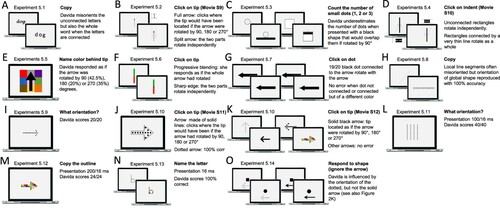
This section reports Davida’s performance and response profile in a series of experiments probing her perception of the orientation of 2D shapes defined by sharp and high-contrast edges through different behavioural measures: either explicitly through verbal judgments and direct copy or implicitly through naming, visual after-effects, visual illusions, stimulus-response compatibility effects and immediate and delayed directed movements (; see also Movies S2–S7). We had four objectives. The first was to characterize the set of orientations that she perceives when shown different types of stimuli. The second was to explore whether Davida’s disorder similarly affects explicit (A-E) and implicit (F-H) perceptual tasks. The third was to test whether Davida’s disorder affects similarly tasks assumed to depend on a spatiotopic representation of visual information (“perceptual tasks”; A-H), and tasks that call into play body-centred representations of visual information for their execution (e.g., speeded action tasks; I-J). Davida’s performance and response profile in this series of experiments revealed a clear and coherent pattern of errors: She systematically named (A, F), copied (B, D, E), judged (C), described (H) and interacted with (G, I, J) 2D shapes as if they were inverted (e.g., b → p), reversed (b → d), or plane-rotated by 90 (clockwise or counterclockwise) or 180 degrees around their own centre, and her disorder is quantitatively and qualitatively independent of the nature of the task (e.g., implicit, explicit) and of the nature of the high-order coordinate frame called into play to solve the task (body-centred or spatiotopic). For instance, asked to place either a mouse cursor as precisely as possible (G, Movie S5) or her index finger as quickly as possible (J, Movie S7) at the tip of a displayed arrow, Davida typically pointed to where it would have been if the arrow were rotated by 90, 180 or 270 degrees.
Figure 2. Stimuli, tasks and Davida’s performance for the first series of experiments (see Appendix 1.1–1.14 for detail). Movies S2-S7, online, illustrate Davida performing the experiments 1.2, 1.5, 1.6, 1.7, 1.9 and 1.10.
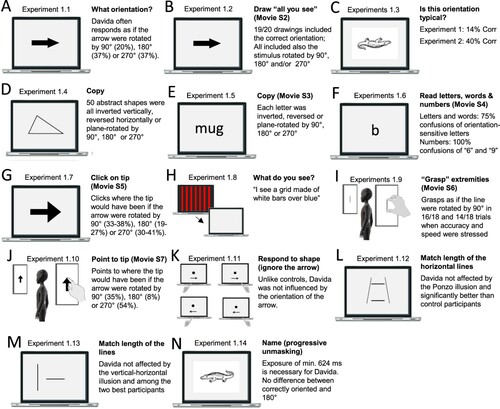
A fourth goal was to test two predictions derived from Davida’s report of the orientation of 2D stimuli: (1) if she perceives shapes in inaccurate orientations, then, Davida should perform far better than control participants in tasks, such as visual illusions and stimulus-response compatibility tasks, in which accurate orientation perception typically hinders performance; (2) if she sees 2D stimuli randomly fluctuating between different orientations alternating piecemeal through a gradual transition, then, Davida should be slow at identifying 2D line drawings of objects. These two predictions were confirmed (K-N). Davida, for instance, was extraordinarily efficient in the Ponzo illusion task (L) and, unlike control participants, she was not influenced by the orientation of an arrow during a typical stimulus-response compatibility task (K).
Set of results §2: Davida’s disorder is specific to the visual perception of some specific aspect of the orientation of shapes
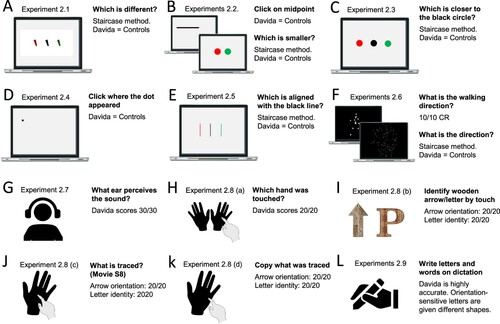
Davida reports no other visual difficulty. Davida’s performance in the two series of experiments presented below corroborated this report. The first series comprised experiments probing her perception of the shape, size, location, distance, movement, and tilt of 2D stimuli (A-F). Davida’s performance in these experiments was as good as control participants, including her ability to discriminate the tilt of shapes (E). The second series of experiments examined her ability to process the orientation/location of kinesthetic, tactile, and auditory stimuli, and her ability to form and use internal representations of oriented shapes (G-L). She performed these tasks flawlessly. For instance, she had no difficulty to name orientation sensitive letters (b, p, d, q) traced on her hand (J; Movie S8) or to write these letters to dictation, and hence from memory, on a sheet of paper (L). All this implies that Davida’s disorder is specific to vision and consists only in perceiving 2D shapes as if they were inverted, reversed, or plane-rotated by 90 or 180 degrees.
Figure 3. Stimuli, tasks and Davida’s performance for the second series of experiments (see Appendix 2.1–2.9 for detail). Movies S8, online, illustrate Davida performing the experiment 2.8 (c).
Intermediate discussion
The sets of results §1–2 severely constrain hypotheses about the functional locus of Davida’s perceptual deficit. That Davida literally sees 2D shapes in incorrect orientations and has a consistent proportion and type of errors in all (but only visual) tasks implies that her deficit is at a stage in the visual processing stream that is common (and thus preliminary) to the different types of “higher” representational frames (e.g., spatiotopic, body-centred) involved in perception and (speeded) action tasks. This pattern of performance contrasts with the fact that she was as good as control participants in judging the shape, size, location, distance, tilt, and movement of 2D stimuli, thus implying that her disorder arises at a level in the visual system at which, or beyond which, the shape of these stimuli has been computed accurately. Thus, her disorder affects representations in the visual system involved in transforming intact representations of shapes into “higher” representational frames (e.g., spatiotopic, body-centred) underlying action and conscious perception (). In all this, Davida differs instructively from previous reports of neurological individuals who suffered from difficulties in reporting, naming, judging, memorizing, reproducing and/or comparing the orientation of objects. A majority of these cases had difficulties in only some visual tasks (Cooper & Humphreys, Citation2000; Davidoff & Warrington, Citation1999, Citation2001; Harris et al., Citation2001; Karnath et al., Citation2000; Martinaud et al., Citation2014, Citation2016; Priftis et al., Citation2003; Riddock et al., Citation2004; Robinson et al., Citation2011; Turnbull et al., Citation1997; Turnbull et al., Citation1995; Turnbull & McCarthy, Citation1996). Other patients displayed either orientation errors in several modalities (e.g., visual, motor, tactile) or a visual deficit that was not selective to orientation (McCloskey, Citation2009; McCloskey et al., Citation2006; Pflugshaupt et al., Citation2007; Valtonen et al., Citation2008). Davida’s disorder offers a unique opportunity to investigate the nature of the representations and mechanisms involved in the course of transforming retinotopic coordinates into environmental ones.
Set of results §3: Davida perceives each shape either rotated around its own centre or mirrored across axes that intersect at its centre
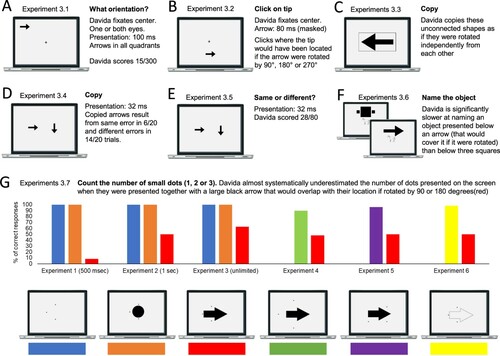
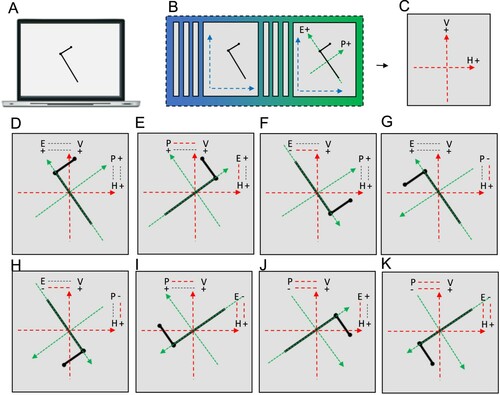
Previous studies have reported individuals who, in the context of developmental or acquired visuo-spatial disorders, perceived the entire visual scene rotated by 90, 180 degrees or mirrored horizontally across a centre constituted by the fovea (Pflugshaupt et al., Citation2007; Solms et al., Citation1988). Another individual mislocated stimuli as if they were mirrored across a centre constituted by the focus of attention (McCloskey et al., Citation1995) and copied them as if they were mirrored across either their own axes or an extrinsic vertical axis (McCloskey et al., Citation2006). In contrast, Davida systematically sees 2D shapes defined by sharp and high contrast edges to be reversed, inverted or plane rotated with respect to their own centre (see G for instance). This suggests that her disorder emerges at a level at which each shape is represented in its own spatial coordinate system, independently of its retinotopic representation and of other shapes—a shape-centered coordinate system. Three predictions of this conclusion were tested and confirmed in the series of experiments reported in this section. First, her subjective report, error rates, and error distributions in experiments assessing her perception of sharp-edged 2D shapes through naming (the orientation of an arrow) or pointing (to the tip of an arrow) were independent of the eye(s) used (right, left or both), the location of the stimulus in the visual field (centre or any of the four quadrants), and where she focuses her visual attention (on the stimulus or not) (A-B). That shapes are systematically perceived as rotated or mirrored with respect to their own centre, independently of where she looks at (i.e., of the centre of her retinotopic space) or where she pays attention to (of the centre of an attentional frame) implies the existence of a “shape-centered” frame of reference. Second, we found that when presented simultaneously with two shapes, even for a very short duration (32 ms), Davida reported perceiving them as the result of different, independent transformations (C-E). This finding corroborates the hypothesis that her deficit occurs at the level at which each shape is represented in its own “shape-centered” frame, and additionally suggests that multiple shape-centered representations are computed in parallel. A third prediction of this hypothesis is that Davida should have difficulty detecting stimuli located in an area that would be covered by another shape (e.g., black solid arrow) if that shape were rotated by 90 degrees. This was the case (F-G). For instance, as shown on G, Davida was able to correctly report whether one, two or three black dots were presented on the screen when the dots were displayed alone (blue condition), when they were displayed together with a large solid black circle (orange condition) or with a “transparent” arrow defined only by its contour (yellow condition), and when they were placed outside the area that would be covered by a large black arrow if that arrow were rotated by 90 or 180 degrees (green and purple condition), but not when they were placed in an area that would be covered by the same large black arrow if it were rotated by 90 or 180 degrees (red condition).
Figure 4. A-G. Stimuli, tasks and Davida’s performance for the third series of experiments (see Appendix 3.1–3.7, for detail).
Set of results §4: Davida perceives each shape mirrored across axes aligned on geometrical properties of the shape itself
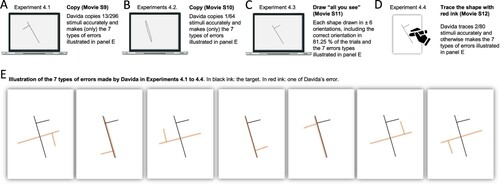
The nature of Davida’s errors reported above implies the existence of “shape-centered” representations—a representation of shapes in a coordinate system centred on the centre of the shape. However, they leave open the question of what determines the orientation of the axes of that coordinate system. The stimuli used in the experiments reported so far were presented with their “intrinsic” axes (e.g., axis of elongation) oriented vertically or horizontally (see ). The arrows were pointing up, down, right, or left, for instance. Therefore, Davida’s horizontal and vertical reversal errors reported so far are compatible with reversals across axes whose orientation is determined by the environment (e.g., the gravitational vertical), her (upright) body or characteristics of the object itself. The series of experiments reported in this section aimed at discriminating among these possibilities. To this aim, we used tilted elongated stimuli because, unlike the stimuli used in the previous experiments (e.g., ), they allow discriminating reflections across retinotopic, body-centred, allocentric (spatiotopic, gravitational) and object-based reference frames (McCloskey et al., Citation2006). Shown elongated asymmetrical shapes tilted 15 or 30 degrees from the vertical or the horizontal (variable across tasks) and asked to draw on a separate sheet of paper either the most likely orientation of that shape given what she perceives (A, B; Movies S9–10) or all the orientations of that shape that she perceives (C; Movie S11), or to trace that shape with ink (D; Movie S12), Davida systematically made the same 7 types of errors. As illustrated in E, all these errors resulted from transformations of the stimulus (rotations, mirror reflection or both) within a frame constituted by an axis aligned with the shape’s elongation axis and a perpendicular axis intersecting the elongation axis at its geometrical centre.
Figure 5. Stimuli, tasks and Davida’s performance for experiments of the fourth series (see Appendix 4.1–4.4 for detail). Movies S9–12, online, illustrate Davida performing the experiments 4.1–4.4.
Set of results §5: Davida’s disorder affects the perception of the orientation of areas in the visual field bounded by sharp (luminance or chromatic) borders
That Davida’s disorder affects a level of processing where shapes are represented with respect to their own, intrinsic, frame offers the opportunity to explore what is a “shape” at that stage of processing. Davida’s response profile in a series of experiments conducted to address this issue indicated that her disorder affects the perception of the orientation of areas in the visual field bounded by sharp (luminance or chromatic) borders (; Movie S13–16). When asked to copy words, for instance, Davida misrepresented the orientation of individual letters when the letters were unconnected but of the whole word when the letters were connected (A; see also Movies S13 and B-D for other examples of the role of connectedness). When shown a series of arrows made of two colours separated by a sharp edge and asked to use the computer mouse to move a small round cursor and click as precisely as possible on the tip of the arrow, Davida almost systematically (in 78.12% of the trials) clicked approximately (i.e., fewer than 50 pixels away) where the tip of that arrow would have been if only the coloured part of the arrow of the same colour as the tip had been rotated by 90, 180 or 270 degrees (F). In contrast, when shown a series of arrows made of two colours transitioning very progressively from one to another, the bicolour arrow was almost always perceived as a single rotated shape (F; Movies S14). Thus, her disorder affects a stage of processing at which bounded areas of the visual field separated by clear chromatic or luminance edges are represented independently of each other. Additional evidence in support of this conclusion is provided by the finding that Davida has no difficulty to perceive the orientation of compound stimuli emerging from an arrangement of shapes, such as arrows composed of non-connected dots or of multiple parts of different colours (H-O; Movies S15–16). For instance, Davida has no difficulty copying, judging or naming orientation-sensitive letters (b, d, p, q) when the letters are composed of unconnected or of multiple parts of different colours and, while this was not the case with a solid black arrow (K), her response latencies in a stimulus-response compatibility task were significantly influenced by the presence of a to-be ignored dotted arrow (O).
Figure 6. Stimuli, tasks and Davida’s performance for the fifth series of experiments (see Appendix 5.1–5.14 for detail). Movies S13–16, online, illustrate Davida performing the experiments 5.2, 5.4, 5.6 and 5.10.
Intermediate discussion
The hypothesis that at one or several stage(s) of processing the primate visual system represents “objects” with respect to their own coordinate system is not new (Caramazza & Hillis, Citation1990; Driver et al., Citation1994; Marr & Nishihara, Citation1978; McCloskey, Citation2009; McCloskey et al., Citation2006; Olson, Citation2003; Subbiah & Caramazza, Citation2000; Tipper & Behrmann, Citation1996), including the specific hypothesis that one axis is aligned on the axis of elongation of elongated objects (Chaisilprungraung et al., Citation2019; Driver et al., Citation1994; Gregory & McCloskey, Citation2010; Marr & Nishihara, Citation1978). However, the different construals of “object” in these studies and the corresponding stages of processing in the visual system have remained largely underspecified.
The findings reported in §3–5 imply that there is a stage of processing in the visual system, preliminary to the transformation of visual information in the different types of “higher” representational frames (e.g., spatiotopic, body-centred) underlying conscious visual perception, action and object recognition, which represents bounded areas of the visual field independently of their background and of each other in a perceptual frame composed of orthogonal axes, aligned and centred on geometrical properties of the shape itself (e.g., on the elongation axis of elongated shapes).
We refer to the type of representation at this level of processing as “intermediate shape-centered representation” (ISCRs) to distinguish it from subsequent levels of representation that underpin conscious perception and action and where compound stimuli (e.g., a stimulus composed of unconnected dots) emerge. This distinction parallels that proposed by Palmer and Rock (Citation1994; see also Tse & Palmer, Citation2012) between entry-level “uniform connected regions” (UCRs) and postconstancy levels of representation. Like the ISCRs affected by Davida’s disorder, the UCRs are defined as connected regions of uniform image properties (e.g., luminance, colour) emerging from edge detectors selectively sensitive to sharp spatial changes in a given visual property (e.g., luminance) and were hypothesized to serve as the fundamental first unit of perceptual organization, emerging from the processes of edge detection in early vision and laying the foundation on which all later perceptual organization rests (see also Leek et al., Citation2005).
The selectivity of Davida’s types of errors imposes a further constraint on our understanding of the nature and functional organization of the mechanisms involved in mapping ISCRs onto “higher” representational frames (e.g., spatiotopic, body-centred). The existence of ISCRs implies that perceiving the orientation of a shape requires specifying the relation of an ISCR to “higher” representational frames. This entails specifying five parameters necessary for coordinates matching (McCloskey et al., Citation2006, ): (1) which coordinate frame axes relate to each other (axis correspondence); (2) the axes polarities correspondences (polarity correspondence); (3) the angular disparity between the axes (tilt magnitude); (4) the direction of the tilt (tilt direction) and (5) the relative location of the origin (centre) of the two frames. In this framework, Davida’s 7 types of errors with tilted elongated asymmetrical stimuli can be interpreted as a consequence of a specific failure of the mechanisms that specify the axis correspondence and axis polarity correspondence between the two frames, leading to axis correspondence errors (e.g., E), axis polarity correspondence errors (e.g., F-H) and their combination (e.g., I-K).
Figure 7. Illustration and interpretation of Davida’s 7 different types of errors with tilted, asymmetrical, elongated shapes in terms of a mapping deficit between an ISCR and a higher-order frame. A. A tilted, asymmetrical, elongated shape target. B. Schematic representation of the emergence, from the earliest cortical representation (blue), of an ISCR (green) composed of a polar axis aligned with the object’s elongation axis (E) and a secondary (perpendicular) polar axis crossing the shape through the centre of its longest straight segment (Secondary axis; S). C. Schematic representation of a hypothetical higher order representational frame (red) composed of a polar vertical axis (V) and a polar horizontal axis (H). D. Illustration of the parameters specifying the relation between the two frames during a successful mapping process (McCloskey et al., Citation2006): their axis correspondence (in dotted lines: the shape’s elongation axis is related to the extrinsic vertical axis) and axis polarity correspondence (in dotted lines: the positive ends of the objects’ E and S axes are related to the positive ends of the scene-based V and H axes, respectively). E-K. Illustration and interpretation of Davida’s 7 different types of errors with this type of stimuli. The parameter(s) misrepresented during the mapping process are indicated by dotted lines in red ink. E. An error resulting from a misrepresentation of the axis correspondence: the object’s E and S axes are represented with respect to the wrong extrinsic axis. F-H. Errors resulting from a misrepresentation of the correspondence between the polarity of the objects’ E axis (F), S axis (G) or both (H) and the polarity of the extrinsic frame to which they relate. I-K. Combinations of an axis correspondence error and an axis polarity correspondence error concerning the objects’ E axis (I), S axis (J) or both (K).
Set of results §6: Davida’s disorder is selective for sharp-edged 2D shapes of medium to high contrast
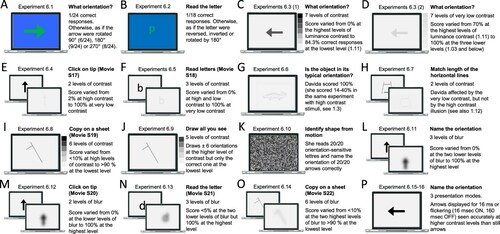
Davida’s selective difficulty in perceiving the orientation of the type of 2D shapes used in the experiments reported so far—sharp-edged, stationary, defined by high luminance contrast from the background—contrasted with otherwise normal perception of the physical environment. Unlike the stimuli used in the experiments reported so far, physical environments under naturalistic viewing conditions are dynamic scenes populated with real 3D objects of lower contrast composed of surfaces of different luminance (e.g., shading) separated by edges that are often blurred (Sebastian et al., Citation2015). To determine how different types of visual information influence Davida’s perception, we explored the influence of movement, contrast (chromatic and luminance), blur, speed of presentation, and depth on Davida’s performance in a variety of experiments assessing her perception of shapes’ orientation (). Davida had severe difficulty when asked to name the orientation of arrows or the identity of orientation-sensitive letters displayed in blue, red or green on an isoluminant background (blue, red or green; A,B). In contrast, her performance in the same two tasks, and in other tasks assessing her perception of the orientation of shapes through pointing and direct and delayed copy, improved and often became flawless when the stimuli were defined by very low luminance contrast with the background (C-J; Movies S17–19), when the stimuli were implied by motion (K), when the stimuli were strongly blurred (L-O; Movies S20–22), or when she was shown real 3D stimuli (Appendix 6.17). Davida was also significantly more accurate in perceiving the orientation of medium contrast arrows when they were flashed (16 msec) or flickered (5.7 Hz; 16 msec ON, 160 msec OFF) than when they were presented for a longer duration (P). Interestingly, her performance worsened (normalized) when presented with low luminance contrast stimuli in the visual illusion task in which perception of accurate orientation hinders performance (the Ponzo illusion; H).
Figure 8. Stimuli, tasks and Davida’s performance for the sixth series of experiments (see Appendix 6.1–16 for detail). Movies S17–22, online, illustrates Davida performing the experiments 6.4, 6.5, 6.8, 6.12, 6.13 and 6.14.
Intermediate discussion
The set of results §6 implies that axis correspondence and axis polarity correspondence between ISCRs and higher frames may fail for ISCRs computed from some types of visual cues, but not for others. This finding is in line with previous evidence that distinct visual pathways are involved in computing shape representations from different types of cues, such as from luminance, colour, disparity and motion cues (e.g., Cowey & Vaina, Citation2000; Fine et al., Citation2003; Palmer & Rock, Citation1994; Rizzo et al., Citation1995). However, to date the functional locus at which shape representation computed from different cues are integrated has remained unclear. That Davida’s selective disorder occurs during the process of mapping an ISCR to a higher order frame invites considering the possibility that shapes may be computed from different cues in parallel precisely up to the level of the ISCRs, before being integrated at the stage at which they are mapped onto some higher order frame (see ). In this view, a given region of the visual field bounded by edges defined by more than one visual cue, such as a sharp transition in luminance and colour for instance, would be represented twice: once as an ISCR emerging from the detection of the sharp change in luminance and once as an ISCR emerging from the detection of colour edges. The unitary object (e.g., the red triangle) would emerge only as the result of the separate mapping of these two ISCRs onto a spatiotopic frame. In other words, conscious visual perception of objects is the result of the integration of independent mappings of ISCRs computed in parallel extrastriate pathways into “higher” representational frames (e.g., spatiotopic, body-centred).
This view predicts that an identical shape bounded by different cues (e.g., chromatic or luminance edges) should result in different patterns of cortical activation in retinotopic cortex, but in a very similar neural pattern in non-retinotopic cortex where ISCRs are integrated. In line with this prediction, there is some evidence that shapes defined by different types of cues (e.g., colour vs. luminance, very high vs. very low spatial frequency) indeed evoke segregated cortical responses at least to some degree in several retinotopically organized areas of the extrastriate cortex such as V2, V3, V4, MT (Bushnell et al., Citation2011; Conway et al., Citation2007; Conway & Tsao, Citation2009; Ferrera et al., Citation1994; Merigan & Maunsell, Citation1993; Nassi & Callaway, Citation2009; Oleskiw et al., Citation2018; Tanigawa et al., Citation2010; Tootell & Nasr, Citation2017; Yabuta et al., Citation2001) and in the parietal lobe, where an inferior-high spatial frequency to superior-low spatial frequency organization has been reported (Mahon et al., Citation2013).
The association of deficit for ISCRs defined by sharp-edges of colour and/or medium-to-high luminance contrast could be explained by the mere co-occurrence of multiple deficits arising from independent mapping systems being fortuitously damaged together: one involved in the mapping of ISCRs computed from sharp chromatic edges, another in the mapping of ISCRs computed from sharp medium-to-high luminance contrast edges. In contrast, the mechanisms involved in mapping onto higher frames the ISCRs computed from disparity cues (3D objects), motion cues (shape-from-motion) or from the detection of blurred and very low-contrast edges would be intact. This interpretation would suggest that the visual system is endowed with as many different mechanisms for mapping ISCRs onto higher frames as there are types of cues that can be used to derive shape information. However, the finding that Davida’s perception of shapes defined by colour and by medium-to-high luminance contrast was characterized by highly similar frequencies and types of errors suggests that these deficits are unlikely to be associated by chance.
Perhaps a more likely alternative is that Davida’s performance reflects a dissociation between the mapping of ISCRs computed from information originally derived from the parvocellular and Magnocellular subcortical channels (see for an illustration of that specific hypothesis). Indeed, although both channels are involved in the processing of stimuli of largely overlapping (medium) spatial frequency and contrast, the chromatic parvocellular (P) channel plays a distinctive role in processing stationary, very high spatial frequency (sharp-edged, fine) and high contrast stimuli (such as those impaired in Davida) whereas the achromatic magnocellular (M) channel plays a distinctive role in processing stimuli with complementary characteristics—such as moving, brief, very low spatial frequency (coarse, large) and very low contrast stimuli (Livingstone & Hubel, Citation1987; Merigan & Maunsell, Citation1993). On this view, Davida’s disorder would be the result of a specific deficit in setting the axis correspondence and axis polarity correspondence between ISCRs computed from information derived from the parvocellular channel and higher (spatiotopic or body-centred) representational frames. In contrast, her perception would be intact when ISCRs are computed from information derived only from the magnocellular channel (i.e., for stimuli of very low spatial frequency and contrast). Davida’s advantage for real 3D stimuli and for stimuli of low contrast presented very briefly are consistent with this hypothesis. Indeed, there is evidence that sensitivity to 3D structure is prominent in the M- dominated thick stripes in V2 (Chen et al., Citation2008), MT (DeAngelis et al., Citation1998), and dorsal areas around the IPS (Freud et al., Citation2018; Van Dromme et al., Citation2016). There is also evidence that the M-pathway is more sensitive than the P-pathway to high temporal frequencies at low levels of luminance contrast (Merigan & Maunsell, Citation1993).
General discussion
Davida has a particularly clear and highly selective visual disorder: she perceives any 2D sharp-edged high-contrast bounded region of space alternating between its correct orientation and all other orientations that would result from a failure to specify the correct axis correspondence and/or axis polarity correspondence in the course of mapping an ISCR—composed of orthogonal axes centred and aligned on the shape itself—onto higher coordinate frames (e.g., spatiotopic, body-centred; see ). By contrast, her perception of the orientation of shapes that are either strongly blurred, defined by very low luminance contrast with the background, implied by motion, shown in real 3D or that emerge from a collection of non-connected elements was unimpaired.
At present, some aspects of Davida’s perceptual disorder remain difficult to explain. For instance, we remain puzzled by her report of perceiving shapes in several orientations rapidly alternating piecemeal through a gradual transition (see Movie S1). An important aspect of this phenomenal experience is that it occurs only when Davida sees shapes that she ultimately perceives in several orientations. This never occurs for shapes such as crosses (with arms of equal length), squares, diamonds, or circles whose percept would not be affected by axis polarity and axis correspondence errors. This indicates that the piecemeal nature of her perception results from her orientation perception problem. At first sight, it may be tempting to interpret this phenomenon as an attempt of her visual system to resolve a conflict between the content of retinotopic and spatiotopic representations of visual information, leading to repeated cycles of error generation and error detection. But if this were the case, should we not expect her perception to settle when the accurate representation of the orientation of the shape is computed? Another possibility is that this phenomenon emerges as a by-product of her rapidly alternating ocular suppression (see Case Report). However, she reports the same phenomenon when looking at stimuli monocularly. An intriguing possibility is that this phenomenon reflects natural perceptual updating/cycles (VanRullen, Citation2016). According to the binding-by-synchrony hypothesis, for instance, neurons coding for different properties of a single shape (e.g., colour, motion, shape) in spatially segregated processing areas are coordinated and bound together to give rise to the perception of a unified shape by their tendency to periodically fire together (Singer, Citation1999). Each cycle would allow updating the state of the shapes’ dynamic properties (e.g., location, orientation) and, in Davida, this could lead to either a new error or the correct orientation, which would co-exist because of an “echoing” or “persistence” of the representation computed in previous cycles (Macdonald & VanRullen, Citation2010). If such were the case, future studies with Davida may provide new insights into the temporal characteristics of these perceptual cycles.
We have also so far failed to find an explanation to her almost systematic, below chance, failure to perceive the accurate orientation of the stimulus. This “avoidance” is all the more difficult to explain since when asked to report (e.g., to draw) “all she sees”, she generally includes the correct orientation (Figure 1B, 6C and 9J; Movies S2 and S11) suggesting that the correct orientation is not completely suppressed. Other aspects of her profile have not been studied with enough detail to allow definite conclusions. For instance, while her intact perception of real 3D objects is striking, the nature of the 3D cues that support normal performance remains unclear. Since she struggles to perceive correctly the orientation of line drawings with pictorial perspective clues (C) but judges the orientation of real 3D stimuli flawlessly in both binocular and monocular vision (Appendix 6.17), one can only deduce that pictorial perspective depth-cues are not sufficient and that binocular cues are not necessary.
Notwithstanding these uncertainties, Davida’s highly selective visual disorder invites three main conclusions about the nature of the mechanisms involved in transforming retinotopically represented visual primitives into conscious perception of objects in environmental coordinates (): (1) There is an unconscious stage of processing where the visual system represents each bounded area in the visual field in its own “shape-centered” frame composed of orthogonal axes centred and aligned on the shape itself. We propose to refer to this level of representation as “Intermediate Shape-Centered Representation” (ISCR). (2) More speculatively, the results invite us to consider the possibility that ISCRs computed from different visual cues (e.g., sharp vs blurred edges) are computed in parallel extrastriate pathways and integrated precisely at the level at which they are mapped onto spatiotopic and body-centred frames of reference (See ). (3) The mapping of the ISCRs involves computing several parameters (McCloskey et al., Citation2006) of which at least two (axis correspondence and axis polarity correspondence) are independent from the other ones (location, tilt magnitude and direction) and may selectively fail to integrate ISCRs computed from some types of cues (but not others) to higher frames (spatiotopic or body-centred). This is the case in Davida, whose deficit results from a specific failure to compute the accurate axis correspondence and axis polarity correspondence between ISCRs computed from some types of visual cues (high luminance and chromatic contrast) to higher frames (spatiotopic or body-centred), while sparing the ability to compute tilt magnitude, tilt direction and location.
These findings corroborate and complement previous proposals regarding the nature of intermediate stages in vision. They confirm that an intermediate stage consists of segmenting the visual scene in a series of separate 2 dimensional regions (Chainay & Humphreys, Citation2001; Hummel, Citation2001; Leek et al., Citation2005; Marr & Nishihara, Citation1978; Nakayama et al., Citation1995; Palmer & Rock, Citation1994) and corroborate the existence of shape-centered representations (Driver et al., Citation1994; Marr & Nishihara, Citation1978; Olson, Citation2003; Quinlan & Humphreys, Citation1993; Sekuler, Citation1996; Sekuler & Swimmer, Citation2000; Subbiah & Caramazza, Citation2000; Tipper & Behrmann, Citation1996). They confirm the segregation of visual pathways involved in computing shapes from various types of cues in mid-level vision (Bushnell et al., Citation2011; Flanagan et al., Citation1990; Livingstone & Hubel, Citation1987; McCloskey et al., Citation1995; Pflugshaupt et al., Citation2007; Tanigawa et al., Citation2010; Tootell & Nasr, Citation2017), and the division of labour within the visual system among the processes involved in different aspects of orientation processing, such as tilt, axis correspondence and axis polarity correspondence (Eacott & Gaffan, Citation1991; Goodale et al., Citation1991; Holmes & Gross, Citation1984; McCloskey et al., Citation2006; Valtonen et al., Citation2008). Above and beyond corroborating these separate proposals, a main interest of the findings reported herein is that Davida’s profile of behaviour encourages us to view the above proposals as bound together at a clear level of representation within the visual system, where shapes defined strictly by bounded regions of space (or “uniform connected regions”; Palmer & Rock, Citation1994) computed from different visual cues are processed in parallel before being integrated in higher coordinate frames (spatiotopic or body-centred).
In addition to the findings reported herein, Davida’s pattern of errors in complementary experiments reported elsewhere (Vannuscorps, Galaburda & Caramazza, Citation2021) allows specifying the properties that define the centre and orientation of the ISCRs’ coordinate system for (1) asymmetrical elongated shapes where the orthogonal axes are aligned precisely on the shape’s most elongated part and centred at the centre of that most elongated part, and (2) for curved symmetrical shapes where the orthogonal axes are aligned on the axis of symmetry of the shape and centred in its centroid. Future studies should explore the heuristics used by the visual system to assign a coordinate system to other types of shapes.
The neural correlates of the different mechanisms described in this proposal remain somewhat unclear. Nevertheless, the concept of multiple ISCRs is broadly consistent with several known properties of the visual area referred to as LO1-LO2 in humans (Kolster et al., Citation2010; Larsson & Heeger, Citation2006) and V4d in monkeys (Roe et al., Citation2012). First, LO1-LO2 (or V4d in monkeys) are situated at an intermediate position between the early retinotopic representation characterizing V1–V3 and more abstract non-retinotopic object representations in LO/IT (McKyton & Zohary, Citation2007; Vernon et al., Citation2016). Second, and in line with our characterization of ISCRs, V4d is assumed to play an important role in the detection of discontinuities of colour and/or luminance, and to encode information about isolated shapes (i.e., bounded regions of space) both in a retinotopic and in an object-centred frame (El-Shamayleh & Pasupathy, Citation2016; Gallant et al., Citation1993; Gallant et al., Citation1996; Kim et al., Citation2019; Nandy et al., Citation2013; Pasupathy & Connor, Citation2001; Rust & DiCarlo, Citation2010). Third, and in line with the hypothesis that ISCRs are computed from different cues in separate extrastriate pathways, V4d/LO1-LO2 retains some degree of segregation between clusters of neurons specialized in the processing of shape defined by different cues such as sharp or blurred edges (Oleskiw et al., Citation2018) or defined by colour or luminance (Bushnell et al., Citation2011; Conway et al., Citation2007; Conway & Tsao, Citation2009; Tanigawa et al., Citation2010; Tootell & Nasr, Citation2017). Fourth, and in line with the finding that Davida’s disorder affects similarly perceptual and speeded action tasks, V4 is bi-directionally connected to both the inferior temporal “ventral” and the parietal “dorsal” cortices (Ungerleider, Galkin, Desimone, & Gattass, Citation2008). Thus, putative ISCRs in V4 could serve as a basis of subsequent computations in both the ventral and dorsal stream.
As for the brain areas involved in the mapping of ISCRs onto higher frames, Davida’s preserved ability to compute tilt magnitude, tilt direction and location, but impaired ability to compute axis correspondence and axis polarity correspondence is in line with previous evidence that the mechanisms in charge of specifying these different mapping parameters may rely on different brain regions. Evidence dissociating location from the other mapping parameters comes from the case of a patient with bilateral occipito-parietal brain damage who suffered from a specific disorder affecting his ability to locate visual stimuli in both action and perception tasks (Baylis & Baylis, Citation2001; Friedman-Hill et al., Citation1995). In the case of tilt, there is some evidence that in humans LO1 plays a role in the ability to discriminate the orientation of gratings tilted a few degrees from each other (Silson et al., Citation2013) and that in monkeys, IT is necessary for discriminating tilted shapes (for instance 30 or 45 degrees apart; Gross, Citation1978; Holmes & Gross, Citation1984). That the well-documented patient DF (Goodale et al., Citation1991), who has bilateral lateral occipital cortex (LO) damage, could grasp objects accurately, additionally suggests that tilt information for action is computed independently in the dorsal stream. Other evidence suggests that ventral stream regions do not compute axis correspondence and axis polarity correspondence on their own. To our knowledge, the impact of lesions in LO1-LO2 specifically on these aspects of orientation processing has not been reported in humans, but it has been shown that the type of IT lesions that affect monkeys’ tilt discrimination does not impact their ability to discriminate stimuli differing from one another in terms of axis correspondence or axis polarity correspondence (Gross, Citation1978; Holmes & Gross, Citation1984). However, damage to the inferior parietal cortex has been found to affect both monkeys’ (Eacott & Gaffan, Citation1991) and human patients’ ability to discriminate mirror images of objects (a condition termed “mirror agnosia”; Davidoff & Warrington, Citation1999, Citation2001; Turnbull & McCarthy, Citation1996; Priftis et al., Citation2003; Turnbull et al., Citation1997; Martinaud et al., Citation2014; Harris et al., Citation2001; Vinckier et al., Citation2006). Altogether, these observations invite three inferences: (1) tilt is computed in both the ventral stream (for visual perception) and the dorsal stream (for action); (2) the parietal dorsal stream critically contributes to axis correspondence and axis polarity correspondence for both action and perception; (3) another region of the parietal dorsal stream is critical for locating objects for action and perception; (4) thus, computing axis correspondence, axis polarity correspondence and location for the mapping of ISCRs onto higher frames (spatiotopic or body-centred) may require a dorsal-to-ventral flow of information.
The idea that a dorsal-to-ventral flow of information may underlie some aspects of visual perception is not new (e.g., Farivar, Citation2009; Milner, Citation2017, for review). Additional evidence in support of this view comes, for instance, from a study showing that the inactivation of macaques’ dorsal stream (posterior parietal cortex) hampers behavioural performance during a three-dimensional object vision task and reduces functional magnetic resonance imaging (fMRI) activations in both the dorsal and ventral streams (Van Dromme et al., Citation2016). Under this hypothesis, Davida’s disorder may be interpreted as a consequence of a deficient dorsal to ventral flow of information required for the accurate mapping of ISCRs onto higher frames. If this interpretation is correct, the nature and functional locus of Davida’s disorder would provide new insight into the contribution and locus of integration of dorsal stream information to visual perception. Although the parietal (dorsal) stream is often assumed to play a critical role in coordinate matching, the precise type of information that it contributes and how this information is integrated with information processed in the ventral stream remains unclear (Colby, Citation1998; Duhamel et al., Citation1992; Olson, Citation2003). If our interpretation of the origin of her disorder is correct, then, Davida’s disorder provides clear answers to aspects of these issues: one role of the dorsal stream is to provide axis correspondence and axis polarity correspondence information at the precise stage at which ISCRs are mapped onto a higher frame.
Another striking aspect of Davida’s disorder is its specificity to ISCRs derived from a selective set of cues. As discussed above, the types of cues leading to intact versus impaired orientation perception appear to reflect a division between those originally derived from the magnocellular versus the parvocellular channel. This, and the fact that the different cues assumed to bias processing towards or away from the parvocellular pathway have highly similar effects on Davida’s performance led us to propose that her disorder may arise from a single deficit affecting the mapping of ISCRs computed from information derived from the parvocellular channel. Evidence consistent with this view are the results of the performance of two other neuropsychological cases whose deficits in perceiving the orientation and location of stimuli was modulated by visual properties similar to those affecting Davida’s performance (McCloskey et al., Citation1995; Pflugshaupt et al., Citation2007). McCloskey and colleagues (McCloskey, Citation2004, Citation2009; McCloskey et al., Citation1995) reported an individual, A.H., whose severe disorder in perceiving the location and orientation of objects was tempered when the stimuli were presented only briefly or had a low luminance contrast with the background. Pflugshaupt et al. (Citation2007) reported the case of a brain-damaged adult, P.R., who perceived objects as if they were left-right reverted but whose perception became flawless when the objects were flickering rapidly or when they were presented for only a very short duration.
One interpretation of these observations is that the visual system may be divided into an M-based transient and a P-based sustained visual subsystems, both of which compute the location and orientation of shapes, and which may be selectively impaired: in these cases the selective impairment would be to the P-based sustained visual subsystem (McCloskey, Citation2009). This conclusion may seem surprising given the considerable mixing of the M- and P-channels in the primary and extrastriate visual cortex (Ferrera et al., Citation1994; Merigan & Maunsell, Citation1993; Nassi & Callaway, Citation2009; Sincich & Horton, Citation2005). However, direct connections between the P- and M- pathways and several extrastriate areas have also been documented (Nassi, Lyon, & Callaway, Citation2006; Yabuta et al., Citation2001; Yarch et al., Citation2019) and there is recent evidence that cortical responses to stimuli differing along several dimensions (colour vs luminance; 2D vs 3D; high vs low levels of luminance contrast; high vs low levels of spatial frequency) tend to cluster in separate Magnocellular-derived and parvocellular-derived columns in most of the retinotopic extrastriate cortex (Tootell & Nasr, Citation2017). In this view, illustrated in , Davida’s disorder could result from a specific deficit within the system in charge of computing and mapping onto higher frame ISCRs derived from parvocellular information.
One challenge faced by this view, however, is that it does not easily account for the fact that most cases of patients who suffer from orientation and/or localization disorders in the context of dorsal stream lesions do not appear to show any sign of influence of visual variables. Given that many situations in daily life naturally favour one pathway or the other, such as reading in natural light or in the dark, it seems unlikely that the effects of visual variables in these patients would simply have gone undetected. Indeed, that Davida’s, P.R.’s and A.H.’s deficits with stationary high contrast shapes did not generalize (or at least not to the same level of severity) to other types of stimuli was rather obvious. Davida spontaneously reported having difficulties only with certain types of 2D stimuli and that it was easier for her to read in the dark. A.H. led an apparently normal life (McCloskey, Citation2009) and P.R. reported that she could read normally under flickering lighting conditions (Pflugshaupt et al., Citation2007). One way to reconcile these contrasting patterns of association and dissociation with the view that shape representations (ISCRs) derived from information originating from the magnocellular and parvocellular pathways remain segregated in the ventral stream would be to assume that ISCRs computed from information derived from the parvocellular or the magnocellular channel are collectively differentially connected to putatively parietal mapping mechanisms. Damage to the dorsal mapping mechanism would lead to deficits irrespective of the type of visual information. In contrast, deficits would be expected to be limited to only some types of cues in case of a disconnection between the mapping mechanism and spatially distributed ISCRs.
It is important to note, however, that Davida’s profile does not require that information from the parvocellular and magnocellular channels remain segregated in the ventral stream. Indeed, her profile is equally compatible with the idea that the parietal (dorsal) mapping mechanisms, rather than the (ventral) ISCRs, are sensitive to the distinction between information originating from the two main subcortical pathways. Davida’s disorder could result from a selective failure to recruit the necessary dorsal mapping mechanism when the information that reaches her visual system comes mainly from the parvocellular pathway. A similar incapacity to access dorsal stream cortex from information derived from the parvocellular channel has been reported in blindsight individuals who can process motion information from luminance but not from (parvocellular biased) chromatic information (Alexander & Cowey, Citation2013). Given that the large majority of input to the dorsal stream comes from magnocellular projections (Merigan & Maunsell, Citation1993), an advantage of this hypothesis is that it provides a natural explanation to the finding that, to date, the three reported neuropsychological cases who presented with an orientation perception disorder influenced by the nature of the visual stimuli all showed an advantage for visual variable biased toward the magnocellular pathway.
Author contributions
G.V administered the experiments and analyzed the data. The three authors conceptualized the study and wrote the manuscript.
Acknowledgments
We thank Rick Born, Patrick Cavanagh, Bevil Conway, Jack Gallant, Mel Goodale, Michael McCloskey and James Pomerantz for their helpful suggestions, Eric Falke for referring Davida to us for further study, Sarah Carneiro for collecting part of the data from control participants, and Michael McCloskey for providing us the code that we used to generate the shape-from-motion stimuli in experiment 6.10. We are especially grateful to Davida and her family for their time, motivation and kindness. This research was supported by the Mind, Brain and Behavior Interfaculty Initiative provostial funds to A.C.
Disclosure statement
No potential conflict of interest was reported by the author(s).
Additional information
Funding
References
- Alexander, I., & Cowey, A. (2013). Isoluminant coloured stimuli are undetectable in blindsight even when they move. Experimental Brain Research, 225(1), 147–152. https://doi.org/10.1007/s00221-012-3355-6
- Asch, S. E., & Witkin, H. A. (1948). Studies in space orientation: I. Perception of the upright with displaced visual fields. Journal of Experimental Psychology, 38(3), 325. https://doi.org/10.1037/h0057855
- Barton, J. J. S., Malcolm, G. L., & Hefter, R. L. (2007). Spatial processing in Bálint syndrome and prosopagnosia: A study of three patients. Journal of Neuro-Ophthalmology, 27(4), 268–274. https://doi.org/10.1097/WNO.0b013e31815b9b85
- Baylis, G. C., & Baylis, L. L. (2001). Visually misguided reaching in Balint’s syndrome. Neuropsychologia, 39(8), 865–875. https://doi.org/10.1016/S0028-3932(01)00009-4
- Biederman, I. (1987). Recognition-by-components: A theory of human image understanding. Psychological Review, 94(2), 115–147. https://doi.org/10.1037/0033-295X.94.2.115
- Blake, R. (2001). A primer on binocular rivalry, including current controversies. Brain and Mind, 2(1), 5–38. https://doi.org/10.1023/A:1017925416289
- Bryant, B. R., Wiederholt, J. L., & Bryant, D. P. (1991). Gray diagnostic reading tests–second edition (GRDT-2). Pro-Ed.
- Bushnell, B. N., Harding, P. J., Kosai, Y., Bair, W., & Pasupathy, A. (2011). Equiluminance cells in visual cortical area V4. Journal of Neuroscience, 31(35), 12398–12412. https://doi.org/10.1523/JNEUROSCI.1890-11.2011
- Caramazza, A., & Hillis, A. E. (1990). Levels of representation, co-ordinate frames, and unilateral neglect. Cognitive Neuropsychology, 7(5–6), 391–445. https://doi.org/10.1080/02643299008253450
- Cavanagh, P., Hénaff, M. A., Michel, F., Landis, T., Troscianko, T., & Intriligator, J. (1998). Complete sparing of high-contrast color input to motion perception in cortical color blindness. Molecular Cell, 1(3), 242–247. https://doi.org/10.1038/688
- Chainay, H., & Humphreys, G. W. (2001). The real-object advantage in agnosia: Evidence for a role of surface and depth information in object recognition. Cognitive Neuropsychology, 18(2), 175–191. https://doi.org/10.1080/02643290042000062
- Chaisilprungraung, T., German, J., & McCloskey, M. (2019). How are object shape axes defined? Evidence from mirror-image confusions. Journal of Experimental Psychology: Human Perception and Performance, 45(1), 111–124. https://doi.org/10.1037/xhp0000592
- Chandrasekaran, C., Canon, V., Dahmen, J. C., Kourtzi, Z., & Welchman, A. E. (2007). Neural correlates of disparity-defined shape discrimination in the human brain. Journal of Neurophysiology, 97(2), 1553–1565. https://doi.org/10.1152/jn.01074.2006
- Chen, G., Lu, H. D., & Roe, A. W. (2008). A map for horizontal disparity in monkey V2. Neuron, 58(3), 442–450. https://doi.org/10.1016/j.neuron.2008.02.032
- Colby, C. L. (1998). Action-oriented spatial reference frames in cortex. Neuron, 20(1), 15–24. https://doi.org/10.1016/S0896-6273(00)80429-8
- Conners, C. K. (2010). Conners comprehensive behavior rating scales (Conners CBRS). Multi-Health Systems.
- Connor, C. E., & Knierim, J. J. (2017). Integration of objects and space in perception and memory. Nature Neuroscience, 20(11), 1493–1503. https://doi.org/10.1038/nn.4657
- Conway, B. R. (2014). Color signals through dorsal and ventral visual pathways. Visual Neuroscience, 31(2), 197–209. https://doi.org/10.1017/S0952523813000382
- Conway, B. R., Moeller, S., & Tsao, D. Y. (2007). Specialized color modules in macaque extrastriate cortex. Neuron, 56(3), 560–573. https://doi.org/10.1016/j.neuron.2007.10.008
- Conway, B. R., & Tsao, D. Y. (2009). Color-tuned neurons are spatially clustered according to color preference within alert macaque posterior inferior temporal cortex. Proceedings of the National Academy of Sciences, 106(42), 18034–18039. https://doi.org/10.1073/pnas.0810943106
- Cooper, A. C. G., & Humphreys, G. W. (2000). Task-specific effects of orientation information: Neuropsychological evidence. Neuropsychologia, 38(12), 1607–1615. https://doi.org/10.1016/S0028-3932(00)00070-1
- Cowey, A., & Vaina, L. M. (2000). Blindness to form from motion despite intact static form perception and motion detection. Neuropsychologia, 38(5), 566–578. https://doi.org/10.1016/S0028-3932(99)00117-7
- Crawford, J. R., & Garthwaite, P. H. (2005). Testing for suspected impairments and dissociations in single-case studies in neuropsychology: Evaluation of alternatives using monte carlo simulations and revised tests for dissociations. Neuropsychology, 19(3), 318–331. https://doi.org/10.1037/0894-4105.19.3.318
- Crawford, J. R., & Howell, D. C. (1998). Comparing an individual’s test score against norms derived from small samples. The Clinical Neuropsychologist, 12(4), 482–486. https://doi.org/10.1076/clin.12.4.482.7241
- Davidoff, J., & Warrington, E. K. (1999). The bare bones of object recognition: Implications from a case of object recognition impairment. Neuropsychologia, 37(3), 279–292. https://doi.org/10.1016/S0028-3932(98)00076-1
- Davidoff, J., & Warrington, E. K. (2001). A particular difficulty in discriminating between mirror images. Neuropsychologia, 39(10), 1022–1036. https://doi.org/10.1016/S0028-3932(01)00039-2
- DeAngelis, G. C., Cumming, B. G., & Newsome, W. T. (1998). Cortical area MT and the perception of stereoscopic depth. Nature, 394(6694), 677–680. https://doi.org/10.1038/29299
- Delis, D. C., Kaplan, E., & Kramer, J. H. (2001). Delis-Kaplan executive function system®(D-KEFS®): Examiner’s manual: Flexibility of thinking, concept formation, problem solving, planning, creativity, impluse control, inhibition. Pearson.
- De Valois, R. L., Albrecht, D. G., & Thorell, L. G. (1982). Spatial frequency selectivity of cells in macaque visual cortex. Vision Research, 22(5), 545–559. https://doi.org/10.1016/0042-6989(82)90113-4
- Driver, J., Baylis, G. C., Goodrich, S. J., & Rafal, R. D. (1994). Axis-based neglect of visual shapes. Neuropsychologia, 32(11), 1353–1356. https://doi.org/10.1016/0028-3932(94)00068-9
- Driver, J., & Halligan, P. W. (1991). Can visual neglect operate in object-centred co-ordinates? An affirmative single-case study. Cognitive Neuropsychology, 8(6), 475–496. http://doi.org/10.1080/02643299108253384
- Driver, J., & Pouget, A. (2000). Object-centered visual neglect, or relative egocentric neglect? Journal of Cognitive Neuroscience, 12(3), 542–545. http://doi.org/10.1162/089892900562192
- Duhamel, J. R., Colby, C., & Goldberg, M. E. (1992). The updating of the representation of visual space in parietal cortex by intended eye movements. Science, 255(5040), 90–92. https://doi.org/10.1126/science.1553535
- Eacott, M. J., & Gaffan, D. (1991). The role of monkey inferior parietal cortex in visual discrimination of identity and orientation of shapes. Behavioural Brain Research, 46(1), 95–98. https://doi.org/10.1016/S0166-4328(05)80100-7
- El-Shamayleh, Y., & Pasupathy, A. (2016). Contour curvature as an invariant code for objects in visual area V4. Journal of Neuroscience, 36(20), 5532–5543. https://doi.org/10.1523/JNEUROSCI.4139-15.2016
- Farivar, R. (2009). Dorsal–ventral integration in object recognition. Brain Research Reviews, 61(2), 144–153. https://doi.org/10.1016/j.brainresrev.2009.05.006
- Felleman, D. J., & Van Essen, D. C. (1991). Distributed hierarchical processing in the primate cerebral cortex. Cerebral Cortex, 1(1), 1–47. https://doi.org/10.1093/cercor/1.1.1
- Ferrera, V., Nealey, T., & Maunsell, J. (1994). Responses in macaque visual area V4 following inactivation of the parvocellular and magnocellular LGN pathways. The Journal of Neuroscience, 14(4), 2080–2088. https://doi.org/10.1523/JNEUROSCI.14-04-02080.1994
- Fine, I., Wade, A. R., Brewer, A. A., May, M. G., Goodman, D. F., Boynton, G. M., Wandell, B. A., & MacLeod, D. I. A. (2003). Long-term deprivation affects visual perception and cortex. Nature Neuroscience, 6(9), 915–916. https://doi.org/10.1038/nn1102
- Flanagan, P., Cavanagh, P., & Favreau, O. E. (1990). Independent orientation-selective mechanisms for the cardinal directions of colour space. Vision Research, 30(5), 769–778. https://doi.org/10.1016/0042-6989(90)90102-Q
- Freud, E., Robinson, A. K., & Behrmann, M. (2018). More than action: The dorsal pathway contributes to the perception of 3-D structure. Journal of Cognitive Neuroscience, 30(7), 1047–1058. https://doi.org/10.1162/jocn_a_01262
- Friedman-Hill, S. R., Robertson, L. C., & Treisman, A. (1995). Parietal contributions to visual feature binding: Evidence from a patient with bilateral lesions. Science, 269(5225), 853–855. https://doi.org/10.1126/science.7638604
- Gallant, J. L., Braun, J., & Van Essen, D. (1993). Selectivity for polar, hyperbolic, and Cartesian gratings in macaque visual cortex. Science, 259(5091), 100–103. https://doi.org/10.1126/science.8418487
- Gallant, J. L., Connor, C. E., Rakshit, S., Lewis, J. W., & Van Essen, D. C. (1996). Neural responses to polar, hyperbolic, and Cartesian gratings in area V4 of the macaque monkey. Journal of Neurophysiology, 76(4), 2718–2739. https://doi.org/10.1152/jn.1996.76.4.2718
- Gioia, G. A., Isquith, P. K., Guy, S. C., & Kenworthy, L. (2000). BRIEF: Behavior rating inventory of executive function. Psychological Assessment Resources.
- Goodale, M. A., Milner, A. D., Jakobson, L. S., & Carey, D. P. (1991). A neurological dissociation between perceiving objects and grasping them. Nature, 349(6305), 154–156. https://doi.org/10.1038/349154a0
- Gregory, E., & McCloskey, M. (2010). Mirror-image confusions: Implications for representation and processing of object orientation. Cognition, 116(1), 110–129. https://doi.org/10.1016/j.cognition.2010.04.005
- Gross, C. G. (1978). Inferior temporal lesions do not impair discrimination of rotated patterns in monkeys. Journal of Comparative and Physiological Psychology, 92(6), 1095–1109. https://doi.org/10.1037/h0077515
- Harris, I. M., Harris, J. A., & Caine, D. (2001). Object orientation agnosia: A failure to find the axis? Journal of Cognitive Neuroscience, 13(6), 800–812. https://doi.org/10.1162/08989290152541467
- Holmes, E., & Gross, C. (1984). Effects of inferior temporal lesions on discrimination of stimuli differing in orientation. The Journal of Neuroscience, 4(12), 3063–3068. https://doi.org/10.1523/JNEUROSCI.04-12-03063.1984
- Holmes, G., & Horrax, G. (1919). Disturbances of spatial orientation and visual attention, with loss of stereoscopic vision. Archives of Neurology And Psychiatry, 1(4), 385–407. http://doi.org/10.1001/archneurpsyc.1919.02180040002001
- Hommel, B. (1993). The relationship between stimulus processing and response selection in the Simon task: Evidence for a temporal overlap. Psychological Research, 55(4), 280–290. https://doi.org/10.1007/BF00419688
- Hubel, D. H., & Wiesel, T. N. (1962). Receptive fields, binocular interaction and functional architecture in the cat’s visual cortex. The Journal of Physiology, 160(1), 106–154. https://doi.org/10.1113/jphysiol.1962.sp006837
- Hummel, J. E. (2001). Complementary solutions to the binding problem in vision: Implications for shape perception and object recognition. Visual Cognition, 8(3-5), 489–517. https://doi.org/10.1080/13506280143000214
- Humphreys, G. W. (1983). Reference frames and shape perception. Cognitive Psychology, 15(2), 151–196. https://doi.org/10.1016/0010-0285(83)90008-7
- Ishihara, S. (1987). Test for colour-blindness. Kanehara.
- Jiang, Y., Boehler, C. N., Nönnig, N., Düzel, E., Hopf, J. M., Heinze, H. J., & Schoenfeld, M. A. (2008). Binding 3-D object perception in the human visual cortex. Journal of Cognitive Neuroscience, 20(4), 553–562. https://doi.org/10.1162/jocn.2008.20050
- Karnath, H. O., Ferber, S., & Bülthoff, H. H. (2000). Neuronal representation of object orientation. Neuropsychologia, 38(9), 1235–1241. https://doi.org/10.1016/S0028-3932(00)00043-9
- Kim, T., Bair, W., & Pasupathy, A. (2019). Neural coding for shape and texture in macaque area V4. The Journal of Neuroscience, 39(24), 4760–4774. https://doi.org/10.1523/JNEUROSCI.3073-18.2019
- Kolster, H., Peeters, R., & Orban, G. A. (2010). The retinotopic organization of the human middle temporal area MT/V5 and its cortical neighbors. Journal of Neuroscience, 30(29), 9801–9820. https://doi.org/10.1523/JNEUROSCI.2069-10.2010
- Larsson, J., & Heeger, D. J. (2006). Two retinotopic visual areas in human lateral occipital cortex. Journal of Neuroscience, 26(51), 13128–13142. https://doi.org/10.1523/JNEUROSCI.1657-06.2006
- Leek, E. C., Reppa, I., & Arguin, M. (2005). The structure of three-dimensional object representations in human vision: Evidence from whole-part matching. Journal of Experimental Psychology: Human Perception and Performance, 31(4), 668. https://doi.org/10.1037/0096-1523.31.4.668
- Livingstone, M. S., & Hubel, D. H. (1987). Psychophysical evidence for separate channels for the perception of form, color, movement, and depth. Journal of Neuroscience, 7(11), 3416–3468. https://doi.org/10.1523/JNEUROSCI.07-11-03416.1987
- Luria, A. R. (1959). Disorders of “simultaneous perception” in a case of bilateral occipito-parietal brain injury. Brain, 82(3), 437–449. https://doi.org/10.1093/brain/82.3.437
- Macdonald, J., & VanRullen, R. (2010). Perceptual echoes at 10 Hz in human EEG. Journal of Vision, 10(7), 924–924. https://doi.org/10.1167/10.7.924
- Mach, E. (1959). The analysis of sensations. Dover.
- Mahon, B. Z., Kumar, N., & Almeida, J. (2013). Spatial frequency tuning reveals interactions between the dorsal and ventral visual systems. Journal of Cognitive Neuroscience, 25(6), 862–871. https://doi.org/10.1162/jocn_a_00370
- Marr, D., & Nishihara, H. K. (1978). Representation and recognition of the spatial organization of three-dimensional shapes. Proceedings of the Royal Society of London. Series B. Biological Sciences, 200(1140), 269–294. https://doi.org/10.1098/rspb.1978.0020
- Martinaud, O., Mirlink, N., Bioux, S., Bliaux, E., Champmartin, C., Pouliquen, D., Cruypeninck, Y., Hannequin, D., & Gérardin, E. (2016). Mirrored and rotated stimuli are not the same: A neuropsychological and lesion mapping study. Cortex, 78, 100–114. https://doi.org/10.1016/j.cortex.2016.03.002
- Martinaud, O., Mirlink, N., Bioux, S., Bliaux, E., Lebas, A., Gerardin, E., & Hannequin, D. (2014). Agnosia for mirror stimuli: A new case report with a small parietal lesion. Archives of Clinical Neuropsychology, 29(7), 724–728. https://doi.org/10.1093/arclin/acu032
- McCarney, D., & Greenberg, L. M. (1990). Test of variables of attention (TOVA). Attention Technology.
- McCloskey, M. (2009). Visual reflections: A perceptual deficit and its implications. Oxford University Press.
- McCloskey, M. (2004). Spatial representations and multiple-visual-systems hypotheses: Evidence from a developmental deficit in visual location and orientation processing. Cortex, 40(4–5), 677–694. https://doi.org/10.1016/S0010-9452(08)70164-3
- McCloskey, M., Rapp, B., Yantis, S., Rubin, G., Bacon, W. F., Dagnelie, G., Gordon, B., Aliminosa, D., Boatman, D. F., Badecker, W., Johnson, D. N., Tusa, R. J., & Palmer, E. (1995). A developmental deficit in localizing objects from vision. Psychological Science, 6(2), 112–117. https://doi.org/10.1111/j.1467-9280.1995.tb00316.x
- McCloskey, M., Valtonen, J., & Cohen Sherman, J. (2006). Representing orientation: A coordinate-system hypothesis and evidence from developmental deficits. Cognitive Neuropsychology, 23(5), 680–713. https://doi.org/10.1080/02643290500538356
- McKyton, A., & Zohary, E. (2007). Beyond retinotopic mapping: The spatial representation of objects in the human lateral occipital complex. Cerebral Cortex, 17(5), 1164–1172. https://doi.org/10.1093/cercor/bhl027
- Melcher, D., & Morrone, M. C. (2015). Nonretinotopic visual processing in the brain. Visual Neuroscience, 32, E017. https://doi.org/10.1017/S095252381500019X
- Merigan, W. H., & Maunsell, J. H. R. (1993). How parallel are the primate visual pathways? Annual Review of Neuroscience, 16(1), 369–402. https://doi.org/10.1146/annurev.ne.16.030193.002101
- Milner, A. D. (2017). How do the two visual streams interact with each other? Experimental Brain Research, 235(5), 1297–1308. https://doi.org/10.1007/s00221-017-4917-4
- Milner, D., & Goodale, M. (2006). The visual brain in action (Vol. 27). OUP.
- Morland, A. B., Jones, S. R., Finlay, A. L., Deyzac, E., Lê, S., & Kemp, S. (1999). Visual perception of motion, luminance and colour in a human hemianope. Brain, 122(6), 1183–1198. https://doi.org/10.1093/brain/122.6.1183
- Mozer, M. C. (2002). Frames of reference in unilateral neglect and visual perception: A computational perspective. Psychological Review, 109(1), 156–185. http://doi.org/10.1037/0033-295X.109.1.156
- Murray, S. O., Olshausen, B. A., & Woods, D. L. (2003). Processing shape, motion and three-dimensional shape-from-motion in the human cortex. Cerebral Cortex, 13(5), 508–516. https://doi.org/10.1093/cercor/13.5.508
- Nakayama, K., He, Z. J., & Shimojo, S. (1995). Visual surface representation: A critical link between lower-level and higher-level vision. In S. M. Kosslyn & D. N. Osherson (Eds.), Visual cognition: An invitation to cognitive science (pp. 1–70). The MIT Press.
- Nandy, A. S., Sharpee, T. O., Reynolds, J. H., & Mitchell, J. F. (2013). The fine structure of shape tuning in area V4. Neuron, 78(6), 1102–1115. http://doi.org/10.1016/j.neuron.2013.04.016
- Nassi, J. J., & Callaway, E. M. (2009). Parallel processing strategies of the primate visual system. Nature Reviews Neuroscience, 10(5), 360–372. https://doi.org/10.1038/nrn2619
- Nassi, J. J., Lyon, D. C., & Callaway, E. M. (2006). The parvocellular LGN provides a robust disynaptic input to the visual motion area MT. Neuron, 50(2), 319–327. http://doi.org/10.1016/j.neuron.2006.03.019
- Oleskiw, T. D., Nowack, A., & Pasupathy, A. (2018). Joint coding of shape and blur in area V4. Nature Communications, 9(1), 1–13. https://doi.org/10.1038/s41467-017-02438-8
- Olson, C. R. (2003). Brain representation of object-centered space in monkeys and humans. Annual Review of Neuroscience, 26(1), 331–354. https://doi.org/10.1146/annurev.neuro.26.041002.131405
- Palmer, S., & Rock, I. (1994). Rethinking perceptual organization: The role of uniform connectedness. Psychonomic Bulletin & Review, 1(1), 29–55. https://doi.org/10.3758/BF03200760
- Palmer, S. E. (1999). Vision science: Photons to phenomenology. MIT press.
- Palmer, S. E. (1985). The role of symmetry in shape perception. Acta Psychologica, 59(1), 67–90. https://doi.org/10.1016/0001-6918(85)90042-3
- Palmer, S. E. (1989). Reference frames in the perception of shape and orientation. In B. E. Shepp & S. Ballesteros (Eds.), Object perception: Structure and process (pp. 121–163). Lawrence Erlbaum Associates.
- Pasupathy, A., & Connor, C. E. (2001). Shape representation in area V4: Position-specific tuning for boundary conformation. Journal of Neurophysiology, 86(5), 2505–2519. https://doi.org/10.1152/jn.2001.86.5.2505
- Pasupathy, A., El-Shamayleh, Y., & Popovkina, D. V. (2018). Visual shape and object perception. In M. Sherman (Ed.), Oxford research encyclopedia of neuroscience (pp. 1–28). Oxford Research Encyclopedia.
- Peirce, J. W. (2007). Psychopy—Psychophysics software in python. Journal of Neuroscience Methods, 162(1–2), 8–13. https://doi.org/10.1016/j.jneumeth.2006.11.017
- Peirce, J. W. (2009). Generating stimuli for neuroscience using PsychoPy. Frontiers in Neuroinformatics, 2(10), 1–8. https://doi.org/10.3389/neuro.11.010.2008
- Pelli, D. G., Robson, J. G., & Wilkins, A. J. (1988). The design of a new letter chart for measuring contrast sensitivity. Clinical Vision Sciences, 2(3), 187–199.
- Pflugshaupt, T., Nyffeler, T., von Wartburg, R., Wurtz, P., Lüthi, M., Hubl, D., Gutbrod, K., Juengling, F., Hess, C., & Müri, R. M. (2007). When left becomes right and vice versa: Mirrored vision after cerebral hypoxia. Neuropsychologia, 45(9), 2078–2091. https://doi.org/10.1016/j.neuropsychologia.2007.01.018
- Priftis, K., Rusconi, E., Umiltà, C., & Zorzi, M. (2003). Pure agnosia for mirror stimuli after right inferior parietal lesion. Brain, 126(4), 908–919. https://doi.org/10.1093/brain/awg075
- Quinlan, P. T., & Humphreys, G. W. (1993). Perceptual frames of reference and two-dimensional shape recognition: Further examination of internal axes. Perception, 22(11), 1343–1364. https://doi.org/10.1068/p221343
- Ricci, M., & Serre, T. (2020). Hierarchical models of the visual system. In D. Jaeger & R. Jung (Eds.), Encyclopedia of computational neuroscience (pp. 1–14). Springer. https://doi.org/10.1007/978-1-4614-7320-6_345-2
- Riddock, M. J., Humphreys, G. W., Jacobson, S., Pluck, G., Bateman, A., & Edwards, M. (2004). Impaired orientation discrimination and localisation following parietal damage: On the interplay between dorsal and ventral processes in visual perception. Cognitive Neuropsychology, 21(6), 597–623. https://doi.org/10.1080/02643290342000230
- Riesenhuber, M., & Poggio, T. (2000). Models of object recognition. Nature Neuroscience, 3(S11), 1199–1204. https://doi.org/10.1038/81479
- Rizzo, M., Nawrot, M., & Zihl, J. (1995). Motion and shape perception in cerebral akinetopsia. Brain, 118(5), 1105–1127. https://doi.org/10.1093/brain/118.5.1105
- Robinson, G., Cohen, H., & Goebel, A. (2011). A case of complex regional pain syndrome with agnosia for object orientation. Pain, 152(7), 1674–1681. https://doi.org/10.1016/j.pain.2011.02.010
- Rock, I. (1973). Orientation and form. Academic Press.
- Roe, A. W., Chelazzi, L., Connor, C. E., Conway, B. R., Fujita, I., Gallant, J. L., Lu, H., Vanduffel, W. (2012). Toward a unified theory of visual area V4. Neuron, 74(1), 12–29. https://doi.org/10.1016/j.neuron.2012.03.011
- Rust, N. C., & DiCarlo, J. J. (2010). Selectivity and tolerance (“invariance”) both increase as visual information propagates from cortical area V4 to IT. Journal of Neuroscience, 30(39), 12978–12995. https://doi.org/10.1523/JNEUROSCI.0179-10.2010
- Sandoval, J., & Echandia, A. (1994). Behavior assessment system for children. Journal of School Psychology, 32(4), 419–425. https://doi.org/10.1016/0022-4405(94)90037-X
- Sebastian, S., Burge, J., & Geisler, W. S. (2015). Defocus blur discrimination in natural images with natural optics. Journal of Vision, 15(5), 16. https://doi.org/10.1167/15.5.16
- Sekuler, A. B. (1996). Axis of elongation can determine reference frames for object perception. Canadian Journal of Experimental Psychology/Revue Canadienne de Psychologie Expérimentale, 50(3), 270–279. https://doi.org/10.1037/1196-1961.50.3.270
- Sekuler, A. B., & Swimmer, M. B. (2000). Interactions between symmetry and elongation in determining reference frames for object perception. Canadian Journal of Experimental Psychology/Revue Canadienne de Psychologie Expérimentale, 54(1), 42–56. https://doi.org/10.1037/h0087329
- Sheslow, D., & Adams, W. (2003). Wide range assessment of memory and learning–Second edition (WRAML2). Wide Range Inc.
- Silson, E. H., McKeefry, D. J., Rodgers, J., Gouws, A. D., Hymers, M., & Morland, A. B. (2013). Specialized and independent processing of orientation and shape in visual field maps LO1 and LO2. Nature Neuroscience, 16(3), 267–269. https://doi.org/10.1038/nn.3327
- Sincich, L. C., & Horton, J. C. (2005). The circuitry of V1 and V2: Integration of color, form, and motion. Annual Review of Neuroscience, 28(1), 303–326. https://doi.org/10.1146/annurev.neuro.28.061604.135731
- Singer, W. (1999). Neuronal synchrony: A versatile code review for the definition of relations. Neuron, 24(1), 49–65. http://doi.org/10.1016/S0896-6273(00)80821-1
- Solms, M., Kaplan-Solms, K., Saling, M., & Miller, P. (1988). Inverted vision after frontal lobe disease. Cortex, 24(4), 499–509. https://doi.org/10.1016/S0010-9452(88)80044-3
- Subbiah, I., & Caramazza, A. (2000). Stimulus-centered neglect in reading and object recognition. Neurocase, 6(1), 13–31. https://doi.org/10.1080/13554790008402754
- Tanigawa, H., Lu, H. D., & Roe, A. W. (2010). Functional organization for color and orientation in macaque V4. Nature Neuroscience, 13(12), 1542–1548. https://doi.org/10.1038/nn.2676
- Tipper, S. P., & Behrmann, M. (1996). Object-centered not scene-based visual neglect. Journal of Experimental Psychology: Human Perception and Performance, 22(5), 1261–1278. https://doi.org/10.1037/0096-1523.22.5.1261
- Tootell, R. B. H., & Nasr, S. (2017). Columnar segregation of magnocellular and parvocellular streams in human extrastriate cortex. Journal of Neuroscience, 37(33), 8014–8032. https://doi.org/10.1523/JNEUROSCI.0690-17.2017
- Torgesen, J. K., Wagner, R. K., & Rashotte, C. A. (2012). TOWRE-2 examiner’s manual. Pro-Ed.
- Townsend, J. T., & Ashby, F. G. (1983). Stochastic modeling of elementary psychological processes. CUP Archive.
- Tse, P. U., & Palmer, S. E. (2012). Visual Object processing. In A. F. Healy & R. W. Proctor (Eds.), Handbook of psychology, second edition (pp. 181–211). Wiley.
- Turnbull, O. H., Beschin, N., & Della Sala, S. (1997). Agnosia for object orientation: Implications for theories of object recognition. Neuropsychologia, 35(2), 153–163. https://doi.org/10.1016/S0028-3932(96)00063-2
- Turnbull, O. H., Laws, K. R., & McCarthy, R. A. (1995). Object recognition without knowledge of object orientation. Cortex, 31(2), 387–395. https://doi.org/10.1016/S0010-9452(13)80371-1
- Turnbull, O. H., & McCarthy, R. A. (1996). Failure to discriminate between mirror-image objects: A case of viewpoint-independent object recognition? Neurocase, 2(1), 63–72. https://doi.org/10.1080/13554799608402390
- Ungerleider, L. G., & Bell, A. H. (2011). Uncovering the visual “alphabet”: Advances in our understanding of object perception. Vision Research, 51(7), 782–799. https://doi.org/10.1016/j.visres.2010.10.002
- Ungerleider, L. G., Galkin, T. W., Desimone, R., & Gattass, R. (2008). Cortical connections of area V4 in the macaque. Cerebral Cortex, 18(3), 477–499. http://doi.org/10.1093/cercor/bhm061
- Valtonen, J., Dilks, D. D., & McCloskey, M. (2008). Cognitive representation of orientation: A case study. Cortex, 44(9), 1171–1187. https://doi.org/10.1016/j.cortex.2007.06.005
- Van Dromme, I. C., Premereur, E., Verhoef, B. E., Vanduffel, W., & Janssen, P. (2016). Posterior parietal cortex drives inferotemporal activations during three-dimensional object vision. PLoS Biology, 14(4), e1002445. https://doi.org/10.1371/journal.pbio.1002445
- Vannuscorps, G., Galaburda, A., & Caramazza, A. (2021). The form of reference frames in vision: The case of intermediate shape-centered representations. Submitted.
- VanRullen, R. (2016). Perceptual cycles. Trends in Cognitive Sciences, 20(10), 723–735. https://doi.org/10.1016/j.tics.2016.07.006
- Vernon, R. J. W., Gouws, A. D., Lawrence, S. J. D., Wade, A. R., & Morland, A. B. (2016). Multivariate patterns in the human object-processing pathway reveal a shift from retinotopic to shape curvature representations in lateral occipital areas, LO-1 and LO-2. Journal of Neuroscience, 36(21), 5763–5774. https://doi.org/10.1523/JNEUROSCI.3603-15.2016
- Vinckier, F., Naccache, L., Papeix, C., Forget, J., Hahn-Barma, V., Dehaene, S., & Cohen, L. (2006). “What” and “where” in word reading: ventral coding of written words revealed by parietal atrophy. Journal of Cognitive Neuroscience, 18(12), 1998–2012. http://doi.org/10.1162/jocn.2006.18.12.1998
- Wagemans, J., Elder, J. H., Kubovy, M., Palmer, S. E., Peterson, M. A., Singh, M., & von der Heydt, R. (2012). A century of Gestalt psychology in visual perception: I. Perceptual grouping and figure–ground organization. Psychological Bulletin, 138(6), 1172–1217. https://doi.org/10.1037/a0029333
- Wagner, R., Torgesen, J., Rashotte, C., & Pearson, N. A. (1999). CTOPP-2: Comprehensive test of phonological processing–Second edition. Pro-ed.
- Wandell, B. A., Dumoulin, S. O., & Brewer, A. A. (2007). Visual field maps in human cortex. Neuron, 56(2), 366–383. https://doi.org/10.1016/j.neuron.2007.10.012
- Wechsler, D. (2003). Wechsler intelligence scale for children (4th ed.). PsychCorp.
- Wiig, E. H., Semel, E. M., & Secord, W. (2003). CELF 5: Clinical evaluation of language fundamentals. Pearson/PsychCorp.
- Yabuta, N. H., Sawatari, A., & Callaway, E. M. (2001). Two functional channels from primary visual cortex to dorsal visual cortical areas. Science, 292(5515), 297–300. https://doi.org/10.1126/science.1057916
- Yarch, J., Larsen, H., Chen, M., & Angelucci, A. (2019). Morphological cell types projecting from V1 layer 4B to V2 thick and thin stripes. The Journal of Neuroscience, 39(38), 7501–7512. https://doi.org/10.1523/JNEUROSCI.1096-19.2019
- Zeki, S. (1990). A century of cerebral achromatopsia. Brain, 113(6), 1721–1777. https://doi.org/10.1093/brain/113.6.1721
- Zihl, J., Von Cramon, D., & Mai, N. (1983). Selective disturbance of movement vision after bilateral brain damage. Brain, 106(2), 313–340. doi:10.1093/brain/106.2.313
Appendix
Case history
Davida is a right-handed (Oldfield’s Laterality Index of 80), athletic (she is skillful at many sports, including soccer and basketball) and very cooperative young woman. She was 15 years old when this study began in October 2016 and 17 years old when it ended in March 2019. Information regarding her early history was obtained from her parents through a developmental and family history questionnaire and by reviewing her medical record.
Medical and developmental history
Davida was born at 33.5 weeks by cesarean section and was twin B of a twin pregnancy. The pregnancy was notable for preeclampsia. The cesarean section occurred after premature rupture of the membranes of Twin A and an increased fetal heart rate. Davida was 2,385 grams at birth (normal for gestational age), was immediately alert and active, and had Apgar scores of 8 and 9 at 1 and 5 minutes, respectively. Davida stayed in the hospital for 4 weeks after birth to gain weight. She required nasal CPAP support for a few days after delivery, but the newborn period was otherwise uneventful. Early developmental milestones were achieved within the usual time frames and she revealed no other medical or developmental issues. Although Davida tested normal in vision and hearing exams, she struggled with reading starting in the 2nd grade. She achieved partial compensation for her reading difficulties though a strong work ethic and extensive support through private tutoring and other programs.
Neurological history
In December 2014 she had a normal neurological examination. A 1.5T brain MRI conducted in late 2015 revealed a normal brain with no evidence of cortical malformations or early injury. An electroencephalogram from early 2016 at rest and with photic stimulation was normal.
Psychiatric history
There were no issues to report in the psychiatric history. A psychological evaluation of her social and emotional functioning carried out in May 2014 using the Behavior Assessment System for Children, second Edition (Sandoval & Echandia, Citation1994) (BASC-2), found average scores in all scales, suggesting that there is no problematic anxiety, depression, sense of inadequacy, somatization, inattention or hyperactivity, and that her relationship with her parents, her interpersonal relations, self-esteem, locus of control and self-reliance were normal.
Neuropsychological history
A first evaluations performed in May 2014 concluded that Davida displayed: (1) average or above average performance on all the subtests of the WISC-IV ((Vaughn-Blount et al., 2011); all tests 37 < percentile < 84); (2) typical verbal (percentile 34) and visual (percentile 27) memory on the Wide Range Assessment of Memory and Learning-2 (Sheslow & Adams, Citation2003); (3) no clinically relevant executive function deficits on the Behavior Rating Inventory of Executive Function (Gioia, Isquith, Guy, & Kenworthy, Citation2000) (all Teacher’s and Parents’ T-scores < 65) or on the Tower test of the Delis-Kaplan Executive Function System (Delis, Kaplan, & Kramer, Citation2001) (Percentile 37); and (4) no other clinically relevant behavioral abnormalities on the Conners’ 3-T rating scale (Conners, Citation2010), other than the presence of learning problems (Teacher’s and Parents’ T-scores > 80; all other scales Teacher’s and Parents’ T-scores < 55).
A second evaluation, in June 2014, which focused on possible underpinnings of her reading difficulties, found: (1) intact phonological awareness and meta-phonological skills at the CTOPP-2 (Wagner, Torgesen, Rashotte, & Pearson, Citation1999) (Phonological Awareness Index, Elision, Blending Words and Phoneme Isolation tests, all 16 < Percentile < 92); (2) below average speed on rapid naming of letters, numbers (she was at Percentile 1 or below at the Rapid Letter and Rapid Digit Naming tests of the CTOPP-2) and words (she was at the percentile 1 for her age on the TOWRE-2 (Torgesen, Wagner, & Rashotte, Citation2012)); (3) excellent reading comprehension (percentile 95th on the untimed Gray Diagnostic Reading Test (Bryant, Wiederholt, & Bryant, Citation1991)), thus suggesting that, despite her lack of fluency, she was able to accurately extract meaning from text; (4) age-appropriate listening comprehension on the Understanding Spoken Paragraphs subtest of the CELF-5 (Wiig, Semel, & Secord, Citation2003); and (5) strong abstract thinking skills on the D-KEFS 20 (Delis et al., Citation2001). Davida had an atypical performance on the Test of Variables of Attention (McCarney & Greenberg, Citation1990), characterized by slow and inconsistent response times and a fast decline in her ability to inhibit incorrect responses over the time of testing, but the interpretation of these results is difficult given her visual disorder (see main text).
Ophthalmological history
The ophthalmological history was negative. An evaluation carried out in May 2017 revealed: (1) A normal pupillary exam without significant anisocoria or relative afferent pupillary defect; (2) Full eye movements with the patient’s being orthotropic in all directions of gaze at both distance and near. Smooth pursuit and horizontal and vertical saccades were intact; (3) An unremarkable anterior segment; (4) A dilated fundus with pink, sharp, normal, healthy-appearing optic nerves with 0.25 cup-to-disc ratio in each eye, flat healthy-appearing maculae with good foveal reflexes bilaterally, and a normal periphery; (5) Normal cyclopegic refraction with approximately plano in each eye. (6) Bilaterally normal Optical Coherence Tomography of the macula and the retinal nerve fiber layer; (7) Visual acuity of 20/15 binocularly, and at least 20/20 for each eye individually with the Snellen chart and a green background. During the test, she was not able to read the letters but instead described them. When asked to explain how many lines she sees in the letter “H” for instance, she replied “three lines”. When asked about their orientation, she replied “two horizontal and one vertical line”; (8) A normal color perception assessed on the Ishihara Test (Ishihara, Citation1987) and on the Farnsworth D-15 color test; (9) Normal contrast sensitivity measured with the Pelli-Robson contrast sensitivity test (Pelli & Robson, Citation1988). On the Pelli-Robson, she was asked to copy the letters, which she did, but in the wrong orientation; (10) Abnormal binocular vision: on a version of the Worth 4 dots test, Davida was asked to wear red-green glasses and to look at series of dots on a series of screens. There were always 1 or 2 green, 1 or 2 red and 1 or 2 black dots. Davida always reported the same experience—that of seeing stable black dots and rapidly flashing red and green dots in asynchrony. She would typically say “I see green-red-green-red”. She also reported the white background of the computer screen to flicker from green to red. When asked to report at what frequency the screen color changed, she responded “very fast”. When asked to clap her hands at the same frequency, she responded “I could not clap my hands so quickly”. This suggests a rapidly alternating ocular suppression. As a consequence, she demonstrated no perception of 3-dimentional structure based on binocular integration on Titmus Vision testing.
1. Additional information about the set of results §1
1.1. Arrow orientation judgment task
Davida was shown 80 arrows pointing up, down, left or right and asked to indicate the orientation of these arrows verbally (right, left, up or down) and simultaneously pointing with her finger in the same directions. These arrows were black and large (10 degrees of visual angle), and were displayed one at the time, at the center of the screen on white background, for as long as needed. Davida almost systematically (95% of the trials) responded as if the arrow pointed to 90 (20%), 180 (37.5%) or 270 (37.5%) clockwise degrees from the actual orientation.
1.2. Arrow copy task
Davida was shown 20 black, large (10 degrees of visual angle) arrows pointing up, down, left or right and asked to “draw what she saw”, including multiple orientations if needed. The stimuli were displayed one at the time, at the center of the screen, on white background, for one second. Davida drew on average 3.1 differently oriented versions of each displayed arrows. Among these, she included the correct orientation in most of the trials (19/20 trials), but also the equivalent of the displayed arrow pointing 90, 180 or 270 clockwise degrees from the actual orientation in 10/20, 16/20 and 17/20 trials, respectively. An illustration of Davida’s copying of arrows is shown on Movie S2, online. See also Movie S1 online for a discussion of what she perceives.
1.3. Object orientation decision task
Experiment 1: typical or atypical orientation? Davida was shown 40 line-drawings of objects from the Snodgrass and Vanderwart (1980) set once in their typical upright orientation and once upside-down. The stimuli were presented one at a time for as long as needed, and Davida was asked to decide whether each object was in its typical or atypical orientation. She responded incorrectly to 69/80 trials (35/40 errors for upright stimuli and 36/40 errors for inverted stimuli).
Experiment 2: typical or atypical orientation? Davida was shown 20 line-drawings of objects from the Snodgrass and Vanderwart (1980) set once in their typical upright orientation, once upside-down and once rotated by 90 degrees (10 objects clockwise and 10 objects counter-clockwise). The stimuli were displayed one at a time for as long as needed, and Davida was asked to decide whether each object was in its typical or atypical orientation. She responded incorrectly to 36/60 stimuli (11/20 errors for upright stimuli, 14/20 errors for inverted stimuli and 11/20 errors for rotated stimuli).
1.4. Abstract shape copy
Davida was shown 50 different abstract shapes and asked to copy them as accurately as possible on a separate sheet of paper while the stimulus remained in view. She systematically copied the shapes as if the stimuli were inverted vertically, reversed horizontally, plane-rotated by 90 or 180 degrees (e.g., see Figure S1). See also Movie S1 online for a discussion of what she perceives when shown an abstract shape on the computer screen.
Fig. S1. Examples of stimuli (displayed on the computer screen) and, below them, of Davida’s attempts to copy them as accurately as possible.
1.5. Letters and words copy task
Davida was shown the letters b, d, p and q one at a time, 5 times each, and 6 short palindromes (mug, gum, live, evil, dog, god) once each and was asked to copy them as accurately as possible on a separate sheet of paper while the stimulus remained in view. Stimuli were presented one at the time at the center of the screen and were composed of large (± 5 degrees of vertical visual angle) lower-case black letters in Calibri font on white background. She systematically copied the single letters () and the letters in the words as if they were inverted or rotated (see Figure 2E). An illustration of Davida’s copying of the single letters p, b, d and q is shown on Movie S3, online.
Table S1. Davida’s errors in the 5 blocks of the letters copy task.
1.6. Letters, words and numbers reading task
Davida was asked to read five times the 26 letters of the alphabet, and, in a separate session, 40 short palindromes composed of 3 to 6 letters (e.g., mug, gum, live, evil). Stimuli were composed of large (± 10 degrees of vertical visual angle) lower-case black letters in ComicSans font on a white background. In both sessions, Davida sat approximately 60 cm from the computer screen and was asked to read as accurately as possible stimuli displayed in a random order, one at the time, at the center of the screen for as long as needed. The responses were encoded by the experimenter. The next trial was initiated by the experimenter after response encoding. In the letter reading task, Davida read without noticeable hesitation and without errors all the non-orientation-critical letters – letters that have a unique shape in the alphabet. However, she hesitated noticeably before naming all the orientation-critical letters – letters that differ from at least one other letter in the alphabet only by its orientation (b, d, p, q, n, u, c, z). She named correctly 15% of them, confused 75% of them with another letter of similar shape but different orientation and declined to respond 10% of the time (see .). Davida was rather slow in reading the palindromes but read 77.5% of them (31/40) correctly: she read accurately all the 14 palindromes that contained no orientation-critical letter, all but one of the 18 containing at least one orientation-critical letter, but for which an orientation-sensitive letter confusion would have resulted in a non-word (she was unable to read “repaid”), but she made systematic errors in reading the 8 palindromes for which a letter confusion would result in plausible word (e.g., “deer” – “beer”, “doom” – “boom”, “peek” – “beek”, “raw” – “ram”). An illustration of Davida’s reading of the single letters p, b, d and q is shown on Movie S4, online.
Table S2. Davida’s errors in the 5 blocks of the letters reading task
On another task, Davida was asked to read the 10 digits and 20 2-digits numbers displayed one at a time at the center of the screen for as long as needed. The numbers were large (± 5 degrees of vertical visual angle) and drawn in black ComicSans on white background. Davida scored 22/30. Davida confused all the instances of the digits “6” and “9” (e.g., 68 « ninety-eight »), but made no other errors.
1.7. Localizing the tip of an arrow by pointing with the computer mouse pointer
On a first task, a large (±10 x 6 degrees of visual angle) black arrow pointing left, right, up or down was displayed at the center of the computer screen for an unlimited duration. On each trial, Davida was asked to use the computer mouse to move a small round cursor and click as precisely as possible on the tip of the arrow. This task was presented multiple times for a total of 560 trials. As shown in Figure S2 and illustrated in the Movie S5, Davida almost systematically mislocated the position of the tip to approximately the place it would have been if the arrow were rotated by 90 degrees (38.8%), 180 degrees (19.3%) or 270 degrees (41.9%).
Fig. S2. Each red dot represents the coordinates of one of Davida’s attempt at localizing the tip of an arrow pointing down (A), left (B), up (C) or right (D). Arrows appear in grey here for transparency, they were displayed in black during the experiment.
On a second task, a large (±10 x 6 degrees of visual angle) black arrow was displayed at the center of the computer screen for an unlimited duration and was either pointing upright (0 degrees) or at 20, 45, 70, 90, 110, 135, 160, 180, 200, 225, 250, 270, 290, 315 or 340 degrees clockwise. There were 10 trials for each 45 degrees steps (0, 45, 90, 135, 180, 225, 170, 315) and 5 trials for the other orientations for a total of 120 trials. On each trial, Davida was asked to use the computer mouse to move a small round cursor and click as precisely as possible on the tip of the arrow. Once again, as illustrated in the Movie S5 (part II), Davida almost systematically mislocated the position of the tip to approximately (+- 100 pixels) where it would have been if the arrow were rotated by 90 degrees (33.3%), 180 degrees (26.6%) or 270 degrees (30%).
1.8. The color after-effect with striped stimuli
Davida was asked to look for 1 minutes at a red screen with black vertical stripes and then, following this induction period, to describe as precisely as possible what she saw when the screen turned white. She reported seeing “a grid made of white bars over blue”. The perceived white and blue are typical of color after-effects and correspond to approximatively the complementary of the colors perceived during the induction period (black and red). The “grid” perceived over the test screen is compatible with her perceptual report of seeing the vertical black and red stripes of the induction screen alternating between a vertical and horizontal orientations.
1.9. Grasping the extremities of a line
In this task, three types of stimuli (black lines, black lines ending with a dot at each extremity or two dots) were displayed on a sheet of paper hanged at a comfortable distance in front of Davida (see Movie S6, online). On each trial, Davida was asked to place her right thumb and index finger on the extremities of the line or on the dots “as if she were grasping it/them”. Her fingers were inked in order to record her responses. In a first task the importance of accuracy was highlighted, and she carefully moved her fingers to the stimuli. In a second task, the importance of speed was stressed: she was asked to stand in front of the sheet of paper with her eyes closed and to open her eyes and move her fingers to the stimuli as fast as possible at the experimenter’s signal. Movie S6, online illustrates Davida’s performance in these experiments. When accuracy was stressed (Figure S3A), she almost always placed her fingers at approximately (a few millimeters from) the place where the extremities of the line would have been if the line (with or without the dots at the extremities) were rotated by 90 degrees (16/18) while this type of error was rare for the dots alone (1 error, 8/9 correct responses). When speed was stressed (Figure S3B), most of her errors consisted in placing her fingers at a few millimeters from the place where the extremities of the line would have been if the line were rotated by 90 degrees (14/18 trials), but she also made a few errors (3/18 trials, the three last errors illustrated in Figure S3B) consisting in placing her fingers at few millimeters from the place where the extremities of the line would have been if the line where rotated by approximately 45 degrees. As these errors were absent when accuracy was stressed (Figure S3A) and Davida never reported seeing stimuli rotated by 45 degrees, we interpret these errors as the result of hesitations between two percepts. Indeed, Davida reports seeing these lines continuously fluctuating between their accurate orientation and the equivalent of their rotation by 90 degrees. She made only two errors when shown two dots (Figure S3B).
Fig. S3. Davida’s fingerprints when she failed to carefully (A) or rapidly (B) move her thumb and index finger to either the extremities of a black line or two black dots. The line in red was added in this figure to illustrate where the line (or a line binding the two dots) would have been if it were rotated by 90 degrees.
1.10. Pointing to the tip of an arrow with the index finger
While standing, Davida saw a large black arrow pointing left, right, up or down displayed on a sheet of paper hung at a comfortable distance in front of her (see Movie S7, online). She was asked to stand with her eyes closed, and, at the experimenter’s signal, to open her eyes and place her index finger as fast as possible on the tip of the arrow. Her index finger was inked in order to record her responses. She almost systematically (25/26 trials) placed her index finger where the tip of the arrow would have been if the arrow were rotated by 90 degrees (34.6%), 180 degrees (7.7%) or 270 degrees (53.8%) clockwise (see Movie S7 online).
1.11. Stimulus–response compatibility task
In this task, participants were shown either a circle or a square on the computer screen and, below it, a black arrow pointing either toward the left or toward the right (see Figure S4). The participants were asked to press a button on the keyboard (the “z” key) as fast as possible with their left index finger when they saw a circle and with their right index finger (the “m” key) when they saw a square, while ignoring the arrow. In each trial, a fixation point was presented at the center of the screen for 500 ms; then the screen was cleared for 500 ms and the stimulus was displayed until a response was recorded. The next trial began after an interval of 1000 ms. The number of different stimuli was 4 (2 shapes x 2 arrow orientations). The experiment included 120 stimuli (30 random repetitions of each stimulus). Congruent trials were those in which the arrow pointed to the correct response key, i.e., an arrow pointing to the key that needed to be pressed for a correct response to a given stimulus. An incongruent trial was that in which the arrow pointed in the opposite direction from the desired key press response.
Analyses were performed to compare participants’ accuracy, latency and efficiency for congruent and incongruent trials. Responses faster than 200 ms (0%) and slower than 1000 ms (3.7%) were excluded from the analyses (Hommel, Citation1993). Response accuracy and response latency were analyzed separately. Response latency analyses were carried out over correct responses only. In addition, an efficiency score (expressed in ms) was computed for each participant by dividing the mean response latency by the proportion of correct responses in a given condition (thus, the higher the score the poorer the performance). This score allows combining the measures of accuracy and speed into a single measure of processing efficiency; also, it allows between-group comparisons unbiased by potential speed-accuracy tradeoffs (Townsend & Ashby, Citation1983). Figure S4 displays error rate, mean response latency, and mean efficiency score for Davida and for each control participant for the congruent and incongruent trials.
Fig. S4. Davida and control participants’ (C1 – C14) accuracy (left), mean response latency (center) and inverse efficiency score (right) in the stimulus-response compatibility task for congruent and incongruent items. Individual data are aligned on the horizontal axis in ascending order as a function of the size of the advantage in speed, accuracy and efficiency for congruent trials.
We first computed paired-sample t-tests to test for an effect of congruency of the stimuli over control participants’ accuracy, RLs and efficiency score. The results of these analyses indicated the typical advantage for congruent over incongruent items in the three variables (accuracy: t(13) = 6.6, p < 0.001; response latency: t(13) = 3.9, p < 0.001; efficiency: t(13) = 7.3, p < 0.001). This typical finding indicates that control participants have an automatic tendency to be influenced by the orientation of the arrow displayed below the stimulus of interest even though the arrow is irrelevant to the actual task (Simon, 1969). To test whether Davida was also implicitly influenced by the orientation of the arrow, we first conducted an independent sample t-test analysis over Davida’s RLs for congruent and incongruent items. This analysis revealed no effect of congruency (t (108) = 0.28, p = 0.78). Finally, we computed unilateral Revised Standardized Difference Test (Crawford & Garthwaite, Citation2005) over each dependent variable (error rate, response latency, and efficiency score) in order to test whether the discrepancy in Davida’s performance between the congruent and incongruent items was significantly smaller than the discrepancy between both sets in control participants. The results of these analyses revealed that the discrepancy in Davida’s performance between the congruent and incongruent items was almost significantly smaller than that found in control participants when response latency [t (13) = 1.42, p = .09] was considered and significantly smaller when the accuracy [t (13) = .2.99, p < .01] and the efficiency score [t (13) = 1.78, p < .05] were considered as the dependent variable.
1.12. The Ponzo illusion
In this task, participants were presented with the classic Ponzo illusion display, consisting of two internal horizontal lines and two external converging oblique lines (Figure S5). The oblique lines measured 566 pixels and were tilted 10 degrees from the vertical, the upper horizontal line (at the converging end of the display) was 152 pixels (± 2.5 degrees of visual angle) and the lower one (at the diverging end of the display) was of an initially random size composed of between 100 and 190 pixels (± 1.6 and 3.2 degrees of visual angle). The two internal horizontal lines were separated by 600 pixels (10 degrees of visual angle). In each trial, the Ponzo display appeared at the center of the screen and participants had to use the computer’s keyboard to adjust the length of the lower horizontal line (by steps of 2 pixels) to match the length of the upper one and to press the space bar when the two lines appeared identical in length. Participants performed a total of 20 trials. We calculated each participant’s average difference between the lengths of the two horizontal lines. The 14 control participants significantly underestimated the length of the lower horizontal line (t (13) = 11.5, p < 0.001), drawing it on average 20.35 pixels (±0.33 degrees of visual angle) longer than the upper line. This reflects the typical effect of the induced linear perspective in size perception (the Ponzo illusion). Davida, however, did not show the typical visual illusion (Mean difference = +3.5 pixels, SD = 20.8, t (19) = 0.72, p = 0.48) and was significantly better than the controls at matching the length of the two lines (modified t test(Crawford & Howell, 1998): t (13) = -2.45, p = 0.01; 59). See also Figure 2L.
Fig. S5. The Ponzo illusion display. B. Davida (in red) and control participants’ (in black) average difference between the length of the two horizontal lines in the Ponzo illusion task (in pixels). Individual data are aligned on the horizontal axis in ascending order as a function of the size of the absolute difference between the length of the two lines.
1.13. The vertical-horizontal illusion
In this task, participants were shown the classic Vertical-Horizontal illusion display, consisting of (1) a black vertical line 10 pixel thick and 604 pixels long centered 500 pixels to the left of the center of the screen and of (2) a black horizontal line 10 pixel thick, between 575 and 620 pixels long at the beginning of each trial and centered at the center of the screen (Figure S6A). In each trial, the display appeared, and participants had to use the computer’s keyboard to adjust the length of the lower horizontal line (by steps of 2 pixels) to match the length of the vertical one and to press the space bar when the two lines appeared identical in length. Control participants performed 20 trials and Davida performed the same experiment twice for a total of 40 trials. We calculated each participant’s average horizontal line’s length. On average, the control participants significantly underestimated the length of the horizontal line (t (13) = 2.89, p = 0.012), drawing it 19.2 pixels (± 0.3 degrees of visual angle) longer than the vertical line. Davida, however, did not show the typical visual illusion (Mean difference = -1.45 pixels; t (39) = 0.13) and was among the two best participants at matching the length of the two lines (see Figure S6).
Fig. S6. A. The Vertical-Horizontal illusion display. B. Average length of the horizontal line in Davida (in red) the control participants (Cs, in black) and the average of the control participants (C mean, in grey). C. Absolute value of the length difference between the horizontal and vertical line in Davida (in red), the control participants (Cs, in black) and the average of the control participants (C mean, in grey).
1.14. Line drawing naming task with progressive unmasking
Davida was shown 20 line-drawings of familiar objects, from the Snodgrass and Vanderwart (60) set displayed on a white background (± 3.3 x 4.6 degrees of visual angle), either in their canonical orientation (10 stimuli: camel, car, coach, cow, elephant, fish, iron, mouse, boat, truck) or rotated 180 degrees (10 stimuli: dresser, flag, fox, frog, cooking pan, gun, hat, horse, lion, monkey). During the experiment, she sat in front of a computer screen located at a distance of about 60 cm, and each trial began with the presentation of a fixation cross for 1000 msec, followed by a stimulus displayed during two frames (32 msec). The presentation of the stimulus was always followed by a blank screen. She was asked to either name the object if she recognized it, or to increase the presentation duration by one frame (+16 msec) by clicking on the space bar. She was invited to repeat this procedure until the presentation duration was long enough for the object to be recognized. There was no time constraint for responding. In line with her report of perceiving 2D stimuli randomly alternating between different orientations through piece-meal gradual transitions, Davida could not recognize any object at the shortest presentation time. Instead, she increased the duration of the stimuli on average 39.05 times (624 msec) before providing a response (which was then always correct). For instance, she required a presentation duration of 656 ms to recognize the camel, the car, or the fish and a presentation time of 752 ms to recognize the boat. Interestingly, there was no difference between the stimuli displayed in their canonical orientation (606 msec) and those displayed rotated 180 degrees (643 msec). These presentation times were abnormally long: two control participants (two woman, aged 28 and 61) had no difficulty to recognize all the objects shown for 32 ms. Importantly, when Davida was tested with pictures, as opposed to line drawings, of similarly familiar real objects in the same experimental design, she recognized all but one object at the first level of exposure duration (32 ms) and the remaining one (an ostrich) at the seventh level (112 ms).
2. Additional information about the set of results §2
2.1. Assessment of shape perception
In each trial of a shape discrimination task, participants were shown three shapes of different colors (black, red, green). The reference black shape and one of the probes (red or green, randomly) had the exact same shape (they had edges of 6, 6.1, 1 and 2 degrees of visual angle, see Figure S7), whereas the other probe (the target) had a slightly longer edge. In each trial, any of the four edges of the target could be slightly longer. Participants were asked to report verbally which of the green or red figures had a slightly different shape than the black one at the center. We used a staircase method to measure the threshold magnitude of size difference between the edges required for Davida to correctly discriminate the shapes. The experiment started with a large (+3 degrees of visual angle) difference in edge size, after which the difference decreased every three successive correct responses and increased after any incorrect response (step sizes of 8, 4, 4, 2, 2, 1, 1 db). The session was terminated after 10 reversals. Shape difference sensitivity was defined as the average threshold of the 6 last reversals. Davida had a sensitivity threshold of 0.052 degree of visual angle, that is, she correctly discriminated the shape 80% of the time when one had an edge 0.052 degree of visual angle longer than the comparison one (see, for instance, Figure S7). This performance was comparable to that of the control participants (Mean: 0.13; SD: 0.08; modified t-test(Crawford & Howell, 1998): t (13) = -0.87, p = 0.4; 59).
Fig. S7. Shape discrimination task. In this example, the red shape’s left edge is slightly longer than that of the two other shapes. The magnitude of this difference (0.052 degree) corresponds to Davida’s sensitivity threshold.
2.2. Assessment of size perception
Line bisection task
Davida was shown 69 lines of different lengths (± 5.5, 9.1 or 12.8 degree of visual angle) and orientations (0, 45 or 90 degrees) displayed one by one randomly placed at various locations on the screen and was asked to use the computer mouse cursor to click on the middle of each line. Davida reported seeing all lines in two alternating orientations 90 degrees off one another and clicked at the point where the two lines crossed. Davida clicked on average at an absolute distance of 9 pixels (SD: 7.34) off from the center of the lines (0.15 degree of visual angle) with a tendency to click very slightly above (1.6 pixels ± 8 SD) and to the right (4.2 pixels ± 7 SD) of the center. This performance was not different from that of the controls in both absolute distance (mean distance: 8.35 pixels; SD: 2.81; range: 0.014 – 0.262; modified t-test(Crawford & Howell, 1998): t (13) = 0.23, p = 0.82) and bias (Mean: 0.3 ± 3.5 SD pixels below and 1.5 ± 2.8 SD pixels to the left of the center; both modified t-tests (Crawford & Howell, Citation1998): ts (13) < 1.97, p > 0.05).
Size comparison task
In each trial of this experiment, two circles were displayed simultaneously on the computer screen for as long as needed, and Davida had to report verbally which one (the green or the red) was smaller. In each trial, one circle (the green or the red, randomly) had a diameter of 1 degree of visual angle and the other one was slightly larger. We used a staircase method to measure the threshold magnitude of size difference required for Davida to identify the smaller circle correctly. The experiment began with a large size difference of +3 degrees of visual angle, after which, the size difference decreased following three successive correct responses or increased after a single incorrect response (step sizes of 8, 4, 4, 2, 2, 1, 1 db). The session was terminated after 10 reversals. Davida’s sensitivity to size differences was defined as the average threshold of the 6 last reversals. Davida had a sensitivity threshold of 0.015 degree of visual angle, that is, she correctly indicated the smaller circle 80% of the time when the foil had diameter of 1.015 degree of visual angle. This performance was equivalent to the performance of the control participants (mean: 0.021; SD: 0.009; modified t-test (Crawford & Howell, Citation1998): t (13) = -0.61, p = 0.55).
2.3. Assessment of distance perception
In each trial of this experiment Davida was shown three circles, one green, one red, a third black, aligned in the horizontal plane (each circle had a diameter of 1 degree of visual angle) and had to report verbally which of the two colored circles (green or red) was closer to the black circle (the reference), which was placed between the two targets. In each trial one of the colored probes was placed at a distance of 5 degree of visual angle and the other one slightly farther away. We used a staircase method to measure the threshold magnitude of distance difference required for Davida to correctly identify the circle that was closer to the reference circle. The experiment began with a large size difference of +3 degrees of visual angle, after which the size difference decreased after every three successive correct responses and increased after even one incorrect response (step sizes of 8, 4, 4, 2, 2, 1, 1 db). The session was terminated after 10 reversals. Davida’s sensitivity to distance difference was defined as the average threshold of the 6 last reversals. She had a sensitivity threshold of 0.17 degree of visual angle, that is, she correctly indicated which circle was the closer 80% of the time when the foil was at a distance of 5.17 degree of visual angle. This performance was similar to that of control participants (mean: 0.14; SD: 0.067; modified t-test (Crawford & Howell, Citation1998): t (13) = 0.36, p = 0.73).
2.4. Assessment of location perception
On a first pointing task, Davida saw series of small black circles, each having a diameter of 0.69 degrees of visual angle (6mm, 40 pixels) appearing one at a time for 1 second at one of 15 possible locations on the screen. The 15 locations constituted a grid made of 5 columns and 3 rows covering the entire screen. After a circle disappeared, Davida heard a brief tone and was asked to use the computer mouse to click on the screen where the circle had appeared. There were three trials per location. She clicked on average at a distance of 20 pixels from the center of the circle (0.35 degree of visual angle, 3 mm). This performance was similar to that of control participants. (mean distance: 20.8 pixels; SD: 7; modified t-test: t (13) = -0.12, p = 0.91).
In a second pointing task, the procedure was the same, except that Davida was asked to fixate on a dot at the center of the screen until the to-be-localized circle appeared for 48 milliseconds (3 frames; 60Hz). She located the circle within an average distance of 54 pixels from its center (0.94 degrees of visual angle, 8.1 mm).
2.5. Assessment of line tilt perception
Davida was presented with a series of three lines (each 10 degrees of visual angle long, 0.25 degrees of visual angle thick, centered 5 degrees of visual angle apart on the horizontal plane). In each trial, the central black reference line and one probe line (green or red) were vertically oriented and the third probe was slightly rotated away from the vertical. Davida’s task was to decide which of the two probe lines (the red or the green) was perfectly aligned with the central reference line. We used a staircase method to measure the threshold magnitude of orientation difference required for Davida to correctly identify the misoriented line. The experiment started with a large size difference of +10 degrees, after which the size difference decreased after every three successive correct responses and increased after any incorrect response (step sizes of 8, 4, 4, 2, 2, 1, 1 db). The session was terminated after 10 reversals. Davida’s orientation difference sensitivity was defined as the average threshold of the 6 last reversals. She had a sensitivity threshold of 0.88 degrees, that is, she correctly indicated which line was differently oriented 80% of the time when the foil was tilted 0.88 degrees from the vertical. This performance was similar to that of the control participants (mean: 0.58; SD: 0.27; modified t-test(Crawford & Howell, 1998): t (13) = 1.06, p = 0.3).
2.6. Assessment of movement perception
Point-light walker
Davida saw one of two possible point-light walker animations (one facing to the left and one facing to the right) made of 14 dots placed on the main joints, and she was asked to judge in which direction the point-light walkers were facing. She performed this task flawlessly and easily (10/10).
Motion coherence
Davida was presented with a series of circular random dot kinematograms (RDKs) composed of black dots displayed on a uniform white background. The field size of the RDKs was 10° in diameter, dot size was 30 pixels, dot density was 100 dots/frame and dot velocity was 0.6°/s. A proportion of dots moved coherently toward the top, bottom, left or right of the screen and the remaining noise dots moved in random directions. On each trial, the RDK was shown for 1 s, and Davida was asked to tell the direction of coherent motion. We used a staircase method to measure the threshold proportion of signal dots required to correctly discriminate the direction of coherent motion. The session began with an RDK composed of 90% signal dots. Then, the signal to noise proportion was decreased after three successive correct responses and increased after one incorrect response (step sizes of 8, 4, 4, 2, 2, 1, 1 db). The session was terminated after 10 reversals. Coherence sensitivity was defined as the coherence threshold of the 6 last reversals. Davida had a coherence threshold of 15%. This performance was equivalent to that of the control participants (mean: 22.6; SD: 7.6; modified t-test (Crawford & Howell, Citation1998): t (13) = -0.96, p = 0.36).
2.7. Assessment of auditory processing of orientation
Davida was exposed to one of three different pure tones (24, 250 or 337 Hz) lasting 1.9 seconds to either the right or left ear at a comfortable intensity and had to report whether the sound had been presented to her right or left ear. The task contained 30 trials (2 ears x 3 sounds x 6 repetitions). She scored 30/30.
2.8. Assessment of tactile processing of orientation
(a) Laterality judgment task
Davida was asked to position her two hands on a table in front of her, close her eyes, and report which hand had been gently touched by the experimenter with a pen. She was asked to respond by lifting the touched hand. She scored 20/20.
(b) Stereognosis
On the first task Davida was asked to close her eyes, explore a real 3D wooden arrow positioned in front of her with her two hands and decide in which direction the arrow was pointing (left, right, up or down). She was asked to respond verbally. She scored 20/20.
On the second task, Davida was asked to close her eyes, explore a real 3D wooden letter positioned in front of her with her two hands and decide whether the letter was oriented so that it constituted a “b”, “d”, “p” or a “q”. She was asked to respond verbally. She scored 20/20.
(c) Tactile integration
Davida was blindfolded, asked to place her left hand comfortably on a table in front of her and decide which of four possible letters (b, d, p, q) was traced on the dorsal surface of her hand (see Movie S8 online). She scored 20/20.
(d) Transcoding
On the first task, Davida was first to place her left hand comfortably on a table in front of her, to close her eyes while one of four possible letters (b, d, p, q) was traced on the back of her hand by the experimenter. Then, she was asked to open her eyes and draw the letter on a sheet of paper placed in front of her. There were 20 trials and she performed the task perfectly (20/20) and without hesitation.
On the second task, Davida was asked to place her left hand comfortably on a table in front of her and to close her eyes while an arrow was traced on the back of her hand by the experimenter in one of four possible orientations (left, right, toward and away from her body). Then, she was asked to open her eyes and draw the arrow on a sheet of paper placed in front of her. There were 20 trials and she performed the task perfectly (20/20) without hesitation.
2.9. Writing from memory
Davida was asked to write on dictation a series of 15 letters and 15 words. She made only one error, consisting of reversing the two last letters in the word “table” (“tabel”). Interestingly, as one can see in Figure S8, she used a personal font in which orientation-sensitive letters are attributed different shapes. She reported having developed this strategy to be able to read her own writing.
Fig. S8. Davida writes letters (‘b’, ‘d’, ‘p’, ‘q’, ‘a’, ‘h’, ‘n’, ‘m’, ‘r’, ‘t’, ‘w’, ‘s’, ‘e’, ‘u’, ‘k’) and short words (‘mug’, ‘war’, ‘dog’, ‘car’, ‘table’, ‘cat’, ‘pen’, ‘bed’, ‘cup’, ‘map’, ‘dad’, ‘net’, ‘red’, ‘job’, ‘mud’) on dictation. She uses different shapes to discriminate orientation sensitive letters (e.g., ‘b’, ‘d’, ‘p’, ‘q’).
3. Additional information about the set of results §3
3.1. Arrow orientation naming in various locations mono and binocularly
Davida was shown black arrows on white background and asked to decide whether the arrow pointed “up”, “down”, “left” or “right”. Stimuli were ± 1.5 x 3 degrees of visual angle and displayed at one of five different locations: at the center, upper left corner, upper right corner, lower left corner or lower right corner of the computer screen. The locations near the corner of the screen were at horizontal and vertical distance of 10 degrees of visual angle from the center position. The total number of different stimuli was of 20 arrows (5 positions × 4 orientations). During the experiment Davida was asked to fixate a cross located at the center of the screen, stimuli appeared 100 milliseconds and Davida was asked to respond verbally (“left”, “right”, “up”, “down”). The next trial was launched by the experimenter. She performed 5 blocks of 20 trials with both eyes, then with only the left eye, then with only the right eye. As shown on , Davida made only a few correct responses and her response profile was not affected by the location of the stimulus or the eye(s) used to solve the task.
Table S3. Davida’s number of correct responses (/20) in the arrow orientation naming task according to the location of the stimulus and eye(s) used.
3.2. Localizing the tip of an arrow by pointing with short exposure duration, masking and various locations
In this task, a small (± 4 x 8 degrees of visual angle) black arrow was displayed at one of five different locations: at the center of the screen or at ± 4 degrees of visual angle above, below, on the left or on the right of the center. The arrow appearing at the center could be pointing left, right, up or down. The arrow appearing above or below the center could be pointing up or down. The arrow appearing on the left or the right of the center could be pointing left or right (see Figure S9). On each trial, a fixation cross appeared for 1 second at the center of the screen followed by the arrow for 80 msec and a visual mask (Figure S9A). Davida was asked to fixate the fixation cross and, then, to use the computer mouse to move a small round cursor and click as precisely as possible on the place where the tip of the arrow had appeared. The next trial was launched by the experimenter. There was a total of 40 trials in which the arrow was centered on the fixation cross and 20 trials for each other position (10 trial by orientation). As shown in Figure S9B, Davida almost systematically mislocated the position of the tip to approximately the place it would have been if the arrow were rotated by 90 degrees, 180 degrees, or 270 degrees with respect to its own center.
Fig. S9. A. Illustration of the procedure. B. Each red dot represents the coordinates of one of Davida’s attempt at localizing the tip of an arrow. Arrows appear in grey here for transparency, they were displayed in black during the experiment.
3.3. Copying two shapes presented simultaneously
Davida was shown 6 different series of 2 unconnected shapes (an arrow and a rectangle) and asked to copy them as accurately as possible on a separate sheet of paper while the stimulus remained in view. These shapes were copied 4 or 5 times. As shown in Figure S10, the two shapes were copied as if they were rotated or inverted independently from each other.
Fig. S10. Davida’s multiple attempts at copying of 2 unconnected shapes (displayed on the computer screen).
3.4. Copying two briefly displayed arrows
In this task, two small black arrows were displayed simultaneously (± 4 x 8 degrees of visual angle each) for 32 ms at ± 8 degrees of visual angle left and right of center of the screen. Davida was asked to look carefully and, then, to draw what she has seen on a separate sheet of paper. Each arrow was displayed 5 times in 4 possible orientations (left, right, up, down). Davida copied only 3/40 arrows accurately. All her errors consisted in rotating the arrows by 90, 180 or 270 degrees. Of particular interest in this task was whether Davida made the same or different orientation errors for the two arrows. The two arrows were drawn as if their perception resulted from the same orientation error in 6/20 trials and from different errors in 14/20 trials.
3.5. Judging whether briefly displayed arrows are in the “same or different” orientation
In this task, two small black arrows (± 4 x 8 degrees of visual angle each) were displayed for 32 ms at ± 8 degrees of visual angle left and right of center of the screen. Davida was asked to look carefully at them and to decide whether the two arrows had the same direction or not. There were 80 trials. Among these, there was the same proportion of trials in which the arrows differed by 0, 90, 180 and 270 degrees. Davida scored 28/80. She failed to recognize that the two arrows were in the same orientation in 80% of the trials (16/20) and failed to recognize that the two arrows were in a different orientation in 60% of the trials (36/60).
3.6. Object naming task below an arrow
This experiment comprised two sessions. In a first session, Davida was asked to name verbally as fast as possible 80 line-drawings of objects from the Snodgrass and Vanderwart (60) set displayed on white background. The line-drawings had a size of 200 x 280 pixels (± 3.3 x 4.6 degrees of visual angle). In each trial, a fixation point was presented at the center of the screen for 200 ms; then the screen was cleared for 500 ms and the stimulus was displayed until a voice key was triggered. The next trial began after an interval of 2000 ms. Malfunctioning of the voice key and Davida’s responses were registered on-line by the experimenter. In a second session, Davida performed a similar task with two differences: (1) she was presented only with the objects for which a valid response time had been collected during the first session (N=74; 4 errors, 2 voice key malfunctioning) and (2) these objects were separated in two sets (N = 37) matched in average naming latency collected during the first session (t (72) < 1) and were displayed either ± 200 pixels below a large black arrow (700 pixels long, maximal width of 370 pixels, see Figure S11a) or ± 200 pixels below three large black squares of same length and maximal width (see Figure S11b).
To explore a possible interference from the arrow on naming the objects displayed below it, we carried out a by-item analysis of variance over the response latencies of Davida for each item with item as the random factor, Session (session 1 vs session 2) as a within-item factor and Set of item (squares vs. arrow) as between-item factor. This analysis was performed on all but one item for which Davida made an error during the second session (in the squares condition). The results are displayed in Figure S11. The analysis disclosed no significant effect of the set of items [F (1, 71) = 1.42, p = 0.24] but a significant effect of the session [F (1, 71) = 16.7, p < 0.001] and a significant Set of items x Session interaction [F (1, 71) = 41.08, p < 0.001]. Independent samples t-tests performed to explore the interaction indicated a slight advantage of the second session for the set of items named in the squares condition (-104 msec; t (35) = 1.18, p = 0.24) but a large and significant disadvantage of the second session for the items in the arrow condition (+474 msec; t (36) = -20.72, p < 0.001).
Fig. S11. (A and B) Example of the arrow (A) and squares (B) conditions in which the objects were named in the second session. (C) Davida’s mean response latency and standard deviation for the two sets of items after the first and second session. * indicates a statistically significant difference at p < 0.001.
3.7. Counting tasks
In this series of task, Davida saw one, two or three black dots displayed alone, together with a large black circle, or with a large black arrow (e.g., Figure S12b-d). Thus, there were 9 different possible configurations (3 numbers of dots x 3 conditions). The dots had a diameter of 12 pixels and, in the default configuration, could be displayed at one of three positions: 140 pixels on the left of the center of the screen, 115 pixels above the center of the screen or 115 pixels below the center of the screen. The large black circle had a diameter of 188 pixels and, in the default configuration, was centered at the center of the screen. The arrow a length of 380 pixels, a maximal width of 220 pixels and, in the default configuration, was centered 70 pixels on the right of the center of the screen. During the experiment, Davida saw the default configuration and the equivalents of its rotation by 90, 180 and 270 degrees. Thus, there were 36 different stimuli (3 numbers of dots x 3 conditions x 4 orientations). In each trial, Davida had to count and then report verbally the number of small dots that she had seen. In three experiments, the stimuli were displayed for 500 msec, 1000 msec or for an unlimited time, respectively. Each experiment comprised 72 trials (each stimulus was seen twice). We counted the number of correct responses by condition. As can be seen in Figure S12a, in the three experiments Davida was able to correctly report the number of dots when the dots were displayed alone (Figure S12b) and when they were shown the large black circle (Figure S12c), but not when they were presented with the black arrow (Figure S12d). All her errors consisted in underestimating the number of dots that had been displayed in this condition.
Three additional counting experiments were performed to explore the specificity of this effect. In one experiment, Davida was presented for 1 second with a large black arrow surrounded by one, two or three black dots positioned either exactly as in the previous experiments (Figure S12d) or slightly above and below where the tip of the arrow would be if it were inverted or rotated by 90 or 270 degrees clockwise (Figure S12e). In a second experiment, Davida was presented for 1 second with a large black arrow surrounded by one, two or three black dots positioned either exactly as in the previous experiments (Figure S12d) or placed where the tip of the arrow would be if rotated by 45, 135 or 315 degrees (see Figure S12f). In a third experiment, Davida saw one, two or three black dots positioned either exactly as in the previous experiments displayed with either the same large black arrow (Figure S12d) or a “transparent” arrow of the same size and shape defined only by its contour (Figure S12g). In all experiments, Davida performed 96 trials (3 numbers of dots x 2 conditions x 4 orientations x 4 trials). We counted the number of correct responses by condition. As can be seen in Figure S12, in the three experiments Davida was unable to correctly report the number of dots when the dots were displayed with the black arrow in locations that the arrow would cover if it were seen as rotated or inverted but performed the task significantly better in the other conditions.
Fig. S12. Davida’s percentage of correct responses in the six counting experiments for the different conditions (related by a color code).
4. Additional information about the set of results §4
4.1. Copying a tilted asymmetrical shape
Davida was randomly presented with one of two asymmetrical shapes (see Figure S13) in one of 16 possible orientations (15, 30, 60, 75, 105, 120, 150, 165, 195, 210, 240, 255, 285, 300, 330 and 345 degrees) and was asked to copy it as precisely as possible on a separate sheet of paper. These shapes were ± 7 x 3 degrees of visual angle and drawn in black ink on white background. Davida was asked to copy a total of 296 shapes across six separate sessions. (in two of these sessions these stimuli were intermixed with stimuli displayed in lower contrast or blurred but Davida’s results for this type of stimuli will not be reported here). The Movie S9, online, is a recording of Davida performing this task and illustrate her response profile. Davida copied 13/296 stimuli accurately (4.4 %) and made the 7 types of errors displayed in Figure S13 on the other trials.
Fig. S13. A, B. Examples of the two stimuli used in Experiment 4.1 (shown here tilted 330 degrees), an illustration of the 8 types of responses given by Davida for these types of stimuli, and their corresponding percentage. See Figure 7, in the main text, for more detail on these errors.
4.2. Copying another tilted asymmetrical shape
Davida was randomly shown one of two asymmetrical shapes, the long axis of which was tilted 15 degrees from the vertical or horizontal (see Figure S14) in one of 8 possible orientation (15, 75, 105, 165, 195, 255, 285, and 345 degrees) and was asked to copy it as precisely as possible on a separate sheet of paper. These shapes were ± 7 x .05 degrees of visual angle and drawn in black ink on white background. Davida was asked to copy a total of 64 shapes. The Movie S10, online, is a recording of Davida performing this task and illustrate her response profile. Davida copied 1/64 stimulus accurately (1.6 %) and made the 7 types of errors displayed in Figure S14 on the other trials.
Fig. S14. A, B. Examples of the two stimuli used in Experiment 4.2 (shown here tilted 345 degrees), an illustration of the 8 types of responses given by Davida for these types of stimuli, and their corresponding percentage. See Figure 7, in the main text, for more detail on these errors.
4.3. Drawing all that she sees
Davida was randomly presented with one of two asymmetrical shapes (Figure S15) tilted 30 degrees from the vertical or horizontal in one of 8 possible orientations (30, 60, 120, 150, 210, 240, 300, and 330 degrees) for 2 seconds and asked, after each presentation, to draw “all she saw”. These shapes were ± 7 x 3 degrees of visual angle and drawn in black ink on white background. There was one trial by condition (2 shapes, 8 orientations). The Movie S11 illustrates Davida drawing the different orientations that she perceived when shown a similar stimulus. Davida drew each shape in 6.06 different orientations on average, including the correct orientation 81.25 % of the time (13/16) and 7 errors types displayed in Figure S15 on the other trials in various proportions but made no other error.
Fig. S15. A, B. Examples of the two stimuli used in Experiment 4.3 (shown here tilted 330 degrees), an illustration of the 8 types of responses given by Davida for these types of stimuli, and the corresponding percentage of trials in which this orientation was drawn. See Figure 7, in the main text, for more detail on these errors.
4.4. Tracing a tilted asymmetrical shape
Davida was randomly shown one of two asymmetrical shape (Figure S16) tilted 15 degrees from the vertical or horizontal in one of 8 possible orientations (15, 75, 105, 165, 195, 255, 285, 345 degrees) on a sheet of paper and asked to trace the shape with ink. The Movie S12, online, is a recording of Davida performing this task and illustrate her response profile. On a total of 80 trials, Davida traced the displayed shape only 2.5% of the time (2/80 trials). On the other trials, she inked the sheet of paper as if the shape was transformed by one of the 7 error types displayed on the Figure S16. She made no other type of error.
Fig. S16. A, B. Examples of the two stimuli used in Experiment 4.4 (shown here tilted 345 degrees), an illustration of the 8 types of responses given by Davida for these types of stimuli (in red ink), and the percentage of trials corresponding to the different types of responses.
5. Additional information about the set of results §5
5.1. Copying words with connected or unconnected letters
Davida was shown 6 words composed of connected letters (Lucida Handwriting font, size 72) and 6 words composed of unconnected letters (Calibri font, size 72) and asked to copy them as accurately as possible on a separate sheet of paper while the stimulus remained in view. As can be seen in Figure S17, she misrepresented the orientation of the letters when the letters were unconnected but also of the whole word when the letters were connected.
Fig. S17. Davida’s copy of words with attached (top) and non-attached (bottom) letters.
5.2. Pointing to the tip of an arrow
A long thin arrow (±6 x 0.5 degrees of visual angle) pointing left, right, up or down was displayed at the center of the computer screen for an unlimited duration (Figure S18). In half of the trials (N = 40), the arrow was fully depicted (Figure S18A). In the other half, the center of the arrow was hidden behind a mask (5 pixels) that had the same color as the background (Figures S18B). In each trial, Davida was asked to use the computer mouse to move a small round cursor and click as precisely as possible on the tip of the arrow. In the condition in which the arrow was fully depicted, Davida located the position of the tip of the arrow accurately (i.e., she clicked at less than 50 pixels from the accurate position of the tip) in 2 trials (5%) and mislocated the position of the tip to approximately (i.e., less than 50 pixels) where it would have been if the arrow had been rotated by 90 degrees (30%), 180 degrees (7.5%) or 270 degrees (57.5%). In the other condition, Davida located the position of the tip of the arrow accurately (i.e., less than 50 pixels) in 1 trial (2.5%) and mislocated the position of the tip to approximately (i.e., less than 50 pixels) where it would have been if only the part of the arrow connected to the tip had been rotated by 90 degrees (32.5%), 180 degrees (10%) or 270 degrees (55%). The Movie S13, online, is a recording of Davida performing this task and illustrate her response profile.
Fig. S18. A, B. Stimuli used in Experiment 5.2. The dashed lines illustrate the area of the screen selected for the zoom (C) on the arrow composed of two unconnected parts, it was not displayed during the experiment.
5.3. Counting tasks
In each of the 48 trials of a first task, Davida was presented for 500 ms with a display composed of one, two or three black dots located above a white large square outlined in black ink (Figure S19A-C) or above the same square and a rectangle filled in black ink that would overlap with the position of all the black dots if it were rotated by 90 degrees (Figure S19D-F). Davida was asked to name the number of small dots. In each of the 48 trials of a second task, Davida was presented for 500 ms with a display composed of one, two or three black dots displayed within a circle (Figure S19 G-I) or within a circle and a large black rectangle that would overlap with the position of all the black dots if it were rotated by 90 degrees (Figure S19J-L). She was asked to name the number of small dots. We counted the number of correct responses by condition in both tasks. In both tasks, Davida was able to correctly report the number of dots when the dots were displayed without the black rectangle (100% RC) but erred in almost all trials in which the display included the black rectangle (25 and 12.5% correct responses in the first and second task). In both tasks, Davida’s errors consisted either in reporting no black dot at all (16/18 errors in the first task and 19/21 errors in the second task) or in underestimating the actual number of dots (2/18 errors in the first task and 2/21 errors in the second task).
Fig. S19. Stimuli used in Experiment 5.3.
5.4. Pointing to the tip of a rectangle connected or not to another one
In each trial of this task Davida saw two red or two black rectangles either separated from each other by three pixels (Figure S20A, B) or connected by a 4-pixels line (Figure S20C, D), oriented toward the left, right, upper or lower side of the screen, and was asked to use the computer mouse to move a small round cursor and click as precisely as possible on the little “indent” at the extremity of one of the rectangles. When the rectangles were separated, Davida pointed either on the correct location of the indent (1/21 trials), or where the indent would have been if only the rectangle comprising the indent was rotated by 90 degrees (23.8%), 180 degrees (14%) or 270 degrees (57%). When the rectangles were connected by the thin line, Davida pointed either on the correct location of the indent (3/21 trials), or where the indent would have been if the whole shape composed of the two connected rectangles was rotated by 180 degrees (86%). The Movie S13, online, is a recording of Davida performing this task and illustrate her response profile. The absence of 90 and 270 degree rotation errors in the latter condition is intriguing given that these errors are frequent with all the other types of stimuli. This particularity remains to be fully understood.
Fig. S20. Stimuli used in Experiment 45.4. The dashed lines illustrate the areas of the screen selected for the zoom; they were not displayed during the experiment.
5.5. Naming the color behind the tip of an arrow
In this task, Davida was presented with each of the stimuli displayed in Figure S21 20 times and had to name the color behind the tip of the arrow. Davida correctly identified the color behind the tip of the arrow in 2/80 trials and made 78/80 errors consisting of responding as if the arrow was rotated by 90 (42.5%), 180 (20%) or 270 (35%) degrees.

Fig. S21. Stimuli used Experiment 5.5
5.6. Pointing to the tip of a bicolor arrow
Colors separated by a sharp edge
In each trial of this experiment, Davida was shown a bicolor arrow and asked to use the computer mouse to move a small round cursor and click as precisely as possible on the tip of the arrow. The arrow was 368 x 35 pixels. The part of the arrow in the same color as the tip was 168 pixels long (e.g., the green part in Figure S22A) and the part in the other color 200 pixels long (e.g., the blue part in Figure S22A). There were 2 presentations of 12 different stimuli composed of different colors (black-blue, black-green, black-red, black-yellow, blue-black, blue-green, blue-red, blue-yellow, red-black, red-green, red-yellow) in 4 different orientations (up, down, left, right) for a total of 96 stimuli. In this task, Davida clicked approximately (i.e. less than 50 pixels away) on the tip of the arrow in 11.4% of the trials, approximately to the place the tip of the arrow would have been if the whole arrow (368 pixels) were rotated by 90, 180 or 270 degrees in 10.4% of the trials, and approximately the place the tip would have been if only the colored part of the arrow of the same color as the tip (168 pixels) had been rotated by 90, 180 or 270 degrees in 78.12% of the trials.
Fig. S22. Example of a stimulus used on Experiment 5.6. The dashed lines illustrate the area of the screen selected for the zoom (right). They were not displayed during the experiment.
Colors blending more or less progressively
In each trial of this experiment, Davida was shown a bicolor arrow (red-green, see Figure S22B and C) and asked to use the computer mouse to move a small round cursor and click as precisely as possible on the tip of the arrow. The arrow was 450 x 25 pixels. The two colors were blended into one another over either a short or large ( (blending of 8 or 60 pixels, see Figure S22B and C). There were 7 presentations of both arrows in 4 different orientations (up, down, left, right) for a total of 56 stimuli. In this task, Davida clicked approximately (i.e. less than 50 pixels away) on the tip of the arrow in 7.1% and 17% of the trials when the blending occurred over a short and large area, respectively. More importantly, she clicked approximately to the place the tip of the arrow would have been if the whole arrow (450 pixels) were rotated by 90, 180 or 270 degrees in 25% of the trials when the blending occurred over a short area but in 82% of the trials when the blending occurred over a large area and approximately the place the tip would have been if only the colored part of the arrow of the same color as the tip had been rotated by 90, 180 or 270 degrees in 67% of the trials when the blending occurred over a short area but never when the blending occurred over a larger area. The Movie S14, online, is a recording of Davida performing this task and illustrate her response profile.
5.7. Clicking on a dot that is touching or not touching an arrow
Davida was shown a black or red dot positioned to the right or left of center of the screen alone (Figure S23, A), near to the tip of an arrow (Figure S23, B), touching the end of an arrowhead (Figure S23, C, D) or included within the arrow (Figure S23, E). In each trial, Davida was asked to use the computer mouse to move a small round cursor and click as precisely as possible on the dot. Each trial appeared 1 second after the response to the previous trial. There was no time constraint, as the emphasis was on accuracy. There were 20 trials per each condition. Davida clicked on the dot accurately in 100% of the trials in the first (A and B) and last (D and E) two conditions, but only 1/20 trials when the dot was black and connected to the tip of the arrow (C). In the latter condition, she clicked approximatively where the dot would have been if the arrow to which it was attached was rotated by 90, 180 or 270 degrees.
Fig. S23. Illustration of the stimuli used in Experiment 5.7.
5.8. Copying stimuli composed of unconnected parts
Davida was shown 20 aligned dots (Figure S24, A), 10 aligned short horizontal lines (Figure S24, B), 20 aligned short lines vertical lines (Figure S24, C) or 10 aligned lines depicted in different orientations (Figure S24, D) and asked to simply copy what she sees. There were 5 trials in each of the four conditions. With the dotted line, Davida copied accurately the position of every dot in 100% of the trials. In the other conditions, Davida typically erred in reproducing the orientation of the local line segments but reproduced accurately the orientation of the global shape in 100% of the trials.
Fig. S24. Stimuli used in Experiment 5.8.
5.9. Judging the orientation of stimuli composed of unconnected dots
Davida was shown arrows implied by a series of unconnected small dots (Figure S25) and asked to name the orientation (left, right, up, down) in which that arrow was pointing. Davida named the correct orientation in 20/20 of the trials.
Fig. S25. Stimuli used in Experiment 5.9.
5.10. Pointing to the tip of an arrow composed of unconnected dots or of connected elements of different colors
In each trial of the first experiment Davida was shown an arrow implied by a series of unconnected small dots within an arrow composed of solid black lines (Figure S26A) and asked to use the computer mouse to move a small round cursor and click as precisely as possible on either the dot placed at the tip of the dotted arrow (16 first trials) or at the tip of the arrow made of solid black lines (16 other trials). The arrows were displayed in four different orientations (left, right, up, down). Davida was perfect in locating the tip of the dotted arrow but erred on 14/16 of the trials when asked to point to the tip of the arrow made of solid black lines. In this condition, she located the tip of the arrow approximately the place it would have been if it were rotated by 90, 180 or 270 degrees in 12.5, 37.5 and 37.5 % of the trials, respectively. The Movie S15, online, is a recording of Davida performing this task and illustrate her response profile.
In each trial of the second experiment, one of three types of a large black arrow (made of connected lines, of small or large unconnected dots, Figure S26 B-D) was displayed at the center of the computer screen pointing right, down, left or up for 200 ms; Davida was asked to use the computer mouse to move a small round cursor and click as precisely as possible on the tip of the arrow. When the arrow was composed of solid black lines (Figure S26B) Davida pointed to the tip of the arrow in 4/20 trials and often mislocated the tip at approximately the place it would have been if the arrow were rotated by 90 degrees (4/20), 180 degrees (10/20) or 270 degrees (4/20). In contrast, Davida made no errors when the arrows were composed of unconnected small or large dots (Figure S26C, D). The Movie S16, online, is a recording of Davida performing this task and illustrate her response profile.
In each trial of the third experiment, one large arrow composed of segments of different colors (Figure S26 E) was displayed at the center of the computer screen pointing right, down, left or up for 200 ms and Davida was asked to use the computer mouse to move a small round cursor and click as precisely as possible on the tip of the arrow. There were 40 trials, in which Davida made no error.
Fig. S26. Stimuli used in Experiment 5.10.
5.11. Grouping by proximity
In a first experiment, Davida was presented five times for 100 ms with each of the 4 displays depicted in Figure S27 and asked to tell what she saw. In a second experiment the stimuli were displayed for only 16 msec. In both experiments, Davida systematically reported seeing vertical lines of dots when shown the stimuli depicted in Figure S27 A and C, and horizontal lines of dots when shown the stimuli depicted in Figure S27 B and D. Thus, Davida perceives accurately the orientation of lines made of unconnected elements, even when this type of stimulus is presented so briefly that it is unlikely that her response follows a conscious reconstruction of the orientation of the stimulus based on an analysis of the position of its parts.
Fig. S27. Stimuli used in Experiment 5.11.
5.12. Copying stimuli composed of connected elements of different colors
In the first experiment, Davida was presented for 200 ms with a line (Figure S28 A) or an arrow (Figure S28 B) composed of segments of different colors and asked to copy the outline of stimuli (the line or the arrow) with black ink on a separate sheet of paper. The line was either vertical or horizontal (six stimuli of each) and the arrow was either oriented to the right, left, up or down (three stimuli of each). In the second experiment, she was shown the same stimuli for only 16 msec. Davida performed these tasks easily and flawlessly. This corroborates the previous finding that the individual segments of different colors are perceived as misoriented but not the whole shape (see Appendix 5.6, 5.10).
Fig. S28. Stimuli used on Experiment 5.12.
5.13. Naming letters composed of unconnected elements or connected elements of different colors
In each of the trials of the first experiment one of four possible orientation-sensitive letters (p, b, d or q) either drawn in black ink (Figure S29 A), composed of connected parts of different colors (Figure S29 B) or composed of small black dots (Figure S29 C) and subtending 166 x 240 pixels was shown at the center of the computer screen. Davida was asked to name the letter, which was displayed for as long as she needed. There were 20 trials by condition. Davida named accurately 2/20 letters drawn in black ink (Figure S29 A) but named easily and flawlessly (20/20) the letters composed of connected parts of different colors (Figure S29 B) and those composed of small black dots (Figure S29 C).
In the second experiment, the same stimuli were displayed for only 16 msec. Davida named accurately 0/20 letters drawn in black ink (Figure S29 A) but named easily and flawlessly the letters composed of connected parts of different colors (Figure S29 B) and those composed of small dots (Figure S29 C).
Fig. S29. Examples of stimuli used in Experiment 5.13.
5.14. Stimulus–response compatibility task with dotted arrows
In each trial the first experiment, a fixation point was presented at the center of the screen for 2 sec, then the screen was cleared for 1 sec, and then a stimulus was displayed until a response was recorded. The stimuli were either a filled circle or a filled square displayed at the center of the computer screen and, below it, an arrow made of unconnected small black dots pointing either toward the left or toward the right (see Figure S30A-D). Thus, there were 4 different stimuli (2 shapes x 2 arrow orientations). Davida was asked to press a button on the keyboard (the “z” key) as fast as possible with her left index finger when she saw a circle and with her right index finger (the “m” key) when she saw a square, while ignoring the arrow. The experiment included 120 stimuli (30 repetition of each stimulus). To test whether Davida was implicitly influenced by the orientation of the arrow, we conducted analyses to compare Davida’s response latencies for trials in which the arrow pointed in the direction of the hand associated with the correct answer (congruent displays) and for trials in which the arrow pointed in the direction of the hand associated with the incorrect answer (incongruent displays). Response accuracy and response latency were analyzed separately. Response latency analyses were carried out over correct responses only. The distribution of Davida’s response latencies was homogeneous; there were no exceedingly fast (i.e., faster than 200 ms) or slow (slower than 1000 ms) responses. Davida was slightly less accurate for incongruent than congruent trials (95% and 98%), and an independent sample t-test carried out on Davida’s reaction latencies (RL) revealed that she was significantly faster on congruent (Mean = 521 ms; SD = 10.8 ms) than incongruent trials (Mean = 571 ms; SD = 11.9 ms) (tuni(114) = 2.33, p = 0.01).
In the second experiment, Davida was presented 15 times with each of the 8 displays depicted in Figure S30 A-H (randomly), and her task was the same as in the previous experiment. The aim was to replicate the results of the first experiment and of a previous stimulus–response compatibility experiment with solid arrows (see supplemental material and methods 1.11) with items belonging to the two experimental conditions randomly mixed during the same experimental session. The analyses were as reported before. Davida was equally accurate for the incongruent and the congruent trials in both conditions (full arrow: 100%; dotted arrow: 96.7%). Latency analyses were conducted on the correct responses after responses faster than 200 ms (0%) and slower than 1000 ms (1 congruent and 1 incongruent trial for the solid arrow condition; 1 congruent and 2 incongruent trials in the dotted arrow condition) were excluded (Hommel, 1993). The results of two independent sample t-tests carried out over Davida’s RLs showed that she was significantly faster to respond to congruent (Mean = 517 ms; SD = 10 ms) than incongruent trials (Mean = 573 ms; SD = 10.1 ms) (tuni(53) = 2.05, p = 0.02) for the dotted arrows, but not for the solid arrows (Congruent: Mean = 525 ms; SD = 9.1 ms; Incongruent: Mean = 557 ms; SD = 14 ms; tuni(56) = 1.02).
Fig. S30. Stimuli used in Experiment 5.14. Stimuli were categorized as congruent (B, C, F, G) when the arrow points in the direction of the hand associated to the correct answer (left for a circle, right for a square) and incongruent (A, D, E, H) when the arrow points in the direction opposite to the hand associated to the correct answer (right for a circle, left for a square).
6. Additional information about the set of results §6
6.1. Naming the orientation of arrows displayed on an isoluminant background
Davida was shown 24 arrows pointing up, down, left or right and asked to indicate the orientation of these arrows by naming it (right, left, up, down). Stimuli were displayed one at the time, at the center of the screen, as long as needed by Davida, and consisted in large (8 x 3.5 degrees of visual angle), blue, red or green, arrows on an isoluminant (20 cd/m2, measured by a Konica Minolta LS-100) background of a different color (blue, red or green). Davida named the orientation of 1/24 stimuli accurately. Her errors consisted in responding as if the arrow were rotated by 90 (6/24), 180 (9/24) or 270 (8/24) degrees.
6.2. Naming the letters p, b, d and q displayed on an isoluminant background
Davida was presented 6 times with the letters b, d, p and q and was asked to name them. Stimuli were displayed one at the time, at the center of the screen, as long as needed by Davida, and were composed of large (± 3.5 degrees of vertical visual angle) lower-case blue, red or green letters drawn in the Calibri font on an isoluminant (20 cd/m2, measured by a Konica Minolta LS-100) background of a different color (blue, red or green). She almost systematically named the letters as if they were inverted or rotated (see ).
Table S4. Davida’s responses in the isoluminant letters reading task
6.3. Arrow orientation judgment task with various luminance contrast
In a first experiment, Davida was shown arrows pointing up, down, left or right (randomly) and asked to indicate the orientation of these arrows by pressing on the corresponding key on a computer keyboard. These arrows were large (4 degrees of visual angle), of 7 different shades of grey (RGB of 0, 40, 93, 148, 202, 228 or 242; corresponding to 5.8, 9, 35, 88, 170, 221 and 244 cd/m2, measured by a Konica Minolta LS-100) and displayed one at the time, for as long as needed by Davida, at the center of the screen on white background (RGB of 255; 270 cd/m2). Thus, they were 7 levels of luminance contrast (Background/Figure: 46.5, 30, 7.71, 3.07, 1.59, 1.22, 1.11). This experiment was carried out twice: The first session contained 140 stimuli (7 contrasts x 4 orientations x 5 repetitions). The second session was terminated at Davida’s request after 91 stimuli. As a result, Davida responded to 32, 33 or 34 stimuli displayed at each contrast level. As shown in Figure S31 A, Davida’s performance was influenced by the luminance contrast of the stimuli, varying from 0% correct responses at the two highest levels of luminance contrast to 84.3% correct responses at the lowest level.
In a second experiment, Davida was shown arrows pointing up, down, left or right (randomly) and asked to indicate the orientation of these arrows by pressing on the corresponding arrow key on the computer keyboard. These arrows were large (11.5 degrees of visual angle), of 10 different shades of light grey (178, 180, 182, 184, 186, 188, 190, 192, 194 and 196 cd/m2, measured by a Konica Minolta LS-100) and displayed one at the time, as long as needed by Davida, at the center of the screen on a light grey background (198 cd/m2). Thus, there were 10 different levels of luminance contrast (Background/Figure: 1.11, 1.10, 1.09, 1.08. 1.07, 1.06, 1.05, 1.04, 1.03, 1.02, 1.01). This experiment included 200 stimuli: 10 contrasts x 4 orientations x 5 repetition. As shown in Figure S31 B, Davida’s performance was influenced by the luminance contrast of the stimuli, varying from 70% of correct responses at the highest levels of contrast (1.11) to 100% correct responses at the three lowest level (1.03 and lower).
Fig. S31. Davida’s percentage of correct responses in Experiment 6.3 for arrows of different levels of luminance contrast with the background.
6.4. Pointing to the tip of a high or low-contrast arrow
In this task, a large (±10 x 6 degrees of visual angle) arrow pointing left, right, up or down was displayed at the center of the computer screen on white background (RBG 255) for an unlimited duration. In each trial, Davida was asked to use the computer mouse to move a small round cursor and click as precisely as possible on the tip of the arrow. In 50 trials, the arrow was black (RGB 0). In 50 additional trials, the arrow was colored in very light gray (RGB 253). The Movie S17, illustrates Davida’s performance in this task. Davida clicked approximately on the tip of the arrow (less than 50 pixels = 8 mm) in 100% of the trials when the arrow and the background had a low luminance contrast (light grey arrow), but only 2% of the trials when the arrow and the background had a high luminance contrast (black arrow). In the later condition, she almost systematically mislocated the position of the tip to approximately the place it would have been if the arrow were rotated by 90 degrees (34%), 180 degrees (24%) or 270 degrees (40%).
6.5. Reading high and low contrast letters
In two separate sessions, Davida was asked to read 30 times the letters “b”, “p”, “d” and “q” displayed at the center of the computer screen on white background (RBG 255) for an unlimited duration. The letters were displayed in the Calibri font with a size of 166 (+- 3.7 x 2 degrees of visual angle) and were either colored in black (RGB 0), light grey (RGB 250) or very light grey (RGB 253). The Movie S18, illustrates Davida’s performance in this type of experiment. Davida made systematic errors when naming the letters displayed in black (0/40), in light grey (0/40) but read without any error or difficulty the letters displayed in very light grey (40/40).
6.6. Low contrast objects orientation decision task
Davida was shown 40 line-drawings of objects from the Snodgrass and Vanderwart (60) set displayed once in their typical upright orientation and once upside-down. The line drawings were depicted in very light grey on white background to decrease their luminance contrast. Davida was presented with each stimulus one at a time, for as long as needed, and asked to decide whether the object was in its typical or atypical orientation. She performed the task perfectly (100% correct responses).
6.7. Ponzo illusion task with high and low contrast stimuli
In this task, Davida was shown the same Ponzo illusion display and experiment as above (Experiment 1.12) but also, in addition, with 20 additional trials in which the display was shown at a very low luminance contrast with the background. When the display was displayed in black, Davida performed like in the first experiment with the same stimuli: she did not show the typical visual illusion (t (19) = -1.07, p = 0.3), drawing the lower line on average 6.1 pixels shorter (SD = 25.5) than the upper (reference) line, and was significantly better than the controls at matching the length of the two lines (modified t test: t (13) = -2.08, p = 0.05, see Figure S32). However, when the display was shown at very low luminance contrast with the background her performance became similar to that of the control participants: she showed the typical effect of the illusion (t (19) = 1.88, p = 0.07), drawing the drawing the lower line on average 12 pixels longer (SD = 30.4) than the upper (reference) line, and became significantly less accurate at matching the length of the two lines (paired t test (19) = 2.14, p = 0.046).
Fig. S32. Control participants’ (C1 – C14, in black) and Davida’s average difference between the length of the two horizontal lines in the Ponzo illusion task (in pixels) in the high contrast (HC, in red) and low contrast (LC, in green) conditions. Individual data are aligned in ascending order on the horizontal axis as a function of the size of the difference between the length of the two lines (average length of the lower line – length of the upper reference line).
6.8. Copying a tilted asymmetrical shape displayed at 6 levels of luminance contrast
In each trial of this task, Davida was randomly presented with one of two asymmetrical shapes (11.5 x 3.5 of visual angle, see Figure S13 A, B) displayed on white background (RGB 255) tilted from upright toward one of 4 possible orientations (45, 135, 225, 315) and was asked to copy it as precisely as possible on a separate sheet of paper. In a total of 288 trials, the stimuli were displayed 48 times (2 stimuli x 4 orientations x 8 repetitions) at 6 levels of grey (RGB of 0, 218, 230, 240, 245 and 252), resulting in 6 levels of luminance contrast with the white background. As shown in Figure S33, Davida made many errors when the stimuli were displayed with a high level of luminance contrast, but her error rate decreased when the luminance contrast between the shape and the background decreased. The Movie S19, illustrates Davida’s performance in this type of experiment with high and low levels of luminance contrast.
Fig. S33. Davida’s percentage of correct responses for the different conditions of Experiment 6.8.
6.9. Drawing all that she sees from a tilted asymmetrical shape displayed at 5 levels of luminance contrast
In each trial of this task, Davida was randomly presented with one of two asymmetrical shapes (11.5 x 3.5 of visual angle, see Figure S13 A, B) displayed on white background (RGB 255) tilted from upright toward one of 4 possible orientations (45, 135, 225, 315) for 2 seconds and asked, after each presentation, to draw all she saw. In a total of 80 trials, the stimuli were displayed 16 times (2 shapes x 4 orientations x 2 repetitions) at 5 levels of grey (RGB of 0, 230, 240, 245 and 252), resulting in 5 levels of luminance contrast with the white background.
Figure S34 A shows the average number of orientations drawn for each stimulus in all the conditions. As one can see from this figure, Davida perceived numerous different orientations of stimuli displayed with a high level of luminance contrast, but this number decreased when the luminance contrast between the shape and the background decreased and she reported seeing only one orientation of each stimulus shown at the lowest luminance contrast. Figure S34 B shows the percentage of trials in which Davida’s response included the correct orientation of the stimulus. As one can see from this figure, Davida’s response often included the correct orientation at all contrast levels. Nevertheless, the percentage of trials that included the correct response increased with the decrease of the luminance contrast.
Fig. S34. A. Average number of orientations drawn per stimulus in the five levels of luminance contrast. B. Percentage of trials in which Davida’s response included the correct orientation in the five levels of luminance contrast.
6.10. Davida’s perception of shapes from motion
We tested Davida’s perception of arrows and letters in a shape from motion experiments. In these experiments, the shape and the background were composed of white (1/6), black (1/6) and grey (2/3) pixels and the shapes were visible only because the motion (60 pixels/second) of the white and black dots within the shape region were in a different direction (right) from that of their motion on the background (left). In the first experiment Davida saw 20 large arrows in one of four different orientations (left, right, up, down) and had to report verbally their orientation. In the second task, she saw 20 letters displayed one at a time (b, p, d, q) and had to name each of them. Davida was flawless in both tasks.
6.11. Naming the orientation of high and low spatial frequency arrows
Davida was randomly shown arrows pointing up, down, left or right and asked to indicate the orientation of these arrows by pressing on the corresponding arrow key on the computer keyboard. These arrows were large (±10 x 6 degrees of visual angle), of 3 different levels of gaussian blur (0, 50, 80) and displayed one at the time, at the center of the screen on white background for as long as needed (see Figure S35). In total, there were 20 stimuli in each condition (5 of each orientation). Davida’s performance was 0% correct responses at the two lowest levels of blur and 100% of correct responses at the highest level.
Fig. S35. Illustration of high (A), medium (B) and low (C) spatial frequency stimuli used in Experiment 6.11-6.12.
6.12. Pointing to the tip of high and low spatial frequency arrow
In this task, a large (±10 x 6 degrees of visual angle) arrow pointing left, right, up or down was displayed at the center of the computer screen on white background (RBG 255) for an unlimited duration. On each trial, Davida was asked to use the computer mouse to move a small round cursor and click as precisely as possible on the tip of the arrow. In 20 trials, the arrow had a high spatial frequency (See Figure S35 A). In 20 other trials, the arrow was edited with a gaussian blur with a radius of 80 pixels (See Figure S35 C). The Movie S20 illustrates Davida’s performance in this type of experiment. Davida systematically mislocated the position of the tip of the high spatial frequency arrows to approximately the place where it would have been if the arrow were rotated by 90 degrees (40%), 180 degrees (20%) or 270 degrees (40%). When the arrow was blurred, however, she correctly localized the tip of the arrow (less than 50 pixels) in 100% of the trials.
6.13. Reading high and low spatial frequency letters
In this experiment, Davida was asked to read the letters “b”, “p”, “d” and “q” displayed at the center of the computer screen on white background (RBG 255) for an unlimited duration. The letters were displayed in black, in the Calibri font with a size of +- 3.7 x 2 degrees of visual angle (166) and were either not further edited or edited with a gaussian blur of 50 or 80 pixels (See Figure S36). One session comprised 20 trials in each condition (60 stimuli). Davida participated in 2 sessions. She named 2 letters accurately when the letters were displayed in black (2/40), 0 when reading the letter edited with a gaussian blur with a radius of 50 pixels (0/40), but she read all the letters accurately when the letter was edited with a gaussian blur with a radius of 80 pixels (40/40). The Movie S21 illustrates Davida’s performance in this type of experiment.
Fig. S36. Illustration of high (A), medium (B) and low (C) spatial frequency stimuli used in Experiment 6.13.
6.14. Copying a tilted asymmetrical shape displayed at 6 levels of spatial frequency
In each trial of this task, Davida was randomly presented with one of two asymmetrical shapes (11.5 x 3.5 of visual angle, see Figure S13 A, B) displayed on white background (RGB 255) tilted from upright toward one of 4 possible orientations (45, 135, 225, 315) and was asked to copy it as precisely as possible on a separate sheet of paper. In a total of 400 trials, the stimuli were displayed 88 times (2 stimuli x 4 orientations x 11 repetitions) at each of four levels of gaussian blur (radius of 0, 20, 40 or 60) and 24 times at each of two levels of gaussian blur (2 stimuli x 4 orientations x 3 repetitions). As shown in Figure S37, Davida made many errors when the stimuli were displayed at a high level of spatial frequency (lower levels of gaussian blur), but her error rate decreased when the spatial frequency decreased (the gaussian blur increased) and she eventually became flawless at the lowest levels of spatial frequency (highest levels of blur). The Movie S22, illustrates Davida’s performance in this type of experiment with arrows presented at a high and low level of spatial frequency.
Fig. S37. Davida’s percentage correct responses by level of gaussian blur (from 0 to 100).
6.15. Task probing the influence of temporal frequency on Davida’s performance
In this experiment, Davida saw large (±10 x 6 degrees of visual angle) arrows displayed at the center of the computer screen, one at a time, on white background (RGB 255). In each trial, the arrow was initially colored in black (RGB 0) and Davida was asked to use the computer’s keyboard to decrease the luminance of the arrow until she was able to see it perfectly well. There were three conditions. In the first conditions the arrow was still (4 sessions). In the second condition, the arrow was flickering at 5.7 Hz (16 msec ON, 160 msec OFF; 2 sessions). In the third condition the arrow was flashed during 16 msec (2 sessions). The conditions were presented either four times (for the still condition) or twice (for the two other conditions) in separate sessions conducted on different days. One session of one condition consisted of 12 trials. As shown in Figure S38, Davida reported seeing the arrows displayed briefly and flickering perfectly well at higher contrast levels than still arrows. An analysis of variance (ANOVA) on these contrast levels yielded significant differences between these conditions (F(2, 93) = 478, p < 0.001). A post hoc Tukey test showed that the contrast level was significantly lower in the still condition than in the two other conditions (both ps < 0.001) and in the flicker condition than in the condition in which the arrow was presented during only 16 msec (p < 0.001).
Fig. S38. The bars indicate the average luminance contrast between the figure and the background at which Davida reported seeing the depicted stimulus perfectly well when the stimuli were still, when they were flashed for 16 ms, and when they were flickering. The error bars represent the standard deviation of these averages.
6.16. Naming the orientation of arrows displayed at low and high temporal frequency
Davida was randomly presented with arrows pointing up, down, left or right and asked to indicate the orientation of these arrows by pressing on the corresponding key on the computer keyboard. These arrows were large (10 degrees of visual angle), of 10 different levels of luminance (from 178 to 196 cd/m2 by steps of 2 cd/m2) and displayed still, flashed (16 msec) or flickering (5.7 Hz; 16 msec ON, 160 msec OFF) at the center of the screen on a very light grey background (198 cd/m2). Thus, there were 10 levels of luminance contrast between the figure and the background (from 1.01 to 1.11). Davida performed 20 trials by condition for a total of 600 trials (20 trials x 3 conditions x 10 levels of contrast). As shown in Figure S39, Davida’s performance was influenced by the temporal frequency of the stimuli: she was more accurate at naming the orientation of the arrows when they were flashed or flickering than when they were still at the highest levels of contrast. Note that the decrease of performance at the lowest contrast levels for the high temporal frequency conditions resulted only from non-responses, because Davida reported not seeing the stimuli at all. In contrast, the poor performance at the highest levels of contrast resulted from orientation errors.
Fig. S39. Davida’s percentage of correct responses for the three conditions of experiment 6.16 as a function of the luminance contrast of the stimulus.
6.17. Judging the orientation of 3D stimuli defined by binocular and monocular cues
In one experiment, Davida was shown 20 trials in which a real 3D wooden black arrow was positioned in front of her on white sheet of paper in one of four possible orientations (right, left, up, down) and asked to tell the orientation (right, left, up, down). In a second experiment, she was presented with 20 trials in which a real 3D “b” shaped wooden letter was positioned in front of her on white sheet of paper in one of four possible orientations (b, d, p, q) and asked to name the letter (b, d, p, q). Davida performed both tasks easily and flawlessly.
Then, she was asked to perform the same two experiments monocularly for both eyes. She performed the two tasks flawlessly with either eyes.