
ABSTRACT
Speaking requires the temporally coordinated planning of core linguistic information, from conceptual meaning to articulation. Recent neurophysiological results suggested that these operations involve a cascade of neural events with subsequent onset times, whilst competing evidence suggests early parallel neural activation. To test these hypotheses, we examined the sources of neuromagnetic activity recorded from 34 participants overtly naming 134 images from 4 object categories (animals, tools, foods and clothes). Within each category, word length and phonological neighbourhood density were co-varied to target phonological/phonetic processes. Multivariate pattern analyses (MVPA) searchlights in source space decoded object categories in occipitotemporal and middle temporal cortex, and phonological/phonetic variables in left inferior frontal (BA 44) and motor cortex early on. The findings suggest early activation of multiple variables due to intercorrelated properties and interactivity of processing, thus raising important questions about the representational properties of target words during the preparatory time enabling overt speaking.
Introduction
Language production is a fast process, which however relies on the timely planning and coordination of complex linguistic information. According to established theory (e.g., Dell et al., Citation1997; Hickok et al., Citation2011; Levelt, Citation1999; Levelt et al., Citation1999), this process involves multiple stages. One proposal states that these stages are ordered in time within subsequent temporal frames (Indefrey & Levelt, Citation2004; Levelt, Citation1989, Citation1999). First, conceptual preparation enables the activation of a concept, and then the selection of the corresponding lexical entry, or lemma, from a mental inventory of tens of thousands of words provides it with the appropriate grammatical/syntactic information. At this point, the abstract phonological code for the target lexical concept is selected, and the retrieved word form is then encoded by phonological information about syllabification, and phonetic details (e.g., number and sequence of phonemes), which are in turn translated into motor programmes leading to overt articulation.
This series of operations is known to rely on the functional orchestration of a left-lateralised network of language regions, which earlier metabolic and neuropsychological studies have well identified (e.g., Indefrey & Levelt, Citation2004; Price et al., Citation2005; Wilson et al., Citation2010; for a review: Indefrey, Citation2011). For instance, in picture naming tasks, conceptual preparation engages a distributed set of cortical regions in bilateral occipitotemporal and parietal cortex, reflecting visual processing, as well as the semantic properties of the activated target concept. Lexical selection recruits left inferior and middle temporal cortex and the left temporoparietal junction, and supramarginal gyrus (e.g., Hultén et al., Citation2009), whilst phonological code retrieval activates superior temporal cortex, particularly left middle-superior temporal gyrus and sulcus (Wilson et al., Citation2010), where the phonetic features are stored (Akbari et al., Citation2019; Mesgarani et al., Citation2014). Later stages involving syllabification and phonetic encoding require activity in left inferior frontal regions, with possible differentiation between more anterior and more posterior aspects of the inferior frontal gyrus (Indefrey, Citation2011; Papoutsi et al., Citation2009), although some studies did not confirm this (Liljeström et al., Citation2015). This multistage process culminates with activity in motor cortex supporting actual articulatory execution of overt speech, with ventral motor cortex underlying speech control (Bouchard et al., Citation2013), and supplementary motor area enabling selection and initiation of speech motor sequences (Hickok, Citation2022; Jürgens, Citation2009; Rogalsky et al., Citation2022; Teghipco et al., Citation2022; Tremblay & Gracco, Citation2010; Wilson et al., Citation2010).
While there is a general agreement on the core cortical architecture of language production planning, existing neurophysiological evidence has brought discrepant findings regarding the relative times of the neural activations involved, and the way the related processes interact (for discussions: Indefrey, Citation2016; Rapp & Goldrick, Citation2000; Strijkers & Costa, Citation2016). Therefore, the specific spatio-temporal properties of word planning processes and the related cortical mechanisms are still debated.
Based on an earlier meta-analysis of chronometric and metabolic data from word production studies (Indefrey, Citation2011), the orchestration of this network of cortical regions relies on feed-forward processes that are ordered over time (also see Hauk et al., Citation2006; Munding et al., Citation2016 for a review), with approximately hundred milliseconds from the initiation of activity specific to each computational stage and the next one (e.g., Indefrey & Levelt, Citation2004). Recent results from a picture naming study using magnetoencephalography (MEG) have suggested a rapid progression of neural activity over time, from early bilateral activation of posterior occipitotemporal sensor areas by conceptual preparation (within the first 0–150 ms post stimulus onset), to left-lateralised activation of anterior frontal sensor areas by phonological/phonetic encoding at later time windows (starting from 250–350 ms) (Carota et al., Citation2022).
Whilst this set of findings aligned with previous neurophysiological evidence for cascading neural dynamics of language planning (for a review: Munding et al., Citation2016), results from other MEG studies using different methodological approaches led to a divergent picture (e. g.; Miozzo et al., Citation2015; Strijkers et al., Citation2017; also see Liljeström et al., Citation2015). For example, using multiple regression analyses of MEG data, a first study (Miozzo et al., Citation2015) found that activity in several cortical regions in frontotemporal, parietal, motor and occipital cortex becomes correlated with multiple visual, semantic, lexical, phonological and articulatory variables at the same time, already within the first 130–160 ms post picture presentation. Similarly, source reconstruction data from the univariate approach followed by Strijkers et al. (Citation2017) provide further evidence for early (from 160 to 240 ms post picture onset) and simultaneous activation of frontotemporal regions by both word frequency, a variable assumed to target lexical selection and retrieval, and articulatory planning (e.g., place of articulation of initial phonemes of the to-be-named concepts). The execution of motor activity for articulation would then already operate at the initial stages of language planning, as reflected by activation of the premotor cortex (also see: Tremblay & Small, Citation2011). This possibility is also envisaged by the interpretation of metabolic results showing modulation of activation in pre-supplementary motor area by word length, a variable capturing phonological retrieval, but also affecting later stages until articulation (e.g., Wilson et al., Citation2010). Furthermore, functional connectivity results from another recent MEG study suggest the interplay of activity in posterior middle temporal and inferior parietal cortex – linked to lexical selection – and (pre-)supplementary motor area – linked to articulation –, which was however temporally located within a time window averaging MEG signals from 0 to 300 ms post picture onset (Liljeström et al., Citation2015). Therefore, ambiguity about the precise time of such motor activation persists across studies, possibly due to a number of methodological and task-related differences (e.g., analyses type, choice of linguistic variables targeting the different operations, definition and choice of regions of interest and of time windows of interest, task and related demands).
Still, the data speaking in favour of early parallel activation depart from a strict feed-forward processing principle, making a very different claim. Indeed, if articulatory planning took place at the same early time as conceptual access, the simultaneous activation of multiple and even long-distant cortical regions would be explained, in terms of Hebbian learning principles (Hebb, Citation1949), as a reflection of immediate ignition of neuronal cells by the different types of linguistic information required for word planning. Whilst both models allow for parallel processing, what becomes important for better evaluating the theoretical implications of these competing sets of findings on the neural processes supporting language production, is to raise the question to what extent the linguistic content of the different word planning operations becomes available to neural processing early on, even within the first hundred millisecond after a to-be-named picture is viewed.
In an earlier decoding study just mentioned above, Carota et al. (Citation2022) addressed this question focusing on sensor-level data because they have the temporal resolution to track how information patterns of neural activity change over time (Stokes et al., Citation2015), while also providing rich spatial information on the decoded activity. The results suggested that semantic category and phonological information are accessed at subsequent time windows in the posterior temporo-parietal and left frontal sensor areas, respectively. The study exploited synthetic planar gradients (Bastiaansen & Knösche, Citation2000), which allow for easier interpretation of the sensor-level results, as the maximal activity is typically located above the source (Hämäläinen et al., Citation1993). However, the reconstruction of the cortical sources of meaning-to-speech mapping, and their time course, was not directly performed, leaving the exact spatial localization of the neural events associated with semantic and phonological processing, and its comparability with existing literature, still elusive.
In the present follow-up study then, to identify the cortical dynamics underlying language planning, we examined the sources of neuromagnetic activity recorded from 34 participants overtly naming 134 images from 4 object categories (animals, tools, foods and clothes). Within each category, word length and phonological neighbourhood density were co-varied to target phonological/phonetic processes. Following a reviewer suggestion, we additionally tested the decodability of a variable we had not investigated in our earlier study (Carota et al., Citation2022): the place-of-articulation of our test words’ onset phonemes. For such variable, previous work by Strijkers et al. (Citation2017) had shown early cortical activations (160–240 ms post-picture onset). Furthermore, we included the decoding of Word Frequency, a variable which could not be balanced across stimulus items.
We employed multivariate pattern analyses (MVPA) searchlights in source space in order to decode object categories and phonological variables, and thus determine the specific spatio-temporal properties of the neural activity of the conceptual, phonological/phonetic and articulatory planning operations which prepare spoken language production. We discuss our results by reviewing current theories of language production.
Methods
Subjects
The current study presents the results from source reconstruction analyses of recently published sensor-level data (Carota et al., Citation2022). 34 native Dutch speakers (mean age = 24 years, sd = 3.6) participated in the experiment after providing written informed consent. All subjects were right-handed, had normal or corrected-to-normal vision, and reported no history of neurological, developmental, or language deficits. The study was approved by the ethical board CMO Arnhem/Nijmegen, under registration number CMO2014/288.
Materials
Stimuli consisted of 134 images from 4 object categories including animals, foods, tools and clothes. We used coloured realistic images from the picture database of Bank of Standardized Stimuli (BOSS) (Brodeur et al., Citation2014), and public domain images from the internet (e.g., Freepng.ru).
Images were selected on the basis of a list of depictable target words that are most commonly used to name the corresponding objects in Dutch. The list of object words was generated by co-varying the length of target words and phonological neighbourhood density within each semantic category. Word length affects lexical (word form retrieval) and post lexical (syllabification, phonetic and articulatory encoding) processes, as duration increases as a function of the number of phonemes/syllables (Indefrey & Levelt, Citation2004; Indefrey, Citation2011; Papoutsi et al., Citation2009). Phonological neighbourhood density affects both lexical and post lexical processes (Dell & Gordon, Citation2003; Harley & Bown, Citation1998; Vitevitch, Citation2002; Vitevitch et al., Citation1999), as shared phonemes in phonological neighbours facilitate word form activation (Vitevitch, Citation2002), whilst the correlation of phonological neighbourhood density with phonotactic probability facilitates phonetic/articulatory processes (Vitevitch et al., Citation1999). Therefore, it is easier to phonetically encode and articulate words with many neighbours, which contain more common phonemes and phonological sequences than words with fewer neighbours.
Word length was expressed by the number of syllables (65 short monosyllabic words, 66 long bisyllabic words and 3 trisyllabic words). Phonological neighbourhood density was expressed by the number of words that differ in one phone from the target word. This was calculated by counting all word entries in CELEX that differ in one phone symbol from the target word, after discarding stress and syllable markers from the phonological word representation in CELEX. Words were ranked according to such differences and subdivided into four groups (lower, low, high, higher) while keeping the group size as balanced as possible: 39 lower (0–4 neighbours), 29 low (5–9 neighbours), 35 high (10–19 neighbours) and 31 higher (20–39 neighbours). The psycholinguistic properties of the 134 stimulus items are summarized in . Mean and standard deviation (SD), median and range (R, the difference between largest and smallest value of the variable) are reported, as calculated across items (1.A), and for mono – and disyllabic words separately (1.B).
Table 1. Psycholinguistic properties of the 134 stimulus items. Mean and SD, median and range are reported, as calculated across items and for mosyllabic and disyllabic words separately.
Word length and phonological neighbourhood density were negatively correlated with each other (r(132) = −0.67, p < .001) (see Carota et al., Citation2021 for discussion).
Word frequency could not be fully matched across conditions. Word frequencies were obtained from SUBTLEX (Keuleers et al., Citation2010), which provides a standard measure of word frequency independent of corpus size: frequency per million words with a 4-digit precision. Word frequency was negatively correlated with word length (r(132) = −0.37, p < .001) and positively correlated with phonological neighbourhood density (r(132) = 0.32, p < .001).
Because this variable is known to affect all stages of the word production planning (Hanulová et al., Citation2011), we assessed the related statistical effect on our variables of interest, by conducting one-way repeated measure ANOVA with Object category (animals, foods, tools, clothes) and Word Length (short, long), and Phonological Neighbourhood density (low, high). There was no effect of Word Frequency on Object category. As for the phonological variables, there was a main effect of Word Frequency on Word Length (F[1,132] = 23.95, p < .001), with short words being more frequent (M = 12.82) than long words (M = 3.95). There was also a main effect of Word Frequency on Phonological Neighbourhood Density (F[1,32] = 11.69, p = .001), with low-density words being less frequent (M = 5.07) than high-density words (M = 11.53).
Behavioural recordings
Stimuli were presented using the Presentation software (Neurobehavioral Systems, Inc., Berkeley, CA, www.neurobs.com). The pictures were displayed at the centre of the screen at a size of 300 by 300px (1920 by 1080 screen resolution and a refresh rate of 120 Hz, delay <1 ms with almost instantaneous presentation of the full screen), in a light grey background within a visual angle of 4 degrees. They were presented using a liquid crystal display video projector and back projected onto the screen using two front-silvered mirrors.
Vocal responses were captured with a microphone and recorded at 44.1 kHz using the Audacity software (https://audacityteam.org/). Vocal responses were recorded as wav files and response latencies were determined offline using the Praat software (Boersma & Weenink, Citation2019).
MEG recordings
Subjects were seated in the MEG system in a magnetically shielded room. They were asked to sit comfortably but to keep their body and head still during the task, and to try to avoid blinking. They were instructed to look at the stimulus screen, located 40 cm in front of them, focusing on the centre of the screen. The MEG signals were recorded using a high-density whole-head system (OMEGA 2000; CTF Systems), consisting of 275 axial gradiometer channels and 29 dedicated reference channels for environmental noise cancellation. The subject’s head was registered to the MEG sensor array using three coils placed at 3 anatomical landmarks (nasion, and left and right ear canals). The head position was continuously monitored during the MEG recordings, and readjusted during breaks if it deviated more than 9 mm from the initial position (Stolk et al., Citation2013). Head movements did not exceed 1.25 cm between blocks. Pairs of Ag/AgCl electrodes were used to record the horizontal and vertical electro-oculograms (EOGs), the electrocardiogram, and the surface electromyogram (EMG) from the orbicularis oris muscle (electrodes placed above the upper lip and below the lower lip) (impedance was kept lower than 15 kΩ for all electrodes). MEG, EMG and EOG signals were analogue low-pass filtered at 300 Hz, digitized at 1200 Hz, and saved to disk for offline processing.
MRI recordings and anatomical coregistration. For each subject, a standard T1-weighted magnetic resonance image (MRI) of the subject’s head was acquired with a 1.5 T Siemens Magnetom Sonata system using a magnetization-prepared, rapid-acquisition gradient echo sequence. Vitamin E capsules were placed in the outer meatus of the ear canal to serve as fiducial reference markers to facilitate coregistration with the MEG coordinate system. Using a 3-D digitizer (Fastrak Polhemus, Colchester, VA), the positions of the head localizer coils were digitally recorded relative to the same three anatomical landmarks as in the prior MEG recording (nasion, left and right preauricular points).
Data analysis
Behavioural data
Latencies of the subjects’ verbal responses were calculated offline by subtracting the time of picture onset marked by a 10 ms auditory signal (inaudible to the participants) from the time of speech onset.
Praat software (http://www.praat.org; Boersma & Weenink, Citation2019) was used to analyse the recorded audio signal and to semi-automatically identify the onset of beep and articulation. Automatic silence/non-silence interval boundaries were obtained by using intensity (dB) thresholds, and the resulting onset boundaries were manually inspected and corrected where needed (most often at word-initial voiceless consonants or vowels). 83% of response trials were correctly named (identical to the target word). Incorrectly named trials (3%) and verbal disfluencies (stuttering, utterance repairs and production of non-verbal sounds) (14%) were excluded from the analyses.
In order to assess and assure synchrony between the onsets of picture and the auditory beep signal for subsequent MEG data analyses, the audio files were aligned with the picture onset triggers for the pre-processing of the MEG data, and with the audio channel in the MEG. For the alignment, the (very small) difference in clock speed of the computer for audio recording and the MEG acquisition computer was taken into account by estimating the delay between the presentation triggers and the delivery of the beep.
For behavioural data analysis, the effects of the variables of interest on naming latencies were assessed by conducting a one-way repeated measures ANOVA on the averaged naming latencies of each subject with Semantic Category, Word Length and Phonological Neighbourhood Size as independent variables.
MEG data pre-processing
Data were processed using MATLAB (Version R2021a) and the FieldTrip toolbox (Oostenveld et al., Citation2011). Data were epoched into segments from −100 to 1000 ms relative to picture onset. For response-locked analyses, data were epoched into segments of −1000 to +100 ms relative to speech onset. Independent Component Analysis (ICA) was used to remove ECG artefacts using the logistic infomax ICA algorithm (Bell & Sejnowski, Citation1995), using the EEGLAB implementation (Delorme & Makeig, Citation2004; http://eeglab.org). Prior to decomposing the MEG signal into components, data were band-pass filtered in the 1–30 Hz range and down-sampled to 300 Hz. The topographies of the components were visually inspected, along with their time course for the first 40 trials, and the effect of removing the components that were identified as containing artefacts was checked. Samples contaminated by artefacts due to eye movements, muscular activity and superconducting quantum interference device jumps were replaced by NaN (not a number) to allow excluding those samples from further analysis.
Source reconstruction
We applied linearly constrained minimum variance beamforming (Van Veen et al., Citation1997), to reconstruct the sources of neural activity onto a parcellated cortically constrained source model. To this aim, we computed single-trial covariance matrices between all MEG sensor pairs. The covariance matrices were used in combination with the forward model to obtain time courses of source activity at 8196 dipole locations on template cortical sheet to generate one filter per dipole location, co-registered to a template using the Caret software (Van Essen Laboratory at the Washington University School of Medicine) (Van Essen et al., Citation2001), and down sampled to 8196 nodes using the MNE software (https://mne.tools/stable/index.html; Gramfort et al., Citation2014).
Data were parcellated using an anatomical atlas including 374 parcels (Schoffelen et al., Citation2017). For each parcel, we performed a principal component analysis on the dipole time series, and selected for further analysis the first five spatial components that explained the most variance in the parcel-specific reconstructed signal. These parcels were used as searchlights in the subsequent analyses.
Classification pattern analyses
Spatiotemporal multivariate pattern analysis (MVPA) was used to assess whether the experimentally manipulated stimulus features could be decoded from the MEG reconstructed signals. The stimulus features of interest were 1. Object Category, 2. Word Length as quantified by the number of syllables, 3. Phonological Neighbourhood Density, 4. Place of Articulation and 5. Word Frequency.
The object category variable coded for the four categories of animals, tools, foods, clothes, the word length variable coded for short (mono-) and long (bisyllabic and trisyllabic) words, the phonological neighbourhood density variable was discretized into four classes of approximately equal size (smaller/small/large/larger). As such, decoding for the variables of interest constituted 4-way and binary classification tasks.
Regarding place of articulation, since our study was not initially designed for analysing this specific contrast, we focused on the categories of labial and coronal sounds, which could be directly compared to the study by Strijkers et al. (Citation2017). Therefore, we created two groups of labial (/b/, /p/,/f/,/v/ and/m/) and coronal (/t/,/d/,/s/,/l/and/k/) phonemes, for which the lips and the tongue are the respective places of articulation (see Strijkers et al., Citation2017). A third group included all other initial phonemes of the test items. This led to a 3-way classification task.
To control for low-level visual confounds, we decoded the object categories while accounting for low-level visual features of the object images in the estimation of the within-subject null-distribution of the category classification (see below). We took the following visual features into account: contrast, as measured by the intensity contrast between a pixel and its neighbours over the whole image (Corchs et al., Citation2016), visual complexity, quantified by Edge Density as the percentage of pixels that are edge pixels (Rosenholtz et al., Citation2007; Forsythe et al., Citation2008). These variables were discretized into two classes of approximately equal size (low/high). In addition, we controlled for pixel information, following (Kriegeskorte et al., Citation2008). The stimuli images were first converted to greyscale with value range discretized into 6 parts, and then down-sampled from 450 × 450 pixels to 10 × 10 pixels (with bicubic interpolation). Each of the 100 resulting pixels was included as an additional visual variable to control for during classification-based encoding. By modelling indirect and direct image key characteristics we controlled for visual characteristics to a fair degree and reduced the chance that visual information affects results considerably.
Since we could not balance word frequency across stimuli, we decoded the phonological variables (word length and PND), and the articulatory variables, while accounting for the word frequency of the items in the estimation of the within-subject null-distribution of the pattern classification of these variables (see below). We also tested for the decodability of the Word Frequency variable per se.
We trained a Gaussian naive Bayes classifier (Mitchell, Citation1997), as implemented in the MVPA-light toolbox (Treder, Citation2020) to detect the neurocognitive states linked to conceptual and phonological/phonetic processing stages in the MEG spatiotemporal patterns during language planning. To evaluate classification performance and to control for overfitting, repeated stratified five-fold cross-validation was employed. The data were randomly split into five equal folds, ensuring the equal presence of classes in each fold (stratification). The model was trained on four folds and validated on the fifth fold. The process was repeated five times, such that each fold was used for validation. The entire cross-validation was furthermore repeated five times with new randomly assigned folds, to reduce bias that might be caused because of how data were randomly partitioned into folds, and the final averaged results are reported. To avoid classification bias due to class imbalance in the class labels, random under-sampling was applied to training and test data, by discarding randomly selected samples from majority classes until each class was represented by an equal number of samples.
We quantified the decoding performance by means of classification accuracy, which is the fraction of correctly predicted class labels. The higher the classification accuracy, the better response patterns associated with the class labels can be determined.
For each parcel and time-point a classifier was trained on source data of all vertices within that parcel while concatenating across all time-points within a sliding window of width 100 ms. To assess whether classifier performance was above chance performance, we estimated the chance level empirically, using permutations at the single subject level. We repeated the classification testing after shuffling the class labels, and recomputed classifier performance on the shuffled class labels to obtain a distribution under the null hypothesis of exchangeability of class labels (see e.g., Cichy et al., Citation2014; Cichy & Panzatis, Citation2017; Isik et al., Citation2014; Kaiser et al., Citation2016). The randomization of class labels for the number of syllables and the phonological neighbourhood density classification was constrained to account for the fact that the object category was not fully orthogonal to the other features of interest. To this end, the randomization of class labels was performed for each object category separately.
We controlled for low-level visual confounds in the classification of semantic object categories, by constraining the within-subject randomization procedure (to obtain the subject-specific distribution for object classification under the null hypothesis) to binned collections of stimuli, where the bins were defined according to the visual features of the images. For the phonological and articulatory variables, the bins were defined according to word frequency (low, high). For statistical inference, we used non-parametric cluster-based permutation tests across space and time (Maris & Oostenveld, Citation2007), using 2000 permutations. The cluster-based permutation procedure employs the same spatial neighbourhood structure that was used in the classification searchlight procedure, clustering the selected samples (sensors, time points) on the basis of spatial and temporal adjacency. The test-statistic used was a group-level T-statistic against the empirical chance level using the subject-specific Z-standardised decoding accuracy scores. These Z-scores for each subject were obtained by subtracting the mean accuracy obtained from 100 randomizations from the observed accuracy, and dividing by the standard deviation across randomizations. The T-values we report in our results refer to a one-sided T-test testing whether decoding is better than chance. Therefore, negative T-values would mean worse than chance decoding, which, by definition, is not possible and led us to treat negative peaks as irrelevant. Two analyses were performed, and are reported here. One analysis was based on the onset of the picture (−100 + 1000 ms post picture onset), and the other one locked to the onset of the speech responses (−1000 + 100 before speech onset).
Results
Behavioural results
reports the averaged RT and naming accuracy per semantic category, as quantified based on subjects’ actual responses during the MEG experiment. Standard deviation (SD) and range (calculated across items) are reported.
Table 2. Averaged RT and naming accuracy values per semantic category, monosyllabic and dysillabic words (length), different groups based on PND, Word Frequency, and articulatory differences.
The one-way repeated measures ANOVA on the averaged naming latencies of each subject with Semantic Category, Word Length and Phonological Neighbourhood Size as independent variables revealed a main effect of Semantic Category (F[1, 32] = 12.626, p < .001), with the RT being slower for Clothes (see ).
Furthermore, we inspected whether Semantic Category interacted with Word Frequency. As expected, high frequency words (M = 0.821 s, SD = 0.085) were named faster (F(1, 32) = 50.43, p < .001) than low frequency words (M = 0.877 s, SD = 0.102). Importantly though, there was no interaction of Word Frequency with Semantic category, suggesting that the semantic effects were not linked to word frequency.
Results from MVPA searchlight analysis in source space
We here report the cortical activity locked to both stimulus onset (picture presentation), and speech response onset. Results from the spatiotemporal searchlight analyses of MEG data in source space pointed to different underlying cortical dynamics associated with the semantic, phonological and articulatory variables of the present study.
displays the cortical sources of neuromagnetic activity at above chance decoding accuracy (expressed as T statistics) for object categories relative to stimulus onset ((A)) and to response onset ((B)). We found that the four conceptual categories were distinguished within the first 200 ms post picture onset in occipital, left posterior inferior temporal cortex and fusiform gyrus.
Figure 1. Object categories. A. Stimulus-locked data. Top panel. Cortical distribution (left hemisphere) of the above chance decoded activity specific to the object category condition (after controlling for visual features, including pixel information: see methods). Bottom panels: Time course of the above chance decoded activity in early visual cortex (left panel), posterior inferior/middle temporal cortex and posterior fusiform within the first 180 ms post-stimulus onset. B. Response-locked data. Top panel. Cortical distribution (left hemisphere) of the above chance decoded activity specific to the object category condition (after controlling for visual features, including pixel information: see methods). Bottom panels: Time course of the above chance decoded activity in inferior/middle temporal and frontal cortex linked to conceptual preparation before speech onset time.
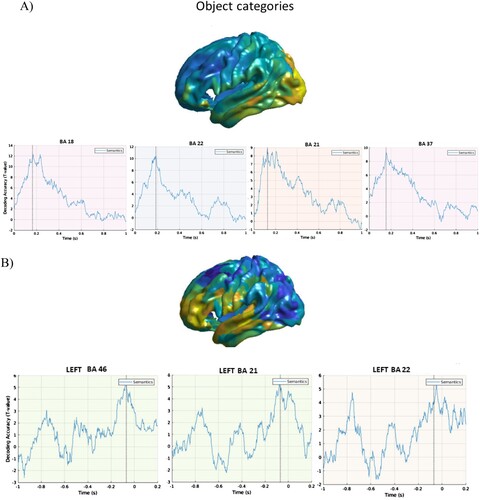
Figure 2. Word length. A. Stimulus-locked data. Top panel. Cortical distribution (left hemisphere) of the above chance decoded activity specific to the word length condition after controlling for word frequency. Bottom panel: Time course of the above chance decoded activity in the LIFG BA 44 and premotor cortex (BA 6), respectively within the first 200 ms and 100 ms post-stimulus onset. B. Response-locked data. Left panel. Cortical distribution (left hemisphere) of the above chance decoded activity specific to the word length condition. Right panel: Time course of the above chance decoded cortical activity in the LIFG BA 44 and the premotor cortex (BA 6) before speech onset: effects can be seen from about −800 before speech onset.
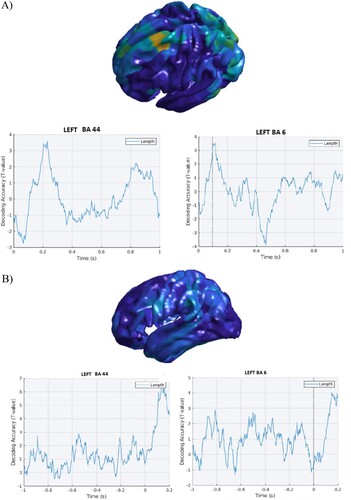
As shown in (A), the above chance cortical activity for word length seen after while controlling for word frequency showed a decoding effect in BA 44 and premotor cortex (BA 6), respectively within the first 200 ms and the first 100 ms. Early effects were also found in the results from response-locked data ((B)).
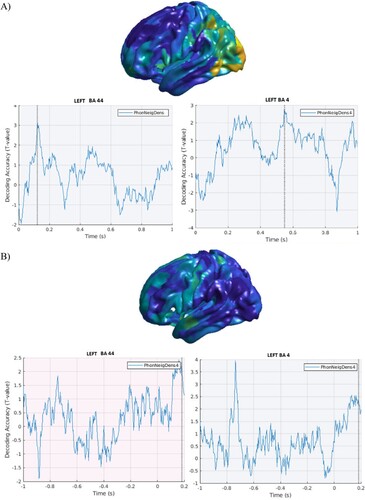
Decoding accuracy for phonological neighbourhood density showed early effects in BA 44, peaking around 100 ms post stimulus onset in the stimulus-locked data, as depicted in (A). Only a weaker effect (T = 1.8) could be found in the response-locked results ((B)). However, an early effect present in motor regions around −800 ms before speech onset ((B)) was also found in the results from the stimulus-locked analyses ((A)).
Figure 3. Phonological neighbourhood density. A. Stimulus-locked data. Top panel. Cortical distribution (left hemisphere) of the above chance decoded activity specific to the phonological neighbourhood density condition, after controlling for word frequency. Bottom panel: Time course of the above chance decoded activity in the LIFG BA 44, peaking around 100 ms post-stimulus onset and motor cortex, showing low levels of above chance decoding accuracy overall. B. Response-locked data. Top panel. Cortical distribution (left hemisphere) of the above chance decoded activity specific to the phonological neighbourhood density condition. Bottom panel: Time course of the above chance decoded activity in the LIFG BA 44 with no effects before speech onset. In motor cortex, a transient early effect was seen, around 800 ms before speech onset, which could not be seen in the stimulus-locked analyses.
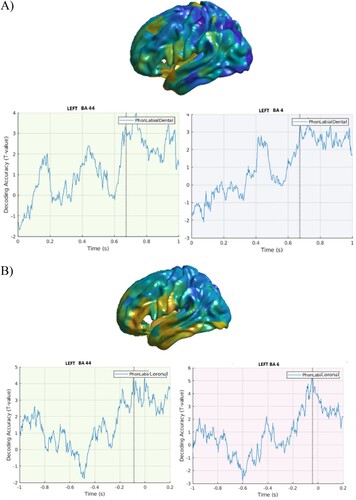
Turning to the Place of Articulation data, there were no early effects in either stimulus- or response-locked results ((A, B), respectively).
Figure 4. Place of articulation. A. Stimulus-locked data. Top panel. Cortical distribution of the above chance decoded activity specific to the Place of Articulation condition, after controlling for word frequency. Bottom panel: Time course of the above chance decoded activity in the LIFG BA 44, premotor and motor cortex. B. Response-locked data. Top panel. Cortical distribution (left hemisphere) of the above chance decoded activity specific to the Place of Articulation condition. Bottom panel: Time course of the above chance decoded activity in the LIFG BA 44 and motor cortex.
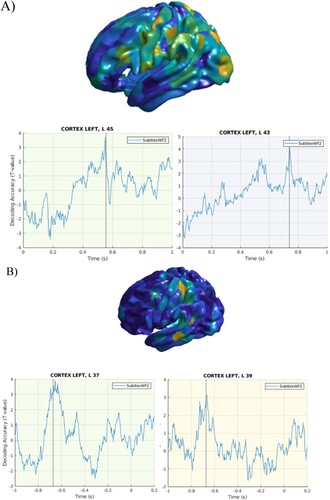
A mixed pattern of results was also found for Word Frequency, as this variable was decoded at relatively late latencies (550 ms) in the stimulus-locked data ((A)), and early on (−600 ms) in the response-locked data ((B)), possibly due to its role at multiple processing stages of word production.
Figure 5. Word frequency. A. Stimulus-locked data. Top panel. Cortical distribution of the above chance decoded activity specific to word frequency in widespread brain regions. Bottom panel: Time course of the above chance decoded activity in the LIFG BA 45 and 43, with effects present within the first 600 ms post-stimulus onset. B. Response-locked data. Top panel. Cortical distribution of the above chance decoded activity specific to word frequency in widespread brain regions. Bottom panel: Time course of the above chance decoded activity in the LIFG BA 37 and BA 39, with peaks around −700 ms before speech onset.
Discussion
We investigated the neural dynamics of language production in an overt picture-naming task using multivariate pattern classification analyses (MVPA) of MEG data in source space to determine the cortical regions supporting core word planning computations, such as conceptual preparation and phonological/phonetic encoding, and the relative times of their activation. Conceptual access was indexed by category distinctions of our stimulus objects, whilst word length manipulation and phonological neighbourhood density targeted phonological/phonetic encoding. In addition, following a reviewer’s suggestion, we included the variable of place-of-articulation of the target words’ initial phonemes.
We identified two distinct sets of cortical sources of neuromagnetic activity linked to these different processes. Relative to picture onset, object categories were differentiated in bilateral occipital cortex within the first 90 ms post picture presentation, in posterior inferior temporal cortex and fusiform gyrus (BA 37), and in posterior middle temporal cortex (BA 21), within the first 270 ms post picture onset. After controlling for visual confounds, the time course of decoding in these regions was however consistently found within the first 200 ms post-picture onset. We found a relatively weaker but still prominent effect of decoding accuracy for the semantic categories in the response-locked analysis early on.
Turning to the phonological variables, an early effect of decoding for word length became apparent in the results from both stimulus-locked response-locked analyses.
As for phonological neighbourhood density, we found a transient effect of early decoding (around 150 ms post stimulus onset) in LIFG BA 44, which was however weaker in the results from the response-locked analyses, and an effect in motor cortex (BA 4) consistent between stimulus- and response-locked data.
Furthermore, the places of articulation of the initial phonemes of the target items could be distinguished from the first 200 ms from stimulus onset, and within the first −800 ms before speech onset in the LIFG BA 44, premotor and motor cortex.
Word frequency could be decoded at relatively late latencies (550 ms) in the stimulus-locked data. However, this variable could be reliably decoded early on (−600 ms), possibly because it affects several early processes and was thus robust against the temporal jitter.
The present set of results differs from the results reported in Carota et al. (Citation2022), due to obvious methodological differences. The previous paper reports decoding results in sensor space, whilst the current one focuses on source space. Decoding accuracy is a highly derived metric from the actual neural data. When the features for the decoding are (spatial searchlights of neighbouring) sensors, the sources that are seen by those sensors may constitute slightly different cortical territory as compared to when approximately spatially overlapping cortical parcels are used for the features. This being said, there was no apparent discrepancy with respect to the semantic category decoding. The sensor level paper shows that, after controlling for low-level visual features, effects in occipitotemporal sensors in the earliest time window from 0 to 150 ms were no longer present, and the decoding effects reflecting access to conceptual category information were found within the time window starting from 150 to 250 ms post-stimulus onset. Taking into account the temporal resolution of the time courses in of the current manuscript, the results we report in the present study, showing a decoding effect in occipitotemporal cortex within the first 200 ms for the object category distinctions, are well consistent with the ones in Carota et al. (Citation2022). Importantly, regarding the phonological/phonetic comparisons, the results we reported here were based on analyses controlling for word frequency effects, as suggested by one of our reviewers. Such a control was not performed in the previous publication based on sensor-level data. Another difference was that we here directly tested for the effects of articulatory information. Therefore, the two sets of results cannot be directly compared, and the outcome of the two studies differs according to such methodological choices.
Taken together, the present results confirm functionally and temporally dissociable neural events, in line with earlier neurophysiological evidence (e.g., Hultén et al., Citation2009; Laaksonen et al., Citation2012; for a review, see Munding et al., Citation2016; Carota et al., Citation2022; Levelt et al., Citation1998; Liljeström et al., Citation2009; Maess et al., Citation2002; Salmelin et al., Citation1994; Sörös et al., Citation2003; Vihla et al., Citation2006), and testing for the reliability of electrophysiological signatures of language production results (e.g., Ala-Salomäki et al., Citation2021; Laganaro, Citation2017; Roos & Piai, Citation2020). However, the present results also bring some evidence for early processing of phonological/phonetic, and, possibly, articulatory variables, which can be put in parallel with the findings by Strijkers et al. (Citation2017), thus raising a number of interesting theoretical questions, some of which we will raise below.
Concerning conceptual preparation, activity linked to the visual recognition of the pictures and identification of the visual objects visual processing started in early visual cortex within the first 90 ms post picture onset, then spanning to occipitotemporal cortex, posterior portion of the inferior and fusiform gyrus (Contini et al., Citation2020; Proklova et al., Citation2019; Simanova et al., Citation2010, Citation2014, p. 2015; Vindiola & Wolmetz, Citation2011). After controlling for visual confounds, we however found effects withing the first 190 ms in inferior/middle temporal and fusiform cortex, which more genuinely reflected access to conceptual information, thus fully in line with the time window starting from 150 to 250 ms post picture onset, in which previous results from analyses of the same data in sensor space showed that object category differentiation (Carota et al., Citation2022). Our data are then consistent with previous findings suggesting that this set of cortical regions enables the emergence of object concept representations from visual input, supporting the extraction of the basic-level visual features and feature conjunctions that are necessary for object meaning identification and discrimination in both object naming tasks (e.g., Clarke et al., Citation2013), and object comprehension (e.g., Carlson et al., Citation2014; Cichy et al., Citation2014; Kietzmann et al., Citation2019).
Our results also point to an effect of object category discrimination in the left posterior/mid-middle temporal cortex, an area known to be functionally relevant for the storage of lexico-semantic representations in long-term semantic memory (Fuster et al., Citation2009; Hagoort, Citation2020; Turken & Dronkers, Citation2011), in both language comprehension and production tasks (Hagoort & Levelt, Citation2009; Indefrey, Citation2011). Furthermore, this region has been shown to differentiate the representation of different action and object categories (action words, tool nouns) from non-action-related categories (e.g., animals) (e.g., Carota et al., Citation2017), and has being particularly important in the encoding of taxonomic semantic relations between concepts (e.g., relating “strawberry” and “cherry” based on their shared superordinate node “fruit”, while differentiating them from “swan” due to the different superordinate node “animal” of the latter: see Carota et al., Citation2021). In language production, the conceptual content encoded in the posterior and mid portion of the left middle temporal cortex becomes essential for concepts-to-word forms mapping in conceptually driven lexical selection (Indefrey, Citation2011).
Also, the time course of left posterior middle temporal activity was consistent with the ERP results from go-nogo response paradigms, which indicate N200 nogo responses at about 200 and 260 ms (e.g., Guo et al., Citation2005) as markers of the upper temporal boundary at which animal information becomes available. Later latencies (around 300 ms) were reported by Hanulová et al. (Citation2011). These different time courses of conceptual access are likely due to task demands (e.g., decision to press a button or withhold the button press), but also to the type of conceptual information needed for a given stage. For instance, in the context of object naming, early (around 120 ms) influence of conceptual information has been reported in ERP studies manipulating the complexity of conceptual information associated with novel vs. familiar objects and names, even if naming novel objects produced later latencies relative to familiar objects (Abdel Rahman & Sommer, Citation2008). Abdel Rahman and Sommer (Citation2008) propose that this is even evidence for the role of conceptual knowledge in perceptual analysis and object recognition. Although the presence of semantic processing starts early on, the type of conceptual information that is relevant for lexical access (e.g., “fruit” or “inanimate” for “cherry”) may become available at later times. Even then, some semantic features, such as “animate”, “animal”, may be essential for activating a to-be-named target concept such as “dog”, and more peripheral semantic information about a dog’s “diet” (carnivore/omnivore) is activated later than more core information about “size” (small/big) before, without delaying lemma and word form retrieval (Abdel Rahman & Sommer, Citation2003). This suggests that conceptual processing continues to run along with subsequent language production stages (see also Carota et al., Citation2021 for MEG evidence in sensor space for synchronous processing). Indeed, the results from response-locked analyses indicated that conceptual categories could still be distinguished close to speech responses.
In our present study, we also decoded the variables associated with phonological encoding (word length) and phonetic encoding (phonological neighbourhood density) at relatively early time windows. This means that using a different methodological approach, such as MVPA searchlights in source space, we replicated earlier findings by Miozzo et al. (Citation2015), suggesting an early effect of such variables (see also Fairs et al., Citation2021, for an early effect of phonotactic frequency). The present data likewise showed later effects of such variables, as expected by the cascading model of Indefrey and Levelt (Indefrey & Levelt, Citation2004; Indefrey, Citation2011), and call for further theoretical refinement of the earliness, simultaneity and sequentiality of conceptual and phonological processing stages.
As for articulation, Strijkers et al. (Citation2017) reported an early effect of a place-of-articulation contrast (labial vs. coronal) onset consonants in the time-window of 160–240 ms in the motor cortex. Following the suggestion of a reviewer, we tested the decodability of the same contrast on a subset of our stimuli starting with these consonants. In the present data, this articulatory variable could be decoded with higher accuracy in the LIFG BA 44 and motor cortex close to response onset, but we also found a weaker but persistent effect in both regions at earlier time windows. An important caveat is, however, that our study was not designed for testing this specific contrast so that the results of our post-hoc analysis should be treated with caution and require, as we feel, further investigation.
Regarding our initial question about the relative time courses of conceptual and phonological/phonetic processing, the results of our study suggest not only that semantic categories can be decoded from MEG source data early on (within the first 200 ms post picture onset), but also the phonological/phonetic and, possibly, articulatory variables. The late effect of the phonetic/articulatory variable is in line with both sequential and parallel models: with sequential models because phonetic/articulatory information about a target word will only become fully available for execution once lexical selection and word form retrieval take place, and with parallel models because they assume that the representation of phonetic/articulatory information is rapidly activated after stimulus presentation but is activated for being executed later on (Fairs et al., Citation2021; Strijkers & Costa, Citation2016). Activation for execution is close to what is also assumed in sequential/cascading models, so that it is the question of an early initial activation of word form representations that is the main discrepancy between sequential/cascading models and parallel models, and that is why we were particularly interested in replicating (or not) the early decodability of phonological/phonetic variables.
To date, early effects of different variables have been reported. Miozzo et al. (Citation2015) used a phonological variable combining word length and phonological neighbourhood density. Strijkers et al. (Citation2017) used a place-of-articulation variable. Fairs et al. (Citation2021) manipulated phonotactic frequency and were able to show interaction effects of this variable in the same time windows as effects of word frequency in both word production and comprehension. Although in all these studies effects of word-form related variables were shown to arise simultaneously with semantic or lexical effects and were characterized as “early” the exact time windows differ. Whereas Miozzo et al. (Citation2015) and Strijkers et al. (Citation2017) report early effects from about 150 ms onwards, Fairs et al. (Citation2021) report effects in an even earlier time window (74–145 ms). Given the variability in variables and design, it remains to be seen which early effects turn out to be robust. In our view, the most important issue, however, is the question of how such early word-form related effects can come about and what they reflect. Some authors refer to these effects as reflecting the activation or “ignition” of cell assemblies representing the target words (“word assembly”, Strijkers & Costa, Citation2016). We believe, however, that it needs to be specified more clearly what kind of stimulus information is necessary and sufficient to activate the assembly of the target word. With respect to their earliest effect of phonotactic frequency Fairs et al. (Citation2021) say that “we do not believe the early effect indexes item specific retrieval of the target word, for which the TW between 186 and 287 ms seems a better candidate … ”(p. 11). The authors rather suggest that their early effect reflects differential activation of sets of words rather than a single word. This possibility is interesting and may provide a bridge to sequential models also assuming activations of multiple candidates in perception (“cohorts” based on initial phonemes) and production (activation of multiple concepts based on a picture). Sequential comprehension models indeed in some sense assume parallel activation in the form of activation of semantic information of multiple cohort candidates and weighting cohort candidates according to their lexical frequencies. There is less compatibility with sequential/cascading production models because they do not assume that word form information is activated for every candidate concept. Even if one assumes that early word form effects reflect activations of sets of words the problem remains to specify what determines the “set of potential words linked to the input” (Fairs et al., Citation2021) and why, for example, the set of words can be different for a high phonotactic frequency input word starting with /pl/ and a low phonotactic frequency input word starting with /pl/, when in the time interval of 74–145 ms certainly no more than those two phonemes are processed.
This is something that, as we feel, deserves further experimental investigation and theoretical refinement in future work in the field.
Acknowledgements
We thank Peter Hagoort, the Neurobiology of Language Department of the MPI and DCCN, and Vitoria Piai for insightful discussions at earlier stages of our study. We are also thankful to Brad Mahon, Kristof Strijkers, and other two anonymous reviewers for their valuable comments and feedback on a previous version of the present article.
Disclosure statement
No potential conflict of interest was reported by the author(s).
Additional information
Funding
References
- Abdel Rahman, R., & Sommer, W. (2008). Seeing what we know and understand: How knowledge shapes perception. Psychonomic Bulletin & Review, 15(6), 1055–1063. https://doi.org/10.3758/PBR.15.6.1055
- Akbari, H., Khalighinejad, B., Herrero, J. L., Mehta, A. D., & Mesgarani, N. (2019). Towards reconstructing intelligible speech from the human auditory cortex. Scientific Reports, 9(1), 1–12. https://doi.org/10.1038/s41598-018-37359-z
- Ala-Salomäki, H., Kujala, J., Liljeström, M., & Salmelin, R. (2021). Picture naming yields highly consistent cortical activation patterns: Test–retest reliability of magnetoencephalography recordings. Neuroimage, 227, 117651. https://doi.org/10.1016/j.neuroimage.2020.117651
- Bastiaansen, M. C., & Knösche, T. R. (2000). Tangential derivative mapping of axial MEG applied to event-related desynchronization research. Clinical Neurophysiology, 111(7), 1300–1305. https://doi.org/10.1016/S1388-2457(00)00272-8
- Bell, A. J., & Sejnowski, T. J. (1995). An information-maximization approach to blind separation and blind deconvolution. Neural Computation, 7(6), 1129–1159. https://doi.org/10.1162/neco.1995.7.6.1129
- Boersma, P., & Weenink, D. (2019). Praat: doing phonetics by computer [Computer program]. Version 6.0.37 from http://www.praat.org/
- Bouchard, K. E., Mesgarani, N., Johnson, K., & Chang, E. F. (2013). Functional organization of human sensorimotor cortex for speech articulation. Nature, 495(7441), 327–332. https://doi.org/10.1038/nature11911
- Brodeur, M. B., Guérard, K., & Bouras, M. (2014). Bank of standardized stimuli (BOSS) phase II: 930 new normative photos. PLoS One, 9(9), e106953. https://doi.org/10.1371/journal.pone.0106953
- Carlson, T. A., Simmons, R. A., Kriegeskorte, N., & Slevc, L. R. (2014). The emergence of semantic meaning in the ventral temporal pathway. Journal of Cognitive Neuroscience, 26(1), 120–131. https://doi.org/10.1162/jocn_a_00458
- Carota, F., Kriegeskorte, N., Nili, H., & Pulvermüller, F. (2017). Representational mapping of distributional semantics in left inferior frontal, middle temporal and motor cortex. Cerebral Cortex. https://doi.org/10.1093/cercor/bhw379
- Carota, F., Nili, H., Pulvermüller, F., & Kriegeskorte, N. (2021). Distinct fronto-temporal substrates of distributional and taxonomic similarity among words: evidence from RSA of BOLD signals. NeuroImage, 224, 117408. https://doi.org/10.1016/j.neuroimage.2020.117408
- Carota, F., Schoffelen, J.-M., Oostenveld, R., & Indefrey, P. (2022). The time course of language production as revealed by pattern classification of meg sensor data. Journal of Neuroscience, 42(29), 5745–5754. https://doi.org/10.1523/JNEUROSCI.1923-21
- Cichy, R. M., & Pantazis, D. (2017). Multivariate pattern analysis of MEG and EEG: A comparison of representational structure in time and space. NeuroImage, 158, 441–454. https://doi.org/10.1016/j.neuroimage.2017.07.023
- Cichy, R. M., Pantazis, D., & Oliva, A. (2014). Resolving human object recognition in space and time. Nature Neuroscience, 17(3), 455–462. https://doi.org/10.1038/nn.3635
- Clarke, A., Taylor, K. I., Devereux, B., Randall, B., & Tyler, L. K. (2013). From perception to conception: how meaningful objects are processed over time. Cerebral Cortex, 23(1), 187–197. https://doi.org/10.1093/cercor/bhs002
- Contini, E. W., Goddard, E., Grootswagers, T., Williams, M., & Carlson, T. (2020). A humanness dimension to visual object coding in the brain. NeuroImage, 221, 117139. https://doi.org/10.1016/j.neuroimage.2020.117139
- Corchs, S. E., Ciocca, G., Bricolo, E., & Gasparini, F. (2016). Predicting complexity perception of real world images. PLoS One, 11, e0157986.
- Dell, G. S., & Gordon, J. K. (2003). Phonetics and phonology in language comprehension and production. Phonetics and Phonology in Language Comprehension and Production: Differences and Similarities, 6, 9–38. https://doi.org/10.1515/9783110895094.9
- Dell, G. S., Schwartz, M. F., Martin, N., Saffran, E. M., & Gagnon, D. A. (1997). Lexical access in aphasic and nonaphasic speakers. Psychological Review, 104(4), 801. https://doi.org/10.1037/0033-295X.104.4.801
- Delorme, A., & Makeig, S. (2004). EEGLAB: An open source toolbox for analysis of single-trial EEG dynamics including independent component analysis. Journal of Neuroscience Methods, 134(1), 9–21. https://doi.org/10.1016/j.jneumeth.2003.10.009
- Fairs, A., Michelas, A., Dufour, S., & Strijkers, K. (2021). The same ultra-rapid parallel brain dynamics underpin the production and perception of speech. Cerebral Cortex Communications, 2(3), tgab040. https://doi.org/10.1093/texcom/tgab040
- Forsythe, A., Mulhern, G., & Sawey, M. (2008). Confounds in pictorial sets: The role of complexity and familiarity in basic-level picture processing. Behavior Research Methods, 40, 116–129.
- Fuster, J. M. (2009). Cortex and memory: Emergence of a new paradigm. Journal of Cognitive Neuroscience, 21(11), 2047–2072. https://doi.org/10.1162/jocn.2009.21280
- Gramfort, A., Luessi, M., Larson, E., Engemann, D. A., Strohmeier, D., Brodbeck, C., Parkkonen, L., & Hämäläinen, M. S. (2014). MNE software for processing MEG and EEG data. Neuroimage, 1(86), 446–460. https://doi.org/10.1016/j.neuroimage.2013.10.027
- Guo, T. M., Peng, D. L., Lu, C. M., & Liu, H. Y. (2005). The temporal course of semantic and phonological activation in Chinese word production: An ERP study. Acta Psychologica Sinica, 37, 569–574.
- Hagoort, P. (2020). The meaning-making mechanism(s) behind the eyes and between the ears. Philosophical Transactions of the Royal Society B: Biological Sciences, 375(1791), 20190301. https://doi.org/10.1098/rstb.2019.0301
- Hagoort, P., & Levelt, W. J. (2009). The speaking brain. Science, 326(5951), 372–373. https://doi.org/10.1126/science.1181675
- Hämäläinen, M., Hari, R., Ilmoniemi, R. J., Knuutila, J., & Lounasmaa, O. V. (1993). Magnetoencephalography – theory, instrumentation, and applications to noninvasive studies of the working human brain. Reviews of Modern Physics, 65(2), 413–497. https://doi.org/10.1103/RevModPhys.65.413
- Hanulová, J., Davidson, D. J., & Indefrey, P. (2011). Where does the delay in L2 picture naming come from? Psycholinguistic and neurocognitive evidence on second language word production. Language and Cognitive Processes, 26(7), 902–934. https://doi.org/10.1080/01690965.2010.509946
- Harley, T. A., & Bown, H. E. (1998). What causes a tip-of-the-tongue state? Evidence for lexical neighbourhood effects in speech production. British Journal of Psychology, 89(1), 151–174. https://doi.org/10.1111/j.2044-8295.1998.tb02677.x
- Hauk, O., Davis, M. H., Ford, M., Pulvermüller, F., & Marslen-Wilson, W. D. (2006). The time course of visual word recognition as revealed by linear regression analysis of ERP data. Neuroimage, 30(4), 1383–1400. https://doi.org/10.1016/j.neuroimage.2005.11.048
- Hebb, D. O. (1949). The organization of behavior; a neuropsychological theory. Wiley.
- Hickok, G. (2022). Handbook of clinical neurology. Handbook of Clinical Neurology, 185, 57–69. https://doi.org/10.1016/B978-0-12-823384-9.00003-7
- Hickok, G., Houde, J., & Rong, F. (2011). Sensorimotor integration in speech processing: Computational basis and neural organization. Neuron, 69(3), 407–422.
- Hultén, A., Vihla, M., Laine, M., & Salmelin, R. (2009). Accessing newly learned names and meanings in the native language. Human Brain Mapping, 30(3), 976–989. https://doi.org/10.1002/hbm.20561
- Indefrey, P. (2011). The spatial and temporal signatures of word production components: A critical update. Frontiers in Psychology, 2, 255. https://doi.org/10.3389/fpsyg.2011.00255
- Indefrey, P. (2016). On putative shortcomings and dangerous future avenues: response to Strijkers & Costa. Language, Cognition and Neuroscience, 31(4), 517–520. https://doi.org/10.1080/23273798.2015.1128554
- Indefrey, P., & Levelt, W. J. (2004). The spatial and temporal signatures of word production components. Cognition, 92(1-2), 101–144. https://doi.org/10.1016/j.cognition.2002.06.001
- Isik, L., Meyers, E. M., Leibo, J. Z., & Poggio, T. (2014). The dynamics of invariant object recognition in the human visual system. Journal of Neurophysiology, 111(1), 91–102. https://doi.org/10.1152/jn.00394.2013
- Jürgens, U. (2009). The neural control of vocalization in mammals: A review. Journal of Voice, 23(1), 1–10. https://doi.org/10.1016/j.jvoice.2007.07.005
- Kaiser, D., Oosterhof, N. N., & Peelen, M. V. (2016). The neural dynamics of attentional selection in natural scenes. The Journal of Neuroscience, 36(41), 10522–10528. https://doi.org/10.1523/JNEUROSCI.1385-16.2016
- Keuleers, E., Brysbaert, M., & New, B. (2010). SUBTLEX-NL: A new measure for Dutch word frequency based on film subtitles. Behavior Research Methods, 42(3), 643–650. https://doi.org/10.3758/BRM.42.3.643
- Kietzmann, T. C., Spoerer, C. J., Sörensen, L. K., Cichy, R. M., Hauk, O., & Kriegeskorte, N. (2019). Recurrence is required to capture the representational dynamics of the human visual system. Proceedings of the National Academy of Sciences, 116(43), 21854–21863. https://doi.org/10.1073/pnas.1905544116
- Kriegeskorte, N., Mur, M., & Bandettini, P. A. (2008). Representational similarity analysis – connecting the branches of systems neuroscience. Frontiers in Systems Neuroscience, 2(1), 4–5. https://doi.org/10.3389/neuro.01.016.2008
- Laaksonen, H., Kujala, J., Hultén, A., Liljeström, M., & Salmelin, R. (2012). MEG evoked responses and rhythmic activity provide spatiotemporally complementary measures of neural activity in language production. NeuroImage, 60(1), 29–36. https://doi.org/10.1016/j.neuroimage.2011.11.087
- Laganaro, M. (2017). Inter-study and inter-Individual consistency and variability of EEG/ERP microstate sequences in referential word production. Brain Topography, 30(6), 785–796. https://doi.org/10.1007/s10548-017-0580-0
- Levelt, W. J. (1989). Speaking: From intention to articulation. The MIT Press.
- Levelt, W. J. (1999). Models of word production. Trends in Cognitive Sciences, 3(6), 223–232. https://doi.org/10.1016/S1364-6613(99)01319-4
- Levelt, W. J., Praamstra, P., Meyer, A. S., Helenius, P., & Salmelin, R. (1998). An MEG study of picture naming. Journal of Cognitive Neuroscience, 10(5), 553–567. https://doi.org/10.1162/089892998562960
- Levelt, W. J., Roelofs, A., & Meyer, A. S. (1999). A theory of lexical access in speech production. Behavioral and Brain Sciences, 22(1), 1–38.
- Liljeström, M., Hultén, A., Parkkonen, L., & Salmelin, R. (2009). Comparing MEG and fMRI views to naming actions and objects. Human Brain Mapping, 30(6), 1845–1856. https://doi.org/10.1002/hbm.20785
- Liljeström, M., Stevenson, C., Kujala, J., & Salmelin, R. (2015). Task- and stimulus-related cortical networks in language production: Exploring similarity of MEG- and fMRI-derived functional connectivity. NeuroImage, 120, 75–87. https://doi.org/10.1016/j.neuroimage.2015.07.017
- Maess, B., Friederici, A. D., Damian, M., Meyer, A. S., & Levelt, W. J. (2002). Semantic category interference in overt picture naming: Sharpening current density localization by PCA. Journal of Cognitive Neuroscience, 14(3), 455–462. https://doi.org/10.1162/089892902317361967
- Maris, E., & Oostenveld, R. (2007). Nonparametric statistical testing of EEG- and MEG-data. Journal of Neuroscience Methods, 164(1), 177–190. https://doi.org/10.1016/j.jneumeth.2007.03.024
- Mesgarani, N., Cheung, C., Johnson, K., & Chang, E. F. (2014). Phonetic feature encoding in human superior temporal gyrus. Science, 343(6174), 1006–1010. https://doi.org/10.1126/science.1245994
- Miozzo, M., Pulvermüller, F., & Hauk, O. (2015). Early parallel activation of semantics and phonology in picture naming: Evidence from a multiple linear regression MEG study. Cerebral Cortex, 25(10), 3343–3355. https://doi.org/10.1093/cercor/bhu137
- Mitchell, T. M. (1997). Machine learning. McGraw-Hill.
- Munding, D., Dubarry, A. S., & Alario, F. X. (2016). On the cortical dynamics of word production: A review of the MEG evidence. Language, Cognition and Neuroscience, 31(4), 441–462. https://doi.org/10.1080/23273798.2015.1071857
- Oostenveld, R., Fries, P., Maris, E., & Schoffelen, J. M. (2011). FieldTrip: Open source software for advanced analysis of MEG, EEG, and invasive electrophysiological data. Computational Intelligence and Neuroscience, 2011. https://doi.org/10.1155/2011/156869
- Papoutsi, M., de Zwart, J. A., Jansma, J. M., Pickering, M. J., Bednar, J. A., & Horwitz, B. (2009). From phonemes to articulatory codes: An fMRI study of the role of Broca’s area in speech production. Cerebral Cortex, 19(9), 2156–2165. https://doi.org/10.1093/cercor/bhn239
- Price, C. J., Devlin, J. T., Moore, C. J., Morton, C., & Laird, A. R. (2005). Meta-analyses of object naming: Effect of baseline. Human Brain Mapping, 25(1), 70–82. https://doi.org/10.1002/hbm.20132
- Proklova, D., Kaiser, D., & Peelen, M. V. (2019). MEG sensor patterns reflect perceptual but not categorical similarity of animate and inanimate objects. NeuroImage, 193, 167–177. https://doi.org/10.1016/j.neuroimage.2019.03.028
- Rahman, R. A., & Sommer, W. (2003). Does phonological encoding in speech production always follow the retrieval of semantic knowledge? Electrophysiological evidence for parallel processing Cognitive Brain Research, 16(3), 372–382. https://doi.org/10.1016/S0926-6410(02)00305-1
- Rapp, B., & Goldrick, M. (2000). Discreteness and interactivity in spoken word production. Psychological Review, 107(3), 460. https://doi.org/10.1037/0033-295X.107.3.460
- Rogalsky, C., Basilakos, A., Rorden, C., Pillay, S., LaCroix, A. N., Keator, L., Mickelsen, S., Anderson, S. W., Love, T., Fridriksson, J., Binder, J., & Hickok, G. (2022). The neuroanatomy of speech processing: A large-scale lesion study. Journal of Cognitive Neuroscience, 34(8), 1355–1375.
- Roos, N. M., & Piai, V. (2020). Across-session consistency of context-driven language processing: A magnetoencephalography study. European Journal of Neuroscience, 52(5), 3457–3469. https://doi.org/10.1111/ejn.14785
- Rosenholtz, R., Li, Y., & Nakano, L. (2007). Measuring visual clutter. Journal of Vision, 7, 17.
- Salmelin, R., Hari, R., Lounasmaa, O. V., & Sams, M. (1994). Dynamics of brain activation during picture naming. Nature, 368(6470), 463–465. https://doi.org/10.1038/368463a0
- Schoffelen, J.-M., Hultén, A., Lam, N., Marquand, A. F., Uddén, J., & Hagoort, P. (2017). Frequency-specific directed interactions in the human brain network for language. Proceedings of the National Academy of Sciences of the United States of America, 114, 8083–8088. https://doi.org/10.1073/pnas.1703155114
- Simanova, I., Hagoort, P., Oostenveld, R., & Van Gerven, M. A. (2014). Modality-independent decoding of semantic information from the human brain. Cerebral Cortex, 24(2), 426–434. https://doi.org/10.1093/cercor/bhs324
- Simanova, I., Van Gerven, M., Oostenveld, R., & Hagoort, P. (2010). Identifying object categories from event-related EEG: toward decoding of conceptual representations. PLoS One, 5(12), e14465. https://doi.org/10.1371/journal.pone.0014465
- Sörös, P., Cornelissen, K., Laine, M., & Salmelin, R. (2003). Naming actions and objects: Cortical dynamics in healthy adults and in an anomic patient with a dissociation in action/object naming. Neuroimage, 19(4), 1787–1801. https://doi.org/10.1016/S1053-8119(03)00217-9
- Stokes, M. G., Wolff, M. J., & Spaak, E. (2015). Decoding rich spatial information with high temporal resolution. Trends in Cognitive Sciences, 19(11), 636–638. https://doi.org/10.1016/j.tics.2015.08.016
- Stolk, A., Todorovic, A., Schoffelen, J. M., & Oostenveld, R. (2013). Online and offline tools for head movement compensation in MEG. Neuroimage, 68, 39–48. https://doi.org/10.1016/j.neuroimage.2012.11.047
- Strijkers, K., & Costa, A. (2016). The cortical dynamics of speaking: Present shortcomings and future avenues. Language, Cognition and Neuroscience, 31(4), 484–503. https://doi.org/10.1080/23273798.2015.1120878
- Strijkers, K., Costa, A., & Pulvermüller, F. (2017). The cortical dynamics of speaking: Lexical and phonological knowledge simultaneously recruit the frontal and temporal cortex within 200 ms. NeuroImage, 163, 206–219. https://doi.org/10.1016/j.neuroimage.2017.09.041
- Teghipco, A., Okada, K., Murphy, E., & Hickok, G. (2022). Predictive coding and internal error correction in speech production. Neurobiology of Language, 1–77.
- Treder, M. S. (2020). MVPA-light: A classification and regression toolbox for multi-dimensional data. Frontiers in Neuroscience, 14, 289. https://doi.org/10.3389/fnins.2020.00289
- Tremblay, P., & Gracco, V. L. (2010). On the selection of words and oral motor responses: Evidence of a response-independent fronto-parietal network. Cortex, 46(1), 15–28. https://doi.org/10.1016/j.cortex.2009.03.003
- Tremblay, P., & Small, S. (2011). Motor response selection in overt sentence production: A functional MRI study. Frontiers in Psychology, 2. https://doi.org/10.3389/fpsyg.2011.00253
- Turken, A. U., & Dronkers, N. F. (2011). The neural architecture of the language comprehension network: Converging evidence from lesion and connectivity analyses. Frontiers in System Neuroscience, 5, 1. https://doi.org/10.3389/fnsys.2011.00001
- Van Essen, D. C., Drury, H. A., Dickson, J., Harwell, J., Hanlon, D., & Anderson, C. H. (2001). An integrated software suite for surface-based analyses of cerebral cortex. Journal of the American Medical Informatics Association, 8(5), 443–459. https://doi.org/10.1136/jamia.2001.0080443
- Van Veen, B. D., Van Drongelen, W., Yuchtman, M., & Suzuki, A. (1997). Localization of brain electrical activity via linearly constrained minimum variance spatial filtering. IEEE Transactions on Biomedical Engineering, 44(9), 867–880. https://doi.org/10.1109/10.623056
- Vihla, M., Laine, M., & Salmelin, R. (2006). Cortical dynamics of visual/semantic vs. phonological analysis in picture confrontation. Neuroimage, 33(2), 732–738. https://doi.org/10.1016/j.neuroimage.2006.06.040
- Vindiola, M., & Wolmetz, M. (2011). Mental encoding and neural decoding of abstract cognitive categories: A commentary and simulation. Neuroimage, 54(4), 2822–2827. https://doi.org/10.1016/j.neuroimage.2010.09.091
- Vitevitch, M. S. (2002). The influence of phonological similarity neighborhoods on speech production. Journal of Experimental Psychology: Learning, Memory, and Cognition, 28(4), 735. https://doi.org/10.1037/0278-7393.28.4.735
- Vitevitch, M. S., Luce, P. A., Pisoni, D. B., & Auer, E. T. (1999). Phonotactics, neighborhood activation, and lexical access for spoken words. Brain Lang, 68, 306–311. https://doi.org/10.1006/brln.1999.2116 pmid:10433774
- Wilson, S. M., Henry, M. L., Besbris, M., Ogar, J. M., Dronkers, N. F., & Jarrold, W., Miller B. L., Gorno-Tempini M.L. (2010) Connected speech production in three variants of primary progressive aphasia. Brain, 133(7), 2069–2088.