Abstract
The effects of waterbolus dimensions and configuration on the effective field size (EFS) of the Lucite cone applicator (LCA) for superficial hyperthermia are presented. The goal of the research is to develop guidelines which mark out a sub-set of optimal LCA-waterbolus set-ups. The effects of variations in (i) waterbolus thickness, (ii) waterbolus area, (iii) waterbolus length/width ratio and (iv) eccentric placement of the applicator have been investigated in an FDTD model study. The prominent effects are verified with IR thermography measurements. An optimal EFS value of 80 cm2 is found for waterbolus area of 200–400 cm2. A small (10 × 10 cm2) waterbolus area restricts the EFS to 25% of the optimal value. The sensitivity to sub-optimal waterbolus area and length/width ratio increases with waterbolus height. Eccentric placement of the LCA near the waterbolus edge reduces the EFS to up to 50% of the optimal value. The IR measurements confirm the model findings. Based on the results, the following guidelines for the clinical application of the LCA have been defined: the waterbolus (i) should extend the LCA aperture at least 2.5 cm, especially at the Lucite windows, and (ii) the height should not exceed 2 cm.
Introduction
Efforts directed at improvement of SAR distributions in superficial hyperthermia generally aim for a large effective field size (EFS) Citation[1], good spatial control and sufficient penetration depth. The design of the Lucite cone applicator (LCA) represented a major improvement of the EFS to aperture area ratio Citation[2]. In array configurations, the EFS of the LCAs proved to be contiguous, as opposed to arrays of conventional waveguide applicators Citation[3], Citation[4]. A clinical study revealed the strength of the LCA concept in terms of temperature distributions: higher (+0.3°C) invasively measured temperatures and virtually no average temperature differences (<0.05°C) between the central area and periphery under the antennae Citation[5].
In applicator systems for superficial hyperthermia, the waterbolus is used to control skin temperature and to improve coupling between the electromagnetic applicators and tissue. Although the waterbolus is an essential part of the complete hyperthermia set-up, its influence on the resulting SAR distribution and the final performance of the EM-applicator generally receives limited attention. In their paper describing the LCA, Van Rhoon et al. Citation[2] already noted the potential effect of waterbolus size and shape on the resulting SAR distribution. Their measurements indicated the possibility that advantages of the LCA may be counteracted by the application of an unfavourable waterbolus configuration. The authors indicated the need to further investigate the effects of waterbolus size and shape in a parametric study.
In order to assess quality assurance guidelines for the clinical application of superficial hyperthermia, the FDTD method is exploited to investigate the effect of waterbolus size and shape on the EFS of the Lucite cone applicator. In addition, for the key waterbolus parameters, model output is collated with IR measurements. In this paper it is demonstrated that, not only a proper applicator design, but also the waterbolus configuration is one of the key factors determining the quality of a superficial hyperthermia treatment.
Materials and methods
Lucite cone applicator
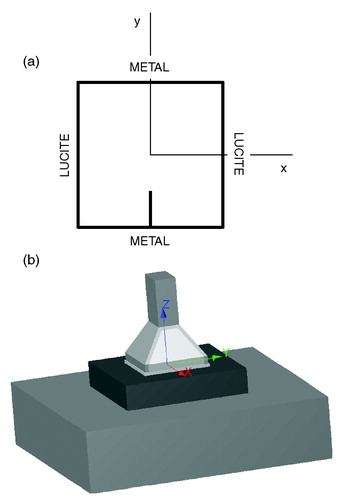
The Lucite cone applicator is a water-filled waveguide applicator operating in TE10 mode at 433 MHz. The inner dimensions of the LCA horn aperture are 10 × 10 cm2. The LCA, which is an evolution of the conventional water-filled waveguide applicator, uses two distinctive features to realize an EFS to radiating aperture ratio of up to 0.9: (i) the diverging sidewalls of the horn which are parallel to the E-field are replaced by Lucite and (ii) a PVC cone is placed in the centre of the aperture. The design and the performance of the LCA has been reported in detail in the literature Citation[2–4]. A schematic top-view of the LCA is given in ; depicts a 3-D representation of the LCA.
Figure 1. (a) Schematic representation of the LCA, showing the footprint of the antenna, the orientation of the feeding pin and the lucite and brass sides of the horn aperture. (b) Configuration of the model: Lucite cone applicator, waterbolus and planar muscle-equivalent phantom.
Waterbolus parameters
The waterbolus is not an integral part of the LCA. Waterboli are available in several dimensions. This means that in clinical practice any combination of applicators and waterbolus may be applied.
Numerical calculations are carried out to study the effect of three parameters: (i) the waterbolus size; (ii) the waterbolus aspect ratio, defined as the ratio between dimensions parallel and perpendicular to the E-field; and (iii) an eccentric placement of the applicator onto the waterbolus. The waterbolus size comprises both thickness and area. The height was varied between 0 and 4 cm, to reflect the clinical range of the boli applied in the clinic. The area range encompasses the area of the boli applied in the clinic. Non-square waterboli (aspect ratio ≠ 1) were studied to take into account effects associated with the Lucite windows. Eccentric placement is relevant because in practical LCA array configurations applicators may touch the outer edge of the waterbolus. For these applicators the extent of the waterbolus is different at all sides.
All models consist of a Lucite cone applicator (LCA), a brick-shaped waterbolus and a 40 × 40 × 10 cm3 muscle-equivalent tissue phantom, as shown in . The exact dimensions and alignment of the waterbolus vary with the parameter under study:
Waterbolus size: assumes a square waterbolus area, ranging from the aperture size of the LCA horn (10 × 10 cm2) to the extent of the muscle phantom (40 × 40 cm2). The waterbolus is placed centrally under the LCA. Waterbolus height is 5, 10, 20 or 40 mm.
Waterbolus aspect ratio: assumes a fixed waterbolus area of 250 or 500 cm2. The aspect ratio (AR), i.e. the ratio of the waterbolus length and width: AR = L⊥E/L||E is set to 2/5, 2/4, 2/3, 2/2, 3/2, 4/2 and 5/2. The waterbolus is placed centrally under the LCA. Waterbolus height is 5, 10, 20 or 40 mm.
Eccentric placement: assumes a waterbolus area of 20 × 20 cm2 and a height of 10, 20 or 40 mm. Starting from a configuration where the centre of the waterbolus is aligned with the centre of the LCA, the waterbolus is shifted 0, 25 or 50 mm parallel and/or perpendicular to the direction of the E-field.
FDTD model
The Finite Difference Time Domain (FDTD) method is used to calculate the electromagnetic energy deposition pattern. All simulations are performed with the SEMCAD FDTD simulation package (Schmid & Partner Engineering AG, Zürich, Switzerland). Using the solid modelling kernel of SEMCAD, the LCA, waterbolus and muscle phantom are implemented with their exact dimensions. As the PVC cone and the Lucite and brass walls of the LCA horn are not conformed to the rectangular grid, staircasing effects are inevitable. However, the discretized models use a non-uniform mesh, allowing for local refinement. Moreover, a comparison of the current staircased model with an earlier split-cell implementation of the LCA Citation[6] shows only marginal differences in the predicted SAR pattern (data not shown). Within the LCA volume, the grid step is restricted to 2 mm in all directions. Furthermore, the grid is refined at the boundaries of the source pin. Within the computational domain, the grid step varies between 1 and 10 mm, with a grading ratio of 1.5. The dimensions of the discretized model vary with the configuration; however, the average model consists of 1.5 million cells. The dielectric properties of the materials are listed in . A hard source between the wall of the waveguide and the source pin excites the E-field. The computational domain is terminated with Mur 2nd order boundary conditions.
Table I. Dielectric parameters used in the FDTD simulations.
Experimental verification
For a selection of waterbolus configurations, the SAR distribution is measured at a 1 cm depth in a 50 × 50 × 10 cm3 muscle-equivalent split phantom Citation[7]. Gelatinous agar waterboli are composed of 87.8 weight% de-ionized water, 9.8 weight% formaldehyde solution (4%) and 2.4 weight% agar and cut to a brick-shape. The experiments include the parameters waterbolus size and eccentric placement of the applicator. The effect of waterbolus size is measured for areas of 10 × 10, 15 × 15, 20 × 20 and 30 × 30 cm2 and thicknesses of 8, 20 and 36 mm. The effect of eccentric placement is measured with a 20 × 20 × 4 cm3 waterbolus.
A net power of 200 W is applied to the applicator during 30 s and the heating pattern is recorded with a TVS-600 infrared camera (Nippon Avionics Co. Ltd., Japan), within 10 s after power-off. A thermographic picture taken shortly before power-on is subtracted from the measured heating pattern, in order to correct for inhomogeneities of the phantom surface temperatures and for reflections of heat sources in the phantom PVC foil cover. Another IR picture, taken during power-on, allows reconstruction of the exact position of the LCA within the image. Furthermore, measurement noise is filtered out with a 2D low-pass FIR filter, before normalizing the heating pattern and calculating the EFS.
Parameter evaluation
The effective field size (EFS) Citation[1] is used as a quantitative measure for the evaluation and comparison of the different waterbolus configurations.
Results
FDTD parametric study
Waterbolus size
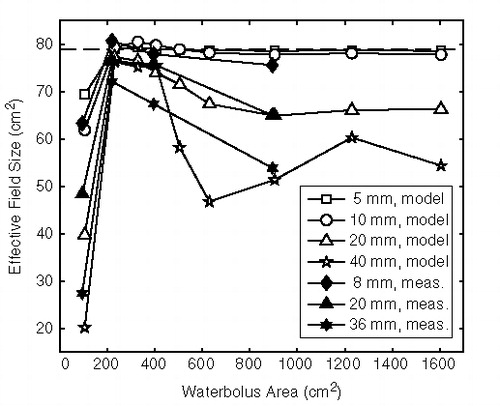
shows the predicted EFS for waterbolus dimensions ranging from 10 × 10 to 40 × 40 cm2 and bolus heights of 5, 10, 20 and 40 mm. For comparison, the predicted EFS of the LCA without waterbolus is 79 cm2. It is found that the sensitivity to waterbolus area increases with waterbolus thickness. All thicknesses show an optimum EFS at areas between 200 and 400 cm2. A waterbolus having the size of the LCA aperture (100 cm2) results in a drastic reduction of the EFS, that can be as high as 75% in the case of the 40 mm thick bolus.
Figure 2. Effective field size as a function of square waterbolus area and waterbolus height. Results from measurements (black markers) and FDTD model (white markers). The dotted line indicates the calculated EFS in the case where no waterbolus is used.
Waterbolus aspect ratio
shows the predicted EFS as a function of aspect ratio for waterbolus areas of 250 () and 500 cm2 (). For a waterbolus area of 250 cm2 and an AR of 2/5, the long sides of the waterbolus touch the Lucite windows of the LCA horn. This leads to reduced EFS values for all waterbolus heights. When the waterbolus edges touch the brass sides of the horn (AR = 5/2), the reduction of the EFS is less pronounced.
Figure 3. Effective field size as a function of waterbolus aspect ratio, for a bolus area of (a) 250 cm2 and (b) 500 cm2. Waterbolus height varies from 5 to 40 mm. The grey rectangles depict the extent of the waterboli relative to the LCA footprint (black icon).
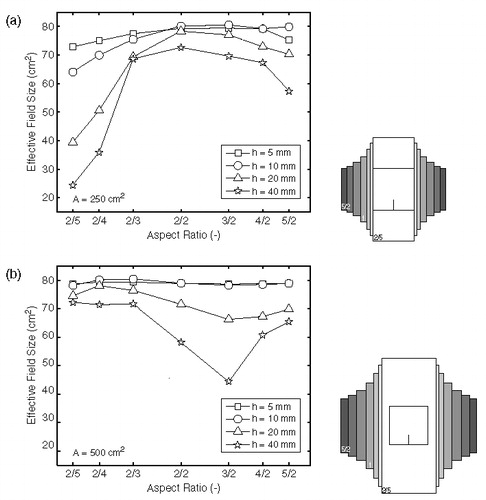
The results for a waterbolus area of 500 cm2 show that, for the smaller waterbolus heights, the EFS value is not sensitive to changes in AR. Apparently, the EFS is influenced more by the absolute distance to the LCA edges than by the AR itself; an assumption that will be confirmed in the next paragraph. Furthermore, the thicker waterbolus layers are more prone to the effect of different ARs.
Eccentric placement of the applicator
The effect of a waterbolus shift parallel or perpendicular to the direction of the E-field for bolus heights of 10, 20 and 40 mm is depicted in and , respectively. shows the relative SAR pattern at 1 cm depth for a waterbolus shift parallel and/or perpendicular to the direction of the E-field, for a bolus height of 40 mm. The diminishing of the EFS is most prominent for a thick (20–40 mm) waterbolus, as is also demonstrated in . From and it is clear that a shift of the waterbolus edge towards the brass wall of the applicator horn does not affect the normalized SAR pattern or the EFS appreciably. A shift of the waterbolus edge towards the Lucite windows of the LCA, however, clearly affects the normalized SAR distribution: when the edge of the bolus (nearly) touches the Lucite window, the typical elliptic 50% SAR/SARmax contour is reduced to a discoid shape, reducing the EFS value severily, see .
Figure 4. Effective field size as a function of distance to the waterbolus edge: effect of waterbolus shift in (a) x-direction (perpendicular to the E-field; bolus shifts towards Lucite window) and (b) y-direction (parallel to the E-field; bolus shifts towards the brass wall of the horn).
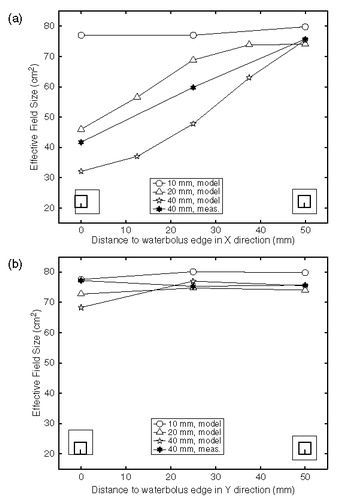
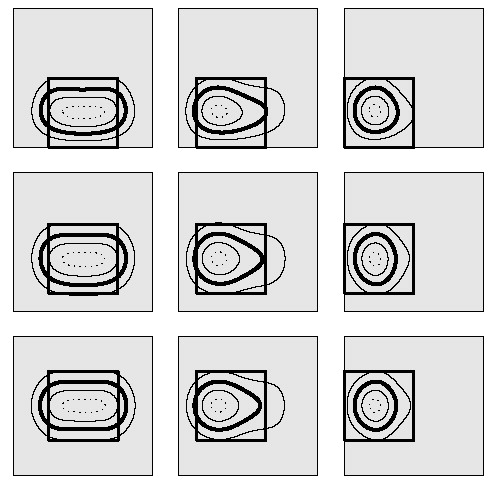
Figure 5. Calculated normalized SAR distributions at 1 cm depth in muscle-equivalent phantom illustrating the effect of waterbolus shifts of 0, 25 and 50 mm in two directions. Waterbolus dimensions: 20 × 20 × 4 cm3. The waterbolus area is depicted in grey; the square indicates the LCA footprint; the contours indicate the 25% (outer solid line), 50% (bold line), 75% (inner solid line) and 95% (dotted line) SAR/SARmax contours.
SAR measurements
Waterbolus size
The measured average EFS values (n = 2–5) for different waterbolus areas and heights are depicted in and listed in , together with the corresponding predicted EFS values. The measurements closely reflect the changes in EFS as predicted by the model, both qualitatively and quantitatively. The measured EFS of the LCA without waterbolus is 77.8 ± 5.4 cm2 (mean ± SD, n = 11). The EFS reaches the optimal value for a waterbolus area between 200 and 400 cm2. Smaller waterboli (10 × 10 cm2) restrict the EFS. The sensitivity for a sub-optimal waterbolus area increases with waterbolus height.
Table II. Measured and predicted effective field size values (cm2) for several waterbolus heights and areas.
Eccentric placement of the applicator
and show the measured effect of eccentric placement of the LCA, together with the modelled EFS values. depicts the measured (n = 3) and predicted 50% SAR/SARmax contours for waterbolus shifts in both directions. Like the models, the measurements show a negligible sensitivity to a bolus shift in y-direction. Also, a bolus shift in x-direction results in asymmetric and, finally, circular EFS contours for shifts of 25 and 50 mm, respectively, and consequently a reduction in EFS values. The effect of eccentric placement is more pronounced in the models than in measurements, both in terms of decrease in EFS values (, ) and squeezing of the EFS contours ().
Figure 6. Measured (thin lines) and predicted (bold lines) 50% SAR/SARmax contours for waterbolus shifts of 0, 25 and 50 mm in both x- and y-direction. The grey lines indicate the LCA centre and footprint. Waterbolus dimensions: 20 × 20 × 4 cm3.
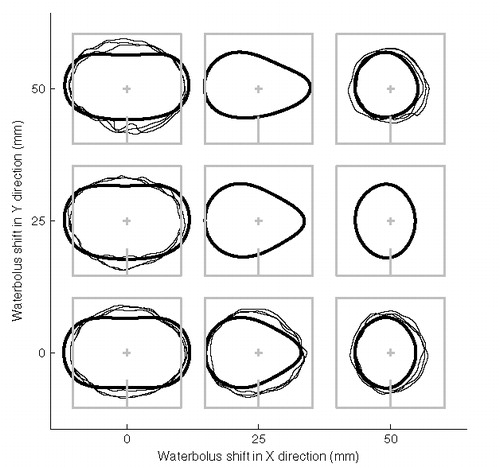
Table III. Measured and predicted EFS values (cm2) for waterbolus shifts in x- and y-direction. Waterbolus dimensions: 20 × 20 × 4 cm3. Measurement values: mean ± SD (cm2).
Discussion
So far, reports on the optimization of waterbolus size and shape have been limited. In the field of deep hyperthermia, Hornsleth Citation[8] related the bolus shape to a waterbolus edge effect causing local pain and to SAR performance parameters. In the field of superficial hyperthermia, several groups measured or calculated the effect of waterbolus thickness on the EFS, i.e. for the contact flexible micro-strip applicator (CFMA Citation[9]) and the dual concentric conductor (DCC Citation[10]) applicator. Gelvich and Mazokhin Citation[11] mathematically described spurious oscillations in the waterbolus and their disturbing effect on applicator SAR patterns. Hereafter, Neuman et al. Citation[12] investigated changes in SAR pattern with increasing bolus thickness and reported that their observations could be evidence of the volume oscillations described by Gelvich. Where most authors focus on a critical value of the bolus thickness, Van Rhoon et al. Citation[2] reported the effects of both waterbolus thickness and shape on the EFS of the LCA.
In contrast to the DCC and CFMA applicators, where the waterbolus is an integral part of the applicator system and its length and width are fixed, the LCA utilizes a separate waterbolus, offering more flexibility in the applicator-waterbolus configuration. At the same time, it poses the question of which range of waterbolus dimensions, shapes and applicator placement results in an optimal coupling between applicator and patient.
In this respect, the QA guidelines for ESHO protocols Citation[1] are under-sized. They mention that the presence of a bolus may cause significant changes to the EFS of an applicator and that the EFS recorded must be that corresponding to the clinical set-up. However, the LCA is used in a wide range of configurations, so a typical clinical set-up cannot be defined. At the same time, for the clinical application of a waterbolus, minimal restrictions with regard to waterbolus dimensions or applicator placement would be advantageous. Restrictions on thickness of the bolus layer can limit the ability to conform to anatomic features. Severe restrictions to waterbolus shape or applicator placement will not always be feasible in the clinic or at least hamper the placement of an array of applicators. Therefore, this study aimed for a minimal set of guidelines that guarantee an acceptable SAR coverage, while leaving freedom of action for the hyperthermia technician.
The results presented in this work partially agree with earlier measurements by Van Rhoon et al. Citation[2], who measured the influence of various thicknesses (0–3 cm) and two sizes (18 × 18 and 25 × 30 cm2) of the waterbolus on the resulting EFS. Both their work and the current models and measurements observe the highest EFS scores for a waterbolus area of ∼18 × 18 cm2. However, other trends delineated in their work are not reflected in the current measurements nor in the model predictions. In contrast to results published in this paper, they found a low sensitivity to waterbolus height for a large (25 × 30 cm2) waterbolus area and an EFS value measured with no waterbolus, which is significantly lower than the optimal EFS score. The quantitative differences in reported EFS values are remarkable: for example, the earlier report found an overall maximum EFS = 103 cm2, whereas in the current set of measurements none of the repetitions exceeds 85.3 cm2. The following factors may contribute to the observed differences:
The properties of the muscle-equivalent phantom differ between batches, even when they have been produced following the same recipe Citation[7] and protocol. The differences may be ascribed to the fact that some ingredients (e.g. gelling agent, PE powder) were obtained from other manufacturers over the years and to ageing effects. One cannot make a direct comparison of the phantom properties, as the actual permittivity and conductivity of the phantom tissue was not measured. However, to quantify the differences between phantoms, the EFS was measured of an LCA placed directly on top of a phantom (no waterbolus) from a recent batch and from a previous batch. The comparison revealed a significant difference between two sets of phantom layers: 73.5 ± 2.6 (n = 6) vs. 82.8 ± 1.8 (n = 5) cm2 (mean ± SD). Apparently, variations between batches account for at least 10% of the differences in EFS.
The resolution of the TVS-600 infrared camera utilized in this work (236 × 320 pixels) is much higher than that of the former AGA thermograph (75 × 75 pixels Citation[13]). The higher resolution permits a more accurate assessment of the EFS. Further, it allows for image processing steps that were not applied in the earlier work, e.g. low-pass filtering to suppress noise, and translation of pixels to millimetres by reconstructing the exact applicator position within the image.
As the TVS-600 is more sensitive than the AGA thermograph, the duration of the power pulse in this study was considerably shorter than in the earlier work (30 s at 200 W vs. up to 90 s at 100–300 W). Also, the time to measurement was shorter (10 s vs. 15 s). In the current research, the shorter power-pulse and time to measurement restrict the relative error in the half-width at half-power to <1% Citation[14]. On the other hand, the previous research violated the ESHO QA guidelines with respect to length of the power pulse.
The LCA utilized in this work has been in clinical use for several years now and there has been a slight modification of the waveguide back plane. Possibly this resulted in degraded applicator performance. However, the QA programme does not provide an indication of the level of degradation in time.
In short, the measurement method has improved, compared to the earlier measurements. Moreover, the current measurements are in line with the model predictions. However, given the fact that the LCA prototype, AGA thermograph and old phantoms were discarded, it is impossible to determine the relative contribution of the factors contributing to the differences in the results.
The role of spurious oscillations in the effects of waterbolus size and shape presented in this paper is not evident. According to Gelvich and Mazokhin Citation[11], a water-filled horn applicator, like the LCA, cannot stimulate oscillations in the waterbolus.
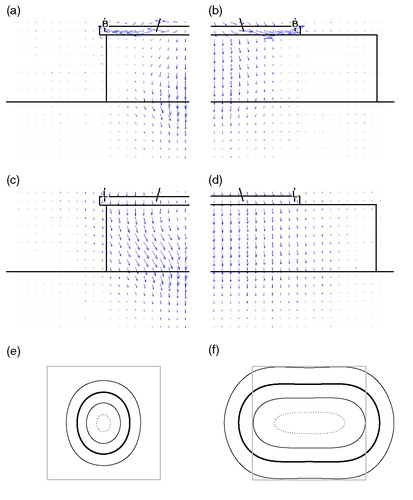
Although spurious oscillations should not be fully excluded, the predominant effects described in this paper, restricted EFS values for set-ups where the waterbolus edge is close to the horn aperture, can be explained from the design of the LCA. The Lucite windows allow flaring of the E-field, which results in a large EFS-to-aperture ratio. In the absence of a water volume in the periphery of the LCA aperture, flaring of the E-field is hampered, resulting in focusing of the SAR distribution: the SAR distribution is then similar to that of a conventional waveguide applicator. The Poynting vector plots in illustrate this behaviour: for a 20 × 20 × 4 cm3 bolus, the power flow in the waterbolus is directed in the z-direction, whereas for the smaller 10 × 10 × 4 cm3 bolus, the Poynting vectors are directed towards the centre of the LCA footprint, resulting in an accumulation of SAR at the centre and a circular 50% SAR/SARmax contour ().
Figure 7. Illustration of SAR focusing when a small waterbolus is applied. Figures on the left (a, c, e) relate to a 10 × 10 × 4 cm3 waterbolus, on the right (b, d, f) to a 20 × 20 × 4 cm3 waterbolus. (a–d) depict Poynting vectors in the principal antenna planes: (a, b) YZ half-plane, parallel to, and (c, d) XZ half-plane, perpendicular to the E-field. L = lucite sidewall; B = brass sidewall. (e, f) the corresponding normalized SAR distributions at 1 cm depth: LCA footprint (grey) and 25% (thin), 50% (bold), 75% (thin) and 95% (dotted) contours.
In this parametric study, the brick-shape of the waterbolus is a premise. The basic, rectangular shape favours simplicity of the model and facilitates interpretation of the waterbolus parameters under study. In the clinical situation, however, the shape of the waterbolus is more complicated. A separate study comparing SAR patterns of more realistic, non-rectangular waterbolus edges to those of a brick-shaped bolus is currently performed to determine the necessity of implementing a more complex waterbolus shape in treatment planning. So far, the brick-shape is considered appropriate for the deduction of QA guidelines for the application of the waterbolus.
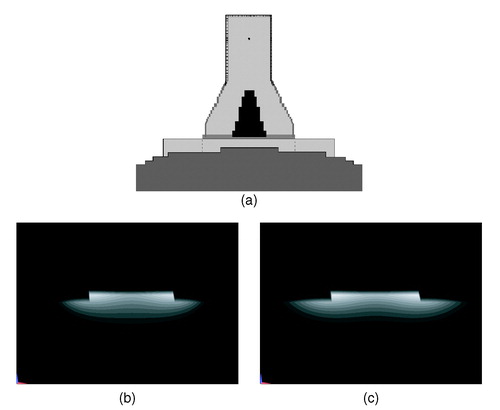
The flat phantom set-up prescribed by the ESHO QA guidelines Citation[1] that was adopted in this work basically provides a standard for the assessment of applicator performance in the lab. While it is suitable for the characterization of applicator performance and for inter-applicator comparisons, the clinical relevance of this shape is limited. In this respect, model investigations offer more opportunities to investigate applicator performance than experiments. As an example, the model results in show that the waterbolus guidelines proposed in this paper also hold in a non-flat tissue configuration. This paper demonstrates that electromagnetic simulation is a useful tool for the systematic investigation of performance parameters of superficial hyperthermia applicators. A logical next stept is to exploit models to systematically investigate energy distributions in heterogeneous tissue configurations and antropomorphic shapes, which better reflect clinical practice.
Figure 8. Example of the effect of the waterbolus on the SAR distribution in a non-flat shape. (a) Configuration: a small (10 × 10 cm2, dotted) and a larger (20 × 20 cm2) waterbolus are applied on a sphere (staircased). (b, c) Normalized SAR on a linear scale in the y = 0 cross-section (perpendicular to the E-field). The smaller waterbolus (b) restricts the SAR distribution as compared to the larger bolus (c).
Conclusions
The effect of waterbolus size, shape and asymmetric configuration on the EFS of the LCA has been assessed in an FDTD model study. The model output has been verified against IR thermographic measurements. Two major trends can be deduced from the measurements and modelling results presented in this paper. First, the EFS is restricted in cases where a waterbolus edge is close to the LCA aperture. This effect is more obvious at the Lucite windows of the LCA than it is at the metallic sides of the horn aperture. Secondly, restrictions in EFS are more evident with increasing waterbolus height. From the modelling results and the measurements, a minimal set of guidelines were deduced that are clinically feasible and ensure optimal (>0.9 · EFSmax) LCA performance: (i) the waterbolus edge should extend the LCA aperture in all directions and at least 2.5 cm at the Lucite windows and (ii) the waterbolus height should not exceed 2 cm.
Acknowledgements
This project is financially supported by the Dutch Cancer Society, ‘Koningin Wilhelmina Fonds’, grant DDHK 2001-2362.
Related Research Data
References
- Hand JW, Lagendijk JJW, Bach Andersen J, Bolomey JC. Quality assurance guidelines for ESHO protocols. International Journal of Hyperthermia 1989; 5: 421–428
- Van Rhoon GC, Rietveld PJM, Van der Zee J. A 433 MHz Lucite cone waveguide applicator for superficial hyperthermia. International Journal of Hyperthermia 1998; 14: 13–27
- Rietveld PJM, Lumori MLD, Hand JW, Prior MV, Van der Zee J, Van Rhoon GC. Effectiveness of the Gaussian beam model in predicting SAR distributions from the lucite cone applicator. International Journal of Hyperthermia 1998; 14: 293–308
- Rietveld PJM, Lumori MLD, Van der Zee J, Van Rhoon GC. Quantitative evaluation of 2 × 2 arrays of Lucite cone applicators in flat layered phantoms using Gaussian-beam-predicted and thermographically measured SAR distributions. Physics, Medicine & Biology 1998; 43: 2207–2220
- Rietveld PJM, Van Putten WLJ, Van der Zee J, Van Rhoon GC. Comparison of the clinical effectiveness of the 433 MHz lucite cone applicator with that of a conventional waveguide applicator in applicatons of superficial hyperthermia. International Journl of Radiation Oncology, Biology & Physics 1999; 43: 681–687
- Samaras T, Rietveld PJM, Van Rhoon GC. Effectiveness of FDTD in predicting SAR distributions from the Lucite cone applicator. IEEE Transactions in Microwave Theory & Technology 2000; 48: 2059–2063
- Guy AW. Analysis of electromagnetic fields induced in biological tissues by thermographic studies on equivalent phantom models. IEEE Transactions in Microwave Theory & Technology 1971; 19: 205–214
- Hornsleth SN. Radiofrequency regional hyperthermia [dissertation]. Aalborg University, Denmark 1996
- Lamaitre G, Van Dijk JDP, Gelvich EA, Wiersma J, Schneider DJ. SAR characteristics of three types of contact flexible microstrip applicators for superficial hyperthermia. International Journal of Hyperthermia 1996; 12: 255–269
- Rosetto F, Diederich CJ, Stauffer PR. Thermal and SAR characterization of multielement dual concentric conductor microwave applicators for hyperthermia, a theoretical investigation. Medical Physics 2000; 27: 745–753
- Gelvich EA, Mazokhin VN. Resonance effects in applicator water boluses and their influence on SAR distribution patterns. International Journal of Hyperthermia 2000; 16: 113–128
- Neuman DG, Stauffer PR, Jacobsen S, Rosetto F. SAR pattern perturbations from resonance effects in water bolus layers used with superficial microwave hyperthermia applicators. International Journal of Hyperthermia 2002; 18: 180–193
- Van Deursen JPB, Van Rhoon GC. A low-cost interface for upgrading an AGA thermograph. Biomedical Measurements in Information Control 1987; 2: 10–13
- Samaras T, Van Rhoon GC, Sahalos JN. Theoretical investigation of measurement procedures for the quality assurance of superficial hyperthermia applicators. International Journal of Hyperthermia 2002; 18: 416–425