Abstract
Introduction: Tissue type assignment, i.e. differentiation tumour from normal tissue, is a normal procedure for interstitial thermometry. In our department, thermometry in patients with a tumour in the lower pelvis is usually restricted to the intra-luminal tracks. It is unknown whether discrimination between normal and tumour tissue is relevant for deep regional hyperthermia thermal dosimetry using only intra-luminal tumour contact and tumour adjacent thermometry. This study has analysed the acquired temperature data in order to answer this question.
Patients and methods: Seventy-five patients with locally advanced cervical carcinoma were selected randomly. Patients were treated with a two or three modality combination, i.e. radiotherapy +hyperthermia or radiotherapy + hyperthermia + chemotherapy from October 1997 to September 2003. The first 100 hyperthermia treatments fulfilling the only selection criterion: no displacement of the thermometry catheter along the insertion length during the treatment, were included in the study, resulting in 43 patients with one-to-five treatments/patient (median 2). Using RHyThM (Rotterdam Hyperthermia Thermal Modulator), for each single treatment tissue type, was defined on the basis of information given by a CT scan in radiotherapy position. A step change in the slope of the profile of the first temperature map was identified to verify the insertion length of the catheter.
Results: The average T50 (median temperature) in bladder tumour indicative, vagina tumour contact and rectum tumour indicative was 40.9 ± 0.9°C, 39.7 ± 0.9°C and 40.6 ± 0.8°C, respectively. The average normal tissue T50 in bladder, vagina and rectum was 40.8 ± 0.9°C, 40.1 ± 0.9°C and 40.7 ± 0.8°C, respectively. The differences between bladder tumour indicative T50 and bladder normal tissue T50 and also between vagina tumour contact T50 and vagina normal tissue T50 were significant ( p = 0.0001). No statistical difference was found between rectum tumour indicative T50 and rectum normal tissue T50.
Conclusion: At present the cause of the temperature difference is not known. However, as the difference between tumour (indicative/contact) and normal tissue is very small and considering also the inaccuracy in the tissue type assignment it can be stated that this study does not provide sufficient evidence to conclude that the statistical difference has clinical relevance. Therefore, it was concluded that at this time there is no need to differentiate between normal and tumour tissue in intra-luminal thermometry.
Introduction
To facilitate analysis of hyperthermia treatment data produced by the previous generations of the BSD2000/3D system, which operate on a PDOS machine, a program called RHyThM (Rotterdam Hyperthermia Thermal Modulator) has been created. The details of RHyThM have been described extensively elsewhere Citation[1]. One of the features of RHyThM is that it connects the tissue type assignment with the thermal data. Tissue type assignment, i.e. discriminating tumour from normal tissue, is a normal procedure for interstitial thermometry. In our department, thermometry in patients with a tumour in the lower pelvis is mostly limited to intra-luminal sites, as indicated by the ESHO guidelines Citation[2]. Commonly, the measured temperatures during deep regional hyperthermia are distinguished into tumour and normal tissue data, without asking the critical question whether differentiation between normal and tumour tissue for intra-luminal thermometry during deep regional hyperthermia is necessary. The results of previous thermal data analysis, on 104 hyperthermia treatments (of 22 patients), do not support the need to differentiate between a thermal dose parameter assigned as normal tissue, tumour indicative, tumour contact or all lumen Citation[3]. Thus, the hypothesis is that tissue type assignment does not provide more relevant information on intra-luminal temperature distribution. To answer the question mentioned we studied the results of thermal data analysis of 100 treatments of patients with advanced cervical cancer, selected specifically to have constant thermal mapping temperature data, i.e. no displacement of thermometry catheters along the intraluminal track during the hyperthermia treatment session.
Patients and methods
Patient population
This study planned to use a dataset including 100 hyperthermia treatments. The database consists of hyperthermia treatment data of all 320 patients with uterine cervical cancer, who have been treated from October 1997 to September 2003. Patients were treated by hyperthermia in addition to radiotherapy or radiotherapy plus chemotherapy. Seventy-five patients were selected by random number drawing and the obtained temperature mapping data assessed on stability of thermal probe position (see below). Treatment selection was completed after 43 patients, when the required dataset of 100 treatments was available.
Data processing
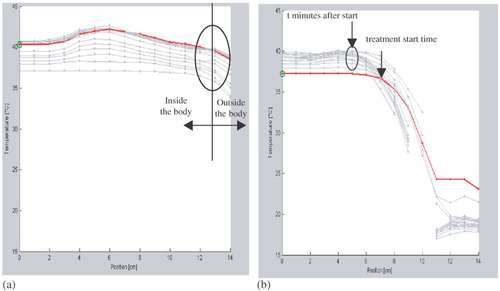
First, PDOS formatted hyperthermia treatment data, generated by the BSD2000/3D, was transferred to MSDOS. Secondly, treatments with duration of 90 min were selected. Thirdly, the MSDOS hyperthermia treatment data was imported in the RHyThM programme and the first 100 eligible treatments were included. The only selection criterion was: no displacement of thermometry catheter along the insertion length during 90 min of the treatment (see ). In the next step we identified a step change in the profile of the first temperature map to verify the insertion length of the thermometry catheter and location of the transition between the in- and outside of the body, as reported by the hyperthermia technician. If necessary the insertion length was adapted to match with the steep temperature gradient. The measurement points that were affected by the cooling water bolus were considered outside the body. Finally, for each treatment the tissue type was defined based on information from a CT scan in radiotherapy position.
Figure 1. Two typical thermal maps provided by RHyThM: (a) A thermal map, as accepted for the study, with no shift in transition between in- and out side the body during whole of the treatment session. (b) A thermal map with shift in transition between in- and outside the body, not accepted. The graph shows that the start position of the steep temperature decay moves over time towards the left.
Tissue type assignment
The tissue type assignment discriminates between normal tissue and tumour contact or tumour indicative. Tumour contact is defined as close contact of the closed-tip thermometry catheter with the tumour; tumour indicative is defined as the position of the closed-tip thermometry catheter in the same transverse plane as the tumour, but not in contact (see ) Citation[4]. The procedure of tissue type assignment is as follows: (1) Determination of the tumour location in cranio-caudal direction in relation to bladder neck, vaginal introitus or anus by means of CT scan by the hyperthermia physician; (2) Measurement of catheter insertion length performed by the hyperthermia technician; and (3) Verification of the insertion length by the site of step decrease in temperature, indicating the site when the catheter leaves the body.
Figure 2. Intra-luminal temperature measurement. TC (tumour contact) is defined as close contact of the thermometry catheter with tumour; TI (tumour indicative) is defined as the position of the thermometry catheter ventral or dorsal of the tumour in the same transverse plane as the tumour but not in contact. Figure copied from Wielheesen et al. Citation[4], with permission of the author.
![Figure 2. Intra-luminal temperature measurement. TC (tumour contact) is defined as close contact of the thermometry catheter with tumour; TI (tumour indicative) is defined as the position of the thermometry catheter ventral or dorsal of the tumour in the same transverse plane as the tumour but not in contact. Figure copied from Wielheesen et al. Citation[4], with permission of the author.](/cms/asset/9a725176-4ddb-40d4-aae8-b709db7bbdd6/ihyt_a_177272_f0002_b.jpg)
Radiotherapy, hyperthermia and chemotherapy
The patients received external beam radiotherapy to the whole pelvis (46–50.4 Gy, five fractions of 1.8 or 2 Gy per week) and additional brachytherapy (17 Gy, two fractions of 8.5 Gy per week). For those patients who received chemotherapy, it consisted of four-to-five courses of weekly Cisplatin (40 mg m−2 i.v.) with standard hydration and anti-emetic pre-medication. Regional whole pelvis hyperthermia was delivered once weekly, four or five sessions, in the period of radiotherapy. Hyperthermia was started 1 to maximally 6 h after the radiotherapy. Hyperthermia was performed using different configurations of the BSD2000 annular phased array system with the Quad amplifier connected to the Sigma-60 applicator and the BSD2000-3D system using the 12 channel Dodek solid state amplifier connected to the Sigma-60 or the Sigma-Eye applicator (BSD Medical Corporation, Salt Lake City, Utah, USA) Citation[5]. Hyperthermia was carried out by the institutional protocol of the Daniel den Hoed Cancer Center-Erasmus MC, in Rotterdam as follows. The initial RF-power was 400 W. RF-power output to the applicator was increased until the patient's tolerance threshold was reached. SAR steering was applied by changing phase and amplitude settings with the aim to achieve a more homogenous temperature distribution, to reduce power-limiting hot spots (i.e. normal tissue temperature > 43°C or pain complaints of the patient) and to maintain or increase the temperature in the target volume. The temperature of the applicator's water bolus was maintained at 20°C. The increase in systemic temperature was limited by cooling measures: undressing, fan and air-conditioning, wet towels, ice packs, cooling bolus placed in the neck, etc.
Thermometry
Thermometry was performed using thermistors with high impedance leads (radio-frequency-inert Bowman probes) Citation[6] to assess real time temperature reading. Prior to the treatment session, closed-tip thermometry catheters (William Cook Europe, P5.0-CE-50-SFT-NS-0, Denmark) were placed in the urinary bladder lumen, rectum, vagina and at the perineal skin. After catheter placement, the intra-luminal depth was documented. Insertion length of the thermometry catheter was measured manually using a standard calliper by the hyperthermia technician. Temperature mapping was performed at 5 min intervals along the length of the thermometry catheter in 1 cm increments with a maximum mapping length of 14 cm. Accuracy of the temperature measurement was ±0.1°C. Systemic (oral) temperature was measured with regular intervals, i.e. just before start of treatment, at 15, 30, 60 min and just before the end of the treatment session.
Statistical analysis
The statistical analysis is based on the temperature readouts, as provided in the ASCII files by RHyThM. The analysis compared the temperature of the tumour indicative, in the bladder and rectum, or tumour contact in the vagina lumen, with normal tissue temperature of respective lumen. Descriptive and inferential statistical techniques were used in the comparison. The descriptive analysis was comprised of visualization of the data and calculation of summary statistics (mean, minimum, median, etc, see below) of the temperature distribution, i.e. normal tissue, tumour indicative and tumour contact, overall and separately by lumen. The following thermal dose parameters were calculated: Tmax, which is determined between start and end of the treatment, average of temperature (Tmean), T20, T50 and T90*, which are calculated between 30 min after treatment start time and end of the treatment (*: TX means the temperature which is exceeded by X% of all temperature readings). The Mann-Whitney test was used for inferences on the difference in only the median temperature (T50) between the tumour contact or tumour indicative and normal tissue. Potential error of tissue type assignment, which was performed manually, might affect the results. In order to investigate the sensitivity of ‘misassignment’ the tumour area was reassigned, i.e. the tumour contact/indicative area was artificially increased or decreased by one-to-two mapping positions. For reasons of non-representativeness all aforementioned descriptive and inferential analyses were repeated without the outer one and two mapping positions of each thermometry probe. STATA programme (version 8.2) was used for the statistical analysis.
Results
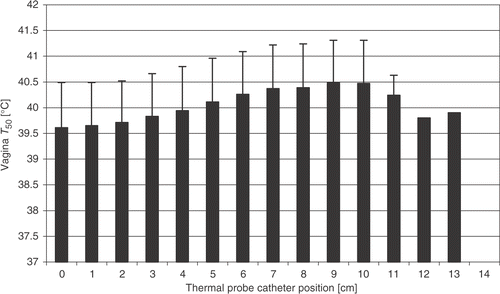
For the 100 selected treatments (one-to-five treatments/patient, median: 2) extracted from 43 patients’ treatment data, thermal mapping data was available for bladder lumen (97 treatments, 40 patients), vagina lumen (98 treatments, 41 patients) and for rectum lumen (99 treatments, 42 patients). In the vagina lumen tumour contact was indicated between positions 0–6 cm in 89% of the cases with a range of 0–11 cm. Position 0 cm represents the deepest point in the lumen. The average tumour contact position in the vagina lumen was from position 0–4.1 cm, SD 2 cm, with a minimum of position 0–1 cm and a maximum 0–11 cm. The number of temperature measurements in the vagina varied from 1–11. The average catheter insertion length in the vagina lumen was 8.8 cm, SD 1.6 cm, with a range of 6–14 cm. Average vagina all lumen T50 for all treatments was 39.9 ± 0.9°C. shows a profile of the average T50 for all treatments along the thermometry catheter probe in the vagina lumen.
Figure 3. Average vagina T50 value, for all treatments, vs. thermal probe catheter position. Position 0 cm represents the deepest point in the lumen.
shows an overview of average temperature indices, i.e. Tmean, T20, T50, T90 and maximum of Tmax (Tmax max) ± 1 SD in overall, in different tissue types and in different lumens. shows the average of the same temperature indices for normal tissue and tumour indicative or tumour contact in each lumen, i.e. bladder, vagina and rectum. The average temperature parameters of tumour and normal tissue show small differences. The vagina temperature indices are slightly lower than those of bladder and rectum. The differences between and for the same temperature indices per tissue type are due to a different analysis. Each result per tissue type in is the average of temperature indices for that tissue, i.e. normal tissue of three lumens, tumour indicative of two lumens and tumour contact of one lumen. Similarly, each result per lumen in is the average of two temperature indices for that lumen, i.e. normal tissue and tumour indicative or tumour contact. Meanwhile, the temperature index in always corresponds to a single lumen. Only the difference in tumour contact T50 or tumour indicative T50 vs. normal tissue T50 was tested statistically on a lumen-specific base, e.g. for bladder, vagina and rectum, separately. Significant differences were found between bladder tumour indicative T50 and bladder normal tissue T50 and also between vagina tumour contact T50 and vagina normal tissue T50 ( p = 0.0001). Sensitivity of the differences was evaluated by varying the outer one and two assigned mapping positions of each thermometry probe location. This did not affect the statistical significance of the differences. No statistical difference was found between rectum tumour indicative T50 and rectum normal tissue T50.
Table I. Average temperature values for Tmean, T20, T50, T90 and Tmax (maximum of Tmax) as obtained in the study. Numbers in parentheses (in°C) show 1 SD.
Table II. Average temperature values for Tmean, T20, T50, T90 and Tmax (maximum of Tmax) in different lumens. Numbers in parentheses (in°C) show 1 SD.
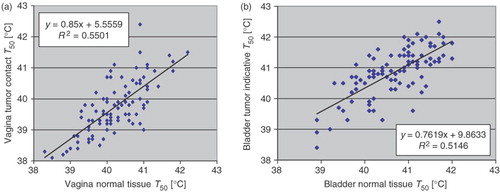
The relationship between normal tissue T50 and tumour contact T50 or tumour indicative T50 was assessed in the bladder, vagina and rectum. The results for vagina and bladder are shown in . As can be seen in , fair-to-good correlation exists between vagina tumour contact T50 and vagina normal tissue T50. Likewise, fair-to-good correlation exists between bladder tumour indicative T50 and bladder normal tissue T50 (). Similar results (not shown) are obtained for rectum temperatures.
Figure 4. (a) Vagina normal tissue T50 vs. vagina tumour contact T50, (b) Bladder normal tissue T50 vs. bladder tumour indicative T50.
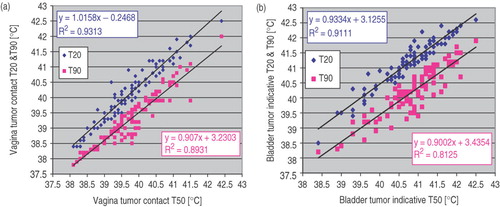
Furthermore, the relationship between T50 and T20 as well as T50 and T90 was assessed for tumour contact or tumour indicative in bladder, vagina and rectum. The result for vagina and bladder are demonstrated in . As demonstrates, strong correlation exists between vagina tumour contact T50 and vagina tumour contact T20 or T90. Analogous, strong correlation exists between bladder tumour indicative T50 and bladder tumour indicative T20 and/or T90 (). Similar results (not shown) are obtained for rectum temperatures.
Figure 5. (a) Vagina tumour contact T50 vs. vagina tumour contact T20 and T90, (b) Bladder tumour indicative T50 vs. bladder tumour indicative T20 and T90.
Discussion
During deep hyperthermia treatment, measurement of the actual temperature distribution in the tumour or adjacent tissue is important for the clinical evaluation of the treatment quality Citation[7]. Several clinical studies have shown a correlation between thermal dose (expressed as CEM43°CT90, Tmax, etc) and treatment outcome Citation[8–14]. In these usually retrospective studies, however, thermal dosimetry is in general characterized by a low number of temperature probes Citation[15–17]. In interstitial thermometry, discrimination between tumour and normal tissue is without discussion. When a patient has a tumour located in the lower pelvis in our department, thermometry is usually restricted to the intra-luminal tracks, which according to ESHO guidelines Citation[2] is an accepted procedure during hyperthermia treatment of cervical carcinomas. The question is whether differentiation between normal and tumour tissue for intra-luminal thermometry during deep regional hyperthermia is needed? The present study has investigated this question. The study shows () that there is no statistical difference between rectum normal tissue T50 and rectum tumour indicative T50. A statistical difference ( p = 0.0001) exists between T50 of vagina normal tissue, average 40.1 ± 0.9°C, and T50 of vagina tumour contact, average 39.7 ± 0.9°C, and also between T50 of bladder normal tissue, average 40.8 ± 0.9°C, and T50 of bladder tumour indicative, average 40.9 ± 0.9°C. The differences between these temperature indices are not, however, quantitatively similar, i.e. 0.4°C vs. 0.1°C, respectively. On the other hand, the statistically significant difference between average bladder normal tissue T50, 40.8 ± 0.9°C, and bladder tumour indicative T50, average 40.9 ± 0.9°C, is quantitatively, i.e. 0.1°C, equal with the difference between rectum normal tissue T50, average 40.7 ± 0.8°C, and rectum tumour indicative T50, average 40.6 ± 0.8°C, where the statistical analysis does not show a significant difference.
To explain these observations, it is pointed out that in a thermal data analysis with a very large amount of data such as the huge ASCII file data source of the present study, a very small difference can be easily detected in a statistical analysis. During the last 60 min of each hyperthermia treatment the number of registered temperature points in each lumen is in the range of 50–140 points (9–12 thermal maps and 6–12 points per thermal map). Thus, as estimation, the dataset of 100 treatments roughly includes 7000–14 000 temperature points per lumen. Therefore, the small difference between average normal tissue T50 and average tumour indicative T50 in bladder, i.e. 0.1°C, is statistically significant ( p = 0.0001).
We must consider, however, even if the difference is statistically significant, it may not be relevant. At best conditions in deep hyperthermia treatment the temperature is increased from 37 to 43°C, i.e. a temperature difference of 6°C. Although, a lower temperature increase such as the 3°C in this study, is more realistic. Assuming that a 10% dose difference can be considered relevant, this would indicate that only a temperature difference of more than 0.3°C between temperature indices is relevant for our hyperthermia treatment quality analysis. Hence, in authors' opinion, the 0.1°C difference between T50 of bladder normal tissue and bladder tumour indicative is not a relevant difference, whereas the difference between vagina normal tissue T50 and vagina tumour contact T50 (0.4°C) is ‘borderline’ relevant.
Additionally, one should consider errors in the tissue type assignment. Sources of errors in thermometry probe localization are as follows. (1) In this group of patients the CT scan was made in radiotherapy position, which differs from hyperthermia position; (2) The inaccuracy in the exact position of the reference points (bladder neck, vagina introitus and anus) as defined by CT and observed in the patient; (3) Measurement of catheter length inside the body. The errors due to manual measurement of thermal probe catheter length were investigated and a total inaccuracy was found of ±1 cm, where the systematic error was 0.35 cm and the random error was 0.6 cm (data not published); (4) The exact placement of the catheter within the bladder (pulled back until the balloon was on the bladder base), then pushed ‘a little bit’ inside, e.g. 2 mm to 1.5 cm; (5) Patient movement causing thermal catheter displacement; and (6) slipping of the thermal mapping system. For instance, curling, sticking and slip of the catheter or disconnection of the catheter to the thermal mapper tube decreases the accuracy of tissue type assignment. Obviously, the cumulative effect of these errors may be large.
When one questions whether correction in changes of the insertion length is a necessity, the first issue is to decide about tissue type assignment at the border and at the exit of the catheter from the lumen. Moreover, the validity of the temperature points in regard to normal or enhanced cooling at the perineum should be considered. This problem was solved by correcting the tissue definition if very low temperatures were shown at the first thermal map. Furthermore, if necessary the location of the transition was adapted to match better with the steep temperature gradient or to correct for small movement of thermometry catheter during the whole treatment session. The statistical analysis in this study does not show any influence of varying the outer 1 or 2 cm of mapping position on the results.
Since the current method for tissue type assignment is based on the tissue map trajectories, which were deduced from the pre-treatment radiotherapy position CT scan information, it is questionable whether one can rely on this kind of information for tissue type assignment. The authors are currently performing a new study in which the hyperthermia record data is collected from the patients who have CT scan information in hyperthermia position as well as radiotherapy position. Further, one will continue the analysis of thermometry data and investigate the profile of the vaginal temperature in patients who have only tumour or normal tissue in the vagina lumen. The results of these studies will support the arriving at standards for thermal dosimetry and facilitate comparison of the results of the clinical studies.
Conclusion
In this thermal data analysis study no statistical difference was found between the T50 measured in normal tissue and tumour indicative in the rectum. Although the differences that were found between T50 of normal tissue and tumour contact in the vagina and also between T50 of normal tissue and tumour indicative in the bladder are statistically significant; it must be considered that in a statistical analysis of thermal data with a large amount of data a very small difference (e.g. 0.1°C) can be detected (statistically). At this moment one doesn't know whether the temperature differences that were found in this study are real differences or are due to the error associated with the method of tissue type assignment. As the differences are non-relevant or ‘borderline’ relevant and also since the exact location of each temperature point is not sure, it can be concluded that there is not enough evidence to state that these statistical differences are clinically relevant. Consequently, the conclusion is that at present discrimination between normal and tumour tissue in intra-luminal thermometry does not provide more accurate and relevant clinical information, so there is no need to do it.
Acknowledgement
This work was supported by the Dutch Cancer Society grant 2003-2884. The first author was supported financially by the Shahrekord University of Medical Sciences (related to the Iranian Ministry of Health, Treatment and Medical Education). The authors would like to thank Mrs L. Verloop for her technical assistance.
References
- Fatehi D, de Bruijne M, van der Zee J, van Rhoon GC. RHyThM, a tool for analysis of PDOS formatted hyperthermia treatment data generated by the BSD2000/3D system. Int J Hyperthermia 2006; 22: 173–184
- Lagendijk JJW, van Rhoon GC, Hornsleth SN, Wust P, de Leeuw ACC, Schneider CJ, van Dijk JDP, van der Zee J, van Heek-Romanowski R, Rahman SA, et al. ESHO quality assurance guidelines for regional hyperthermia. Int J Hyperthermia 1998; 2: 125–133
- Fatehi D, van der Zee J, van der Wal E, van Wieringen WN, van Rhoon GC. Temperature data analysis for 22 patients with advanced cervical carcinoma treated in Rotterdam using radiotherapy, hyperthermia and chemotherapy: A reference point is needed. Int J Hyperthermia 2006, In press
- Wielheesen DHM, de Bruijne M, Graveland WJ, van Rhoon GC, van der Zee J. Leg coverage with towels during regional deep hyperhermia treatment and its effect on pelvic temperature and temperature distribution. Int J Hyperthermia 2005; 21: 77–87
- Turner PF, Tumeh A, Schaefermeyer T. BSD-2000 approach for deep local and regional hyperthermia: Physics and technology. Strahlenther Onkol 1989; 165: 738–741
- Bowman R. A probe for measuring temperature in radio frequency heated material. IEEE Trans. MTT 1976; 24: 43–45
- Feldmann HJ, Molls M, Krumpelmann S, Stuschke M, Sack H. Deep regional hyperthermia: Comparison between the annular phased array and the sigma-60 applicator in the same patients. Int J Radiat Oncol Biol Phys 1993; 26: 111–116
- Sneed PK, Gutin PH, Stauffer PR, Phillips TL, Prados MD, Weaver KA, Suen S, Lamba A, Ham B, Ahn DK. Thermoradiotherapy of recurrent malignant brain tumors. Int J Radiat Oncol Biol Phys 1992; 23: 853–861
- Shimm DS, Kittelson JM, Oleson JR, Aristizabal SA, Barlow LC, Cetas TC. Interstitial thermoradiotherapy: Thermal dosimetry and clinical results. Int J Radiat Oncol Biol Phys 1990; 18: 383–387
- Oleson JR, Samulski TV, Leopold KA, Clegg ST, Dewhirst MW, Dodge RK, George SL. Sensitivity of hyperthermia trial outcomes to temperature and time: Implications for thermal goals of treatment. Int J Radiat Oncol Biol Phys 1993; 25: 289–297
- Kapp DS, Cox RS. Thermal treatment parameters are most predictive of outcome in patients with single tumor nodules per treatment field in recurrent adenocarcinoma of the breast. Int J Radiat Oncol Biol Phys 1995; 33: 887–899
- Sherar M, Liu FF, Pintilie M, Levin W, Hunt J, Hill R, Hand J, Vernon C, van Rhoon G, van der Zee J, et al. Relationship between thermal dose and outcome in thermoradiotherapy treatments for superficial recurrences of breast cancer: Data from a phase III trial. Int J Radiat Oncol Biol Phys 1997; 39: 371–380
- Lee HK, Antell AG, Perez CA, Straube WL, Ramachandran G, Myerson RJ, Emami B, Molmenti EP, Buckner A, Lockett MA. Superficial hyperthermia and irradiation for recurrent breast carcinoma of the chest wall: Prognostic factors in 196 tumors. Int J Radiat Oncol Biol Phys 1998; 15: 365–375
- Wust P, Rau B, Gellerman J, Pegios W, Loffel J, Riess H, Felix R, Schlag PM. Radiochemotherapy and hyperthermia in the treatment of rectal cancer. Recent Res Cancer Res 1998; 146: 175–191
- Sneed PK, Dewhirst MW, Samulski TV, Blivin RNJ, Prosnitz LR. Should interstitial thermometry be used for deep hyperthermia?. Int J Radiat Oncol Biol Phys 1998; 40: 1015–1017
- Dewhirst MW, Sneed PK. Those in gene therapy should pay closer attention to lessons from hyperthermia. Int J Radiat Oncol Biol Phys 2003; 57: 597–599
- van der Zee J, van Rhoon GC, Wust P. Letters to editor. Int J Radiat Oncol Biol Phys 2005; 62: 940–941